. 2016:580:21-44.
doi: 10.1016/bs.mie.2016.05.002. Epub 2016 Aug 8.

Cell-Binding Assays for Determining the Affinity of Protein-Protein Interactions: Technologies and Considerations

Affiliations

Cell-Binding Assays for Determining the Affinity of Protein-Protein Interactions: Technologies and Considerations

S A Hunter et al. Methods Enzymol. 2016.

Abstract

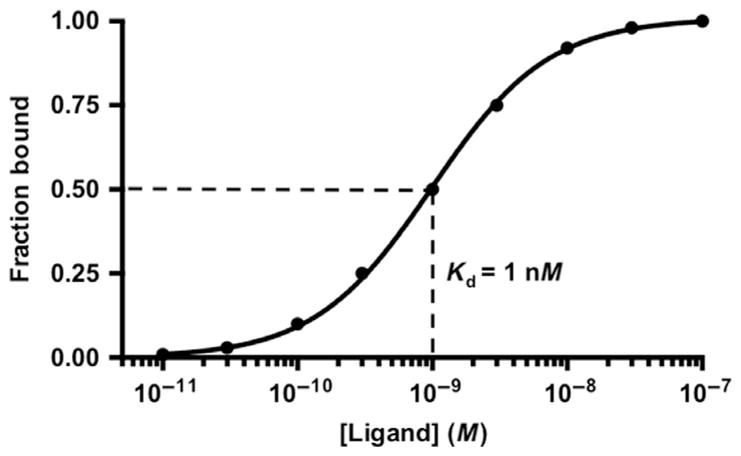
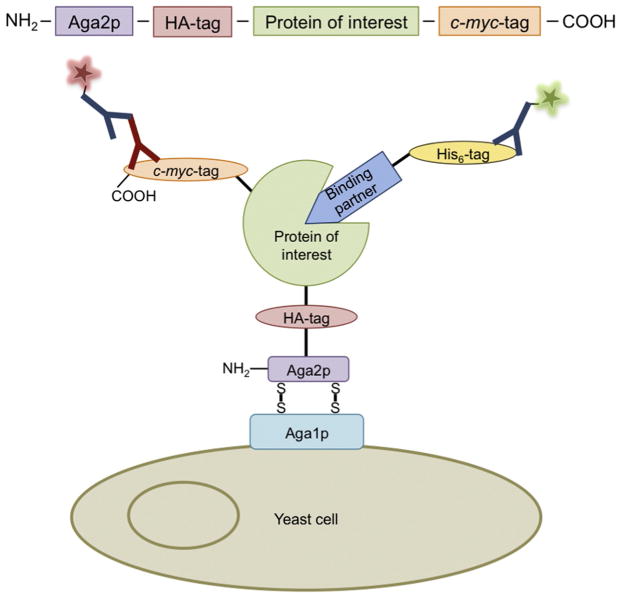
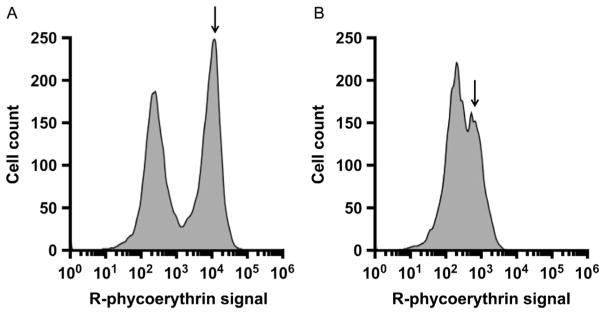
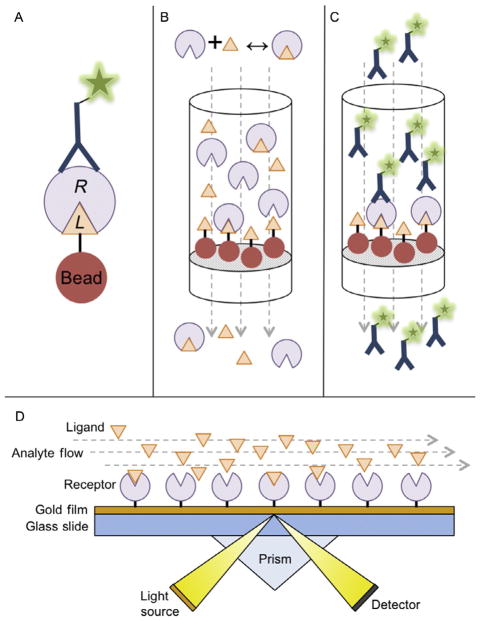
Determining the equilibrium-binding affinity (Kd) of two interacting proteins is essential not only for the biochemical study of protein signaling and function but also for the engineering of improved protein and enzyme variants. One common technique for measuring protein-binding affinities uses flow cytometry to analyze ligand binding to proteins presented on the surface of a cell. However, cell-binding assays require specific considerations to accurately quantify the binding affinity of a protein-protein interaction. Here we will cover the basic assumptions in designing a cell-based binding assay, including the relevant equations and theory behind determining binding affinities. Further, two major considerations in measuring binding affinities-time to equilibrium and ligand depletion-will be discussed. As these conditions have the potential to greatly alter the Kd, methods through which to avoid or minimize them will be provided. We then outline detailed protocols for performing direct- and competitive-binding assays against proteins displayed on the surface of yeast or mammalian cells that can be used to derive accurate Kd values. Finally, a comparison of cell-based binding assays to other types of binding assays will be presented.

Keywords: Cell-binding assay; Equilibrium; K(d); KinExA; Ligand depletion; SPR; Yeast surface display.


Figures

Fig. 1
Fig. 1
Sigmoidal binding curve of varying concentrations of ligand bound to cell surface receptor. Dashed lines demarcate the Kd (1 nM) as the ligand concentration at 0.5 fraction bound.
Fig. 2
Fig. 2
The effects of equilibrium time on ligand binding to displayed receptor. Dashed lines represent the Kd of each binding curve. The equilibrium-binding curve (represented by black circles) shows a binding reaction that was allowed to go to equilibrium and reveals the true Kd of 150 pM. The nonequilibrium-binding curve (represented by red (gray in the print version) triangles) shows the results of a binding reaction that was not allowed enough time to come to equilibrium. The measured Kd of this curve is now 2 nM, a roughly tenfold difference above the actual Kd.
Fig. 3
Fig. 3
The effects of ligand depletion on cell-binding assay measurements. Dashed lines represent the Kd of each binding curve. The equilibrium-binding reaction curve (represented by black circles) was performed using appropriate volumes at each concentration to avoid ligand depletion, while the ligand depletion reaction curve (represented by blue (dark gray in the print version) diamonds) did not. The measured Kd of this curve is 2 nM, a 10-fold difference above the actual Kd of 150 pM. These data are tabulated in Table 2.
Fig. 4
Fig. 4
A schematic of yeast surface display. In this case, the binding partner protein is detected using a fluorescently labeled antibody against a His6-tag, although other epitope tags or a fluorescently labeled binding partner can be used. The pCTCON2 vector layout and display system is shown. The N-terminus of the protein of interest is fused to the C-terminus of Aga2p; a C-terminal c-myc tag allows the expression of full-length protein to be measured with a fluorescent secondary antibody binding to an anti-c-myc antibody. Alternatively, the pTMY vector layout and display system (not shown) results in a C-terminal fusion of the protein of interest to N-terminus of Aga2p, with an exposed HA expression tag. Expression is then detected with an anti-HA antibody.
Fig. 5
Fig. 5
Expression histograms of example protein displayed on the surface of yeast. The y-axis is the number of cells and the x-axis is the PE signal. (A) Expression at 20°C, with a tightly defined expressing population (arrow). (B) Expression at 30°C, with a poorly defined expressing population (arrow). Differences between A and B are due to yeast growth and overall protein folding and expression levels.
Fig. 6
Fig. 6
Mammalian cell competition assay. Competitor was fluorescently labeled with Alexa Fluor 488 prior to assay. Reactions were carried out with varying concentrations of ligand. Dotted lines mark the IC50 (4 nM).
Fig. 7
Fig. 7
(A–C) KinExA. (A) Close up of the KinExA bead-based detection system. Ligand affixed to beads in a column bind soluble, free receptor, which is detected via fluorescent antibody binding to receptor. (B and C) Schematic of the KinExA assay. (B) Soluble ligand and receptor are incubated until equilibrium is reached. This reaction is flowed over the column, allowing free receptor at equilibrium to bind bead-affixed ligand. (C) After washing, bound receptor is detected using specific fluorescent antibodies and quantified. (D) Surface plasmon resonance. Receptor is affixed to a gold film surface. Ligand, or “analyte,” is flowed over the surface. Alterations in resonance due to binding are measured via a detector from light shone through a prism and analyzed. Note that for KinExA and SPR, the designation of ligand and receptor is arbitrary and can be reversed.

References

    1. Berson SA, Yalow RS. Quantitative aspects of the reaction between insulin and insulin-binding antibody. Journal of Clinical Investigation. 1959;38(11):1996–2016. - PMC - PubMed
    1. Blake RC, Pavlov AR, Blake DA. Automated kinetic exclusion assays to quantify protein binding interactions in homogeneous solution. Analytical Biochemistry. 1999;272(2):123–134. - PubMed
    1. Boder ET, Wittrup KD. Yeast surface display for screening combinatorial polypeptide libraries. Nature Biotechnology. 1997;15(6):553–557. doi: 10.1038/nbt0697-553. - DOI - PubMed
    1. Boder ET, Wittrup KD. Optimal screening of surface-displayed polypeptide libraries. Biotechnology Progress. 1998;14(1):55–62. - PubMed
    1. Boder ET, Wittrup KD. Yeast surface display for directed evolution of protein expression, affinity, and stability. Methods in Enzymology. 2000;328:430–444. - PubMed

Publication types