. 2017 Apr;176(2):278-293.
doi: 10.1007/s12011-016-0824-y. Epub 2016 Sep 1.

Activation of the EIF2α/ATF4 and ATF6 Pathways in DU-145 Cells by Boric Acid at the Concentration Reported in Men at the US Mean Boron Intake

Affiliations

Activation of the EIF2α/ATF4 and ATF6 Pathways in DU-145 Cells by Boric Acid at the Concentration Reported in Men at the US Mean Boron Intake

Sarah E Kobylewski et al. Biol Trace Elem Res. 2017 Apr.

Abstract

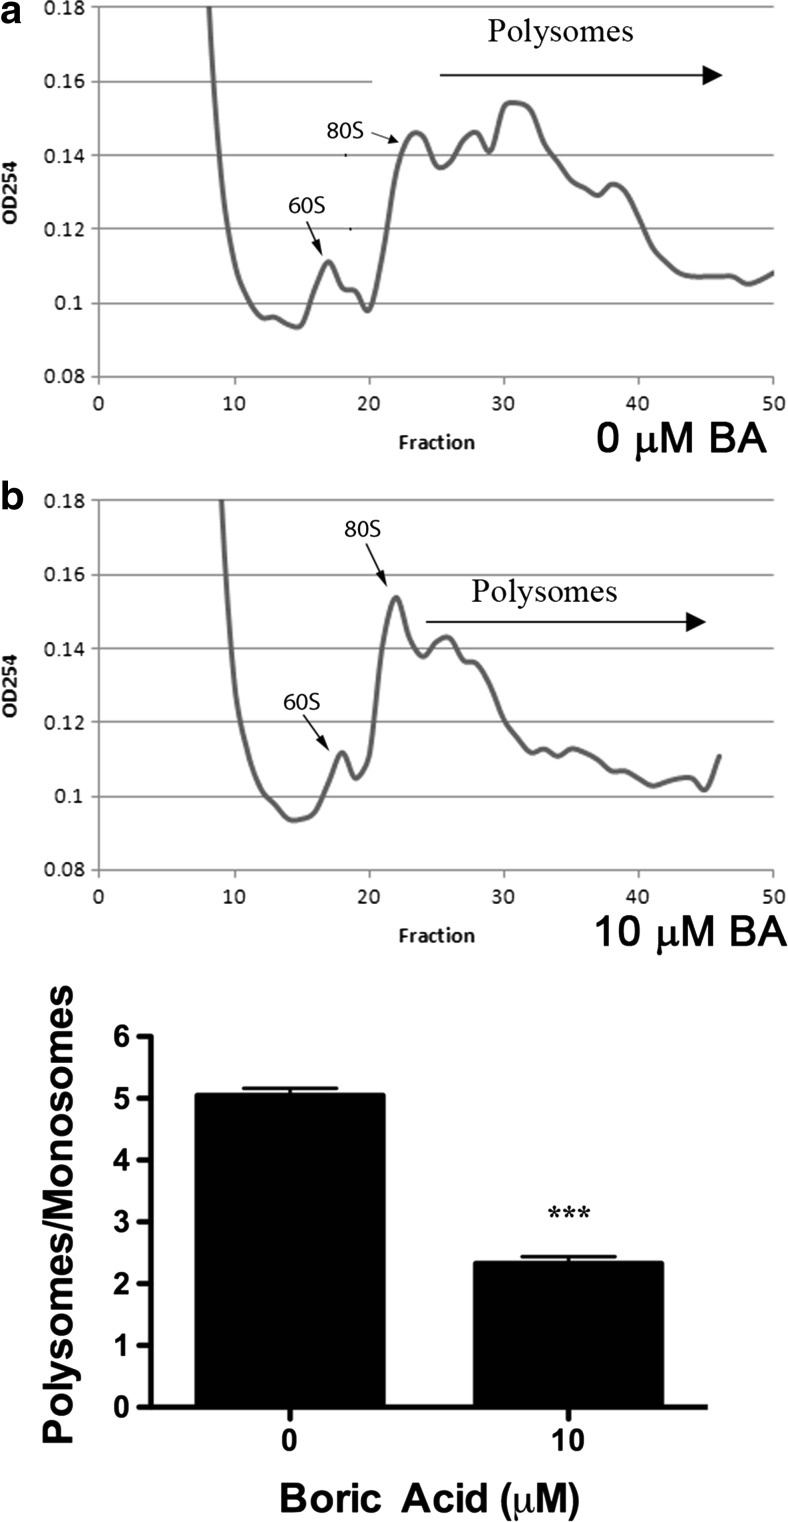
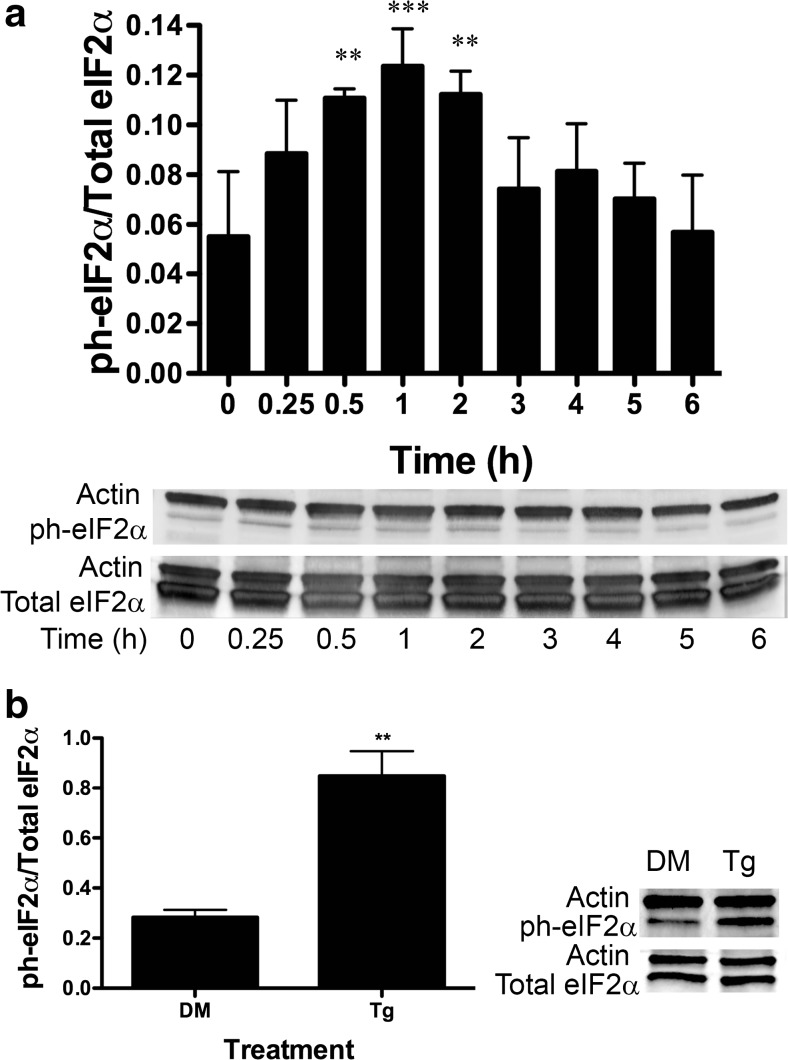
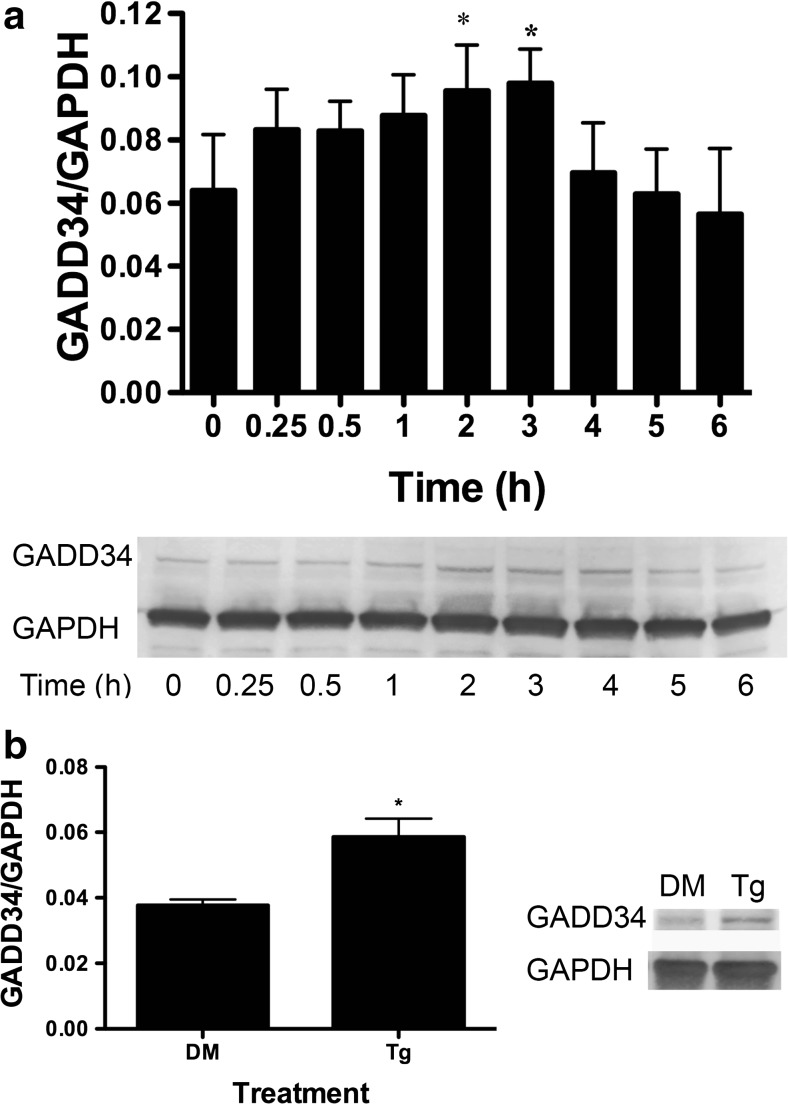
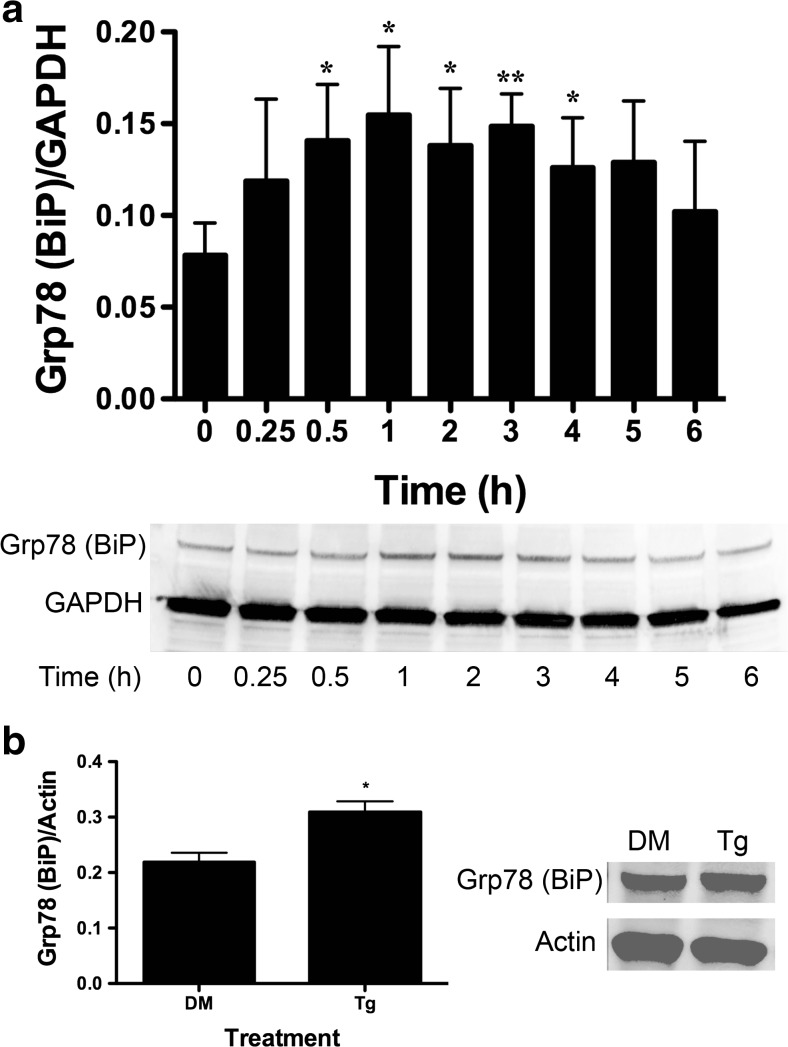
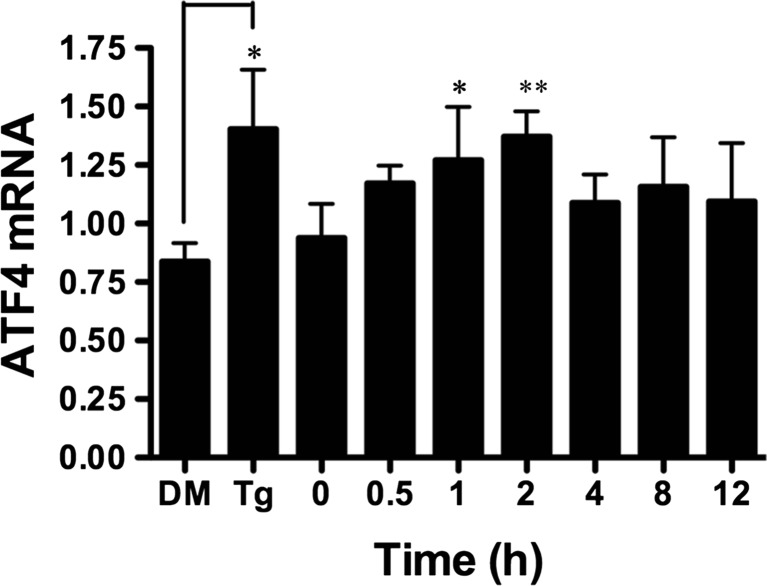
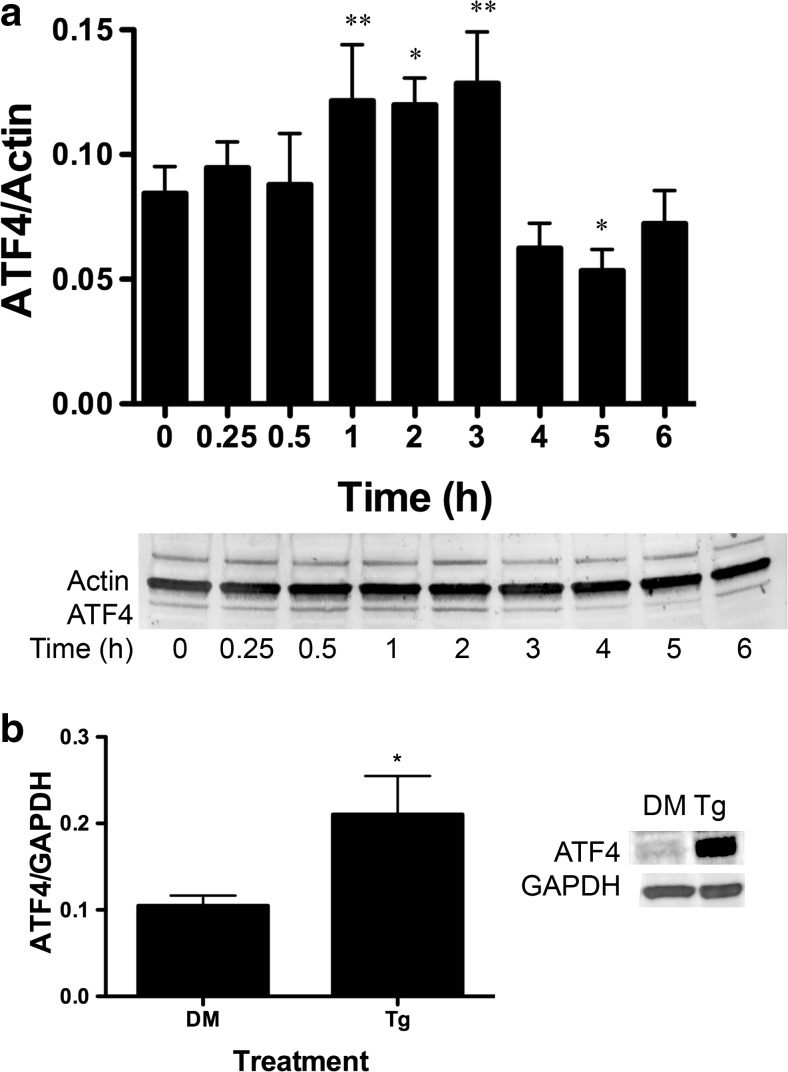
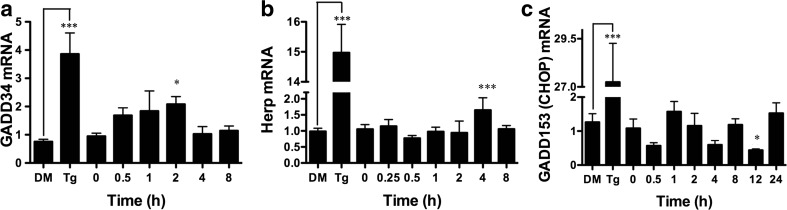
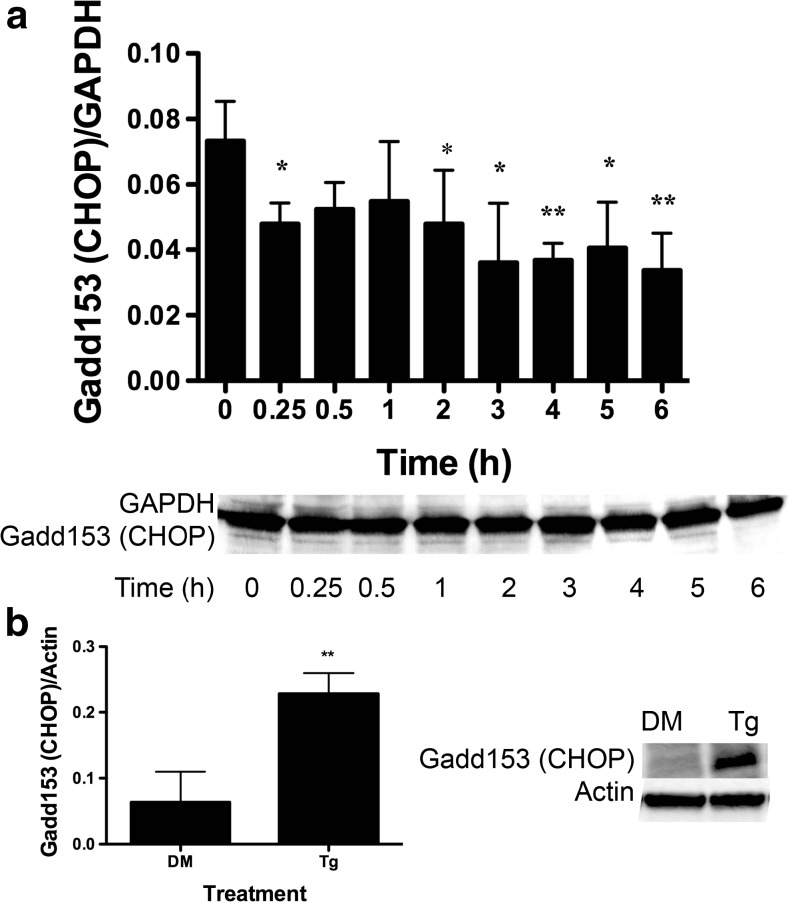
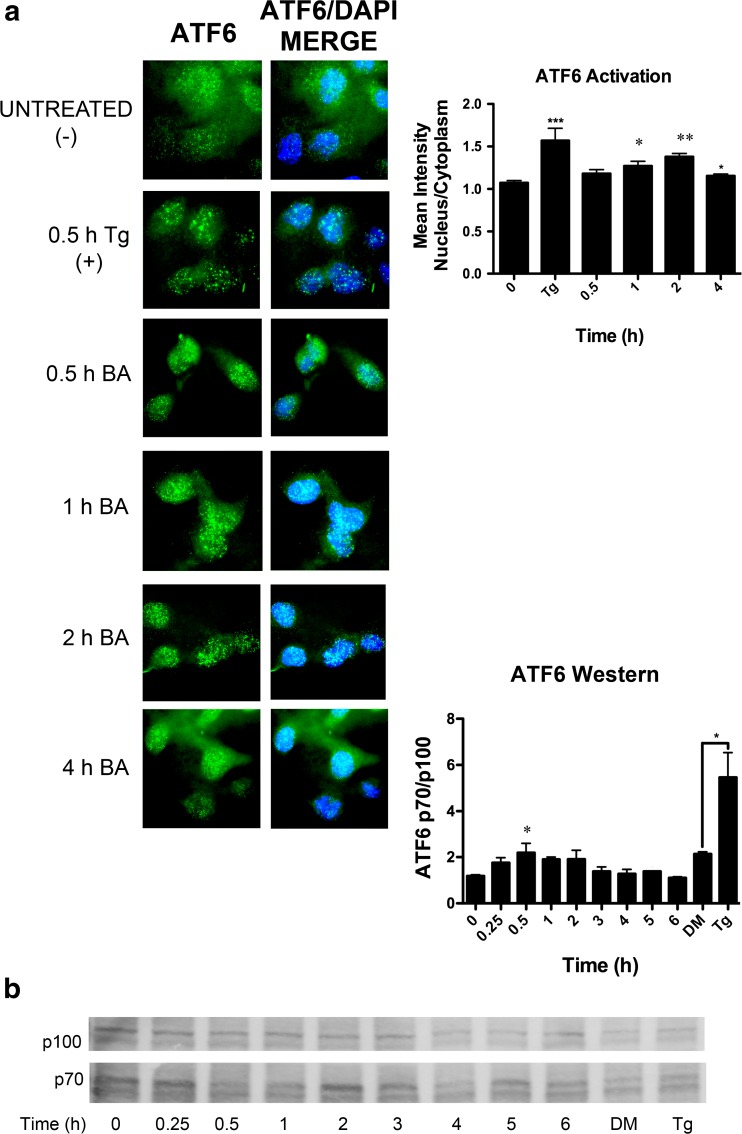
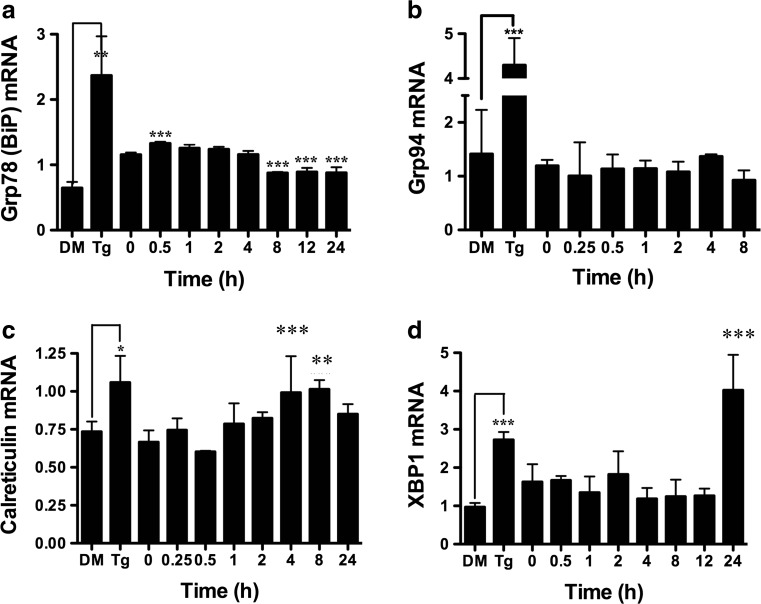
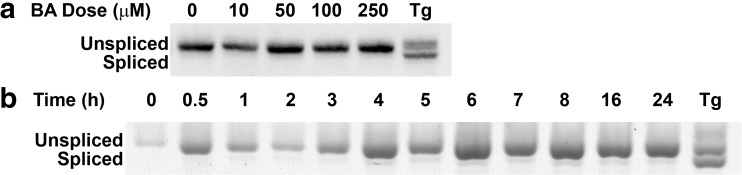
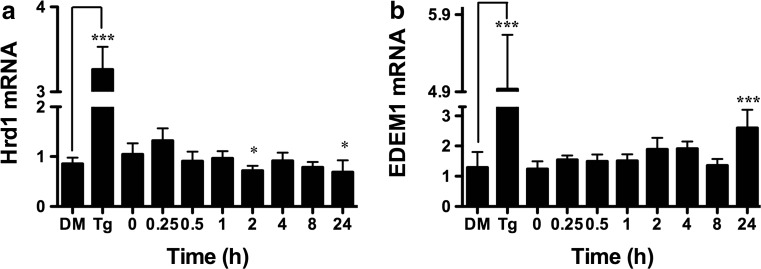
Fruits, nuts, legumes, and vegetables are rich sources of boron (B), an essential plant nutrient with chemopreventive properties. Blood boric acid (BA) levels reflect recent B intake, and men at the US mean intake have a reported non-fasting level of 10 μM. Treatment of DU-145 prostate cancer cells with physiological concentrations of BA inhibits cell proliferation without causing apoptosis and activates eukaryotic initiation factor 2 (eIF2α). EIF2α induces cell differentiation and protects cells by redirecting gene expression to manage endoplasmic reticulum stress. Our objective was to determine the temporal expression of endoplasmic reticulum (ER) stress-activated genes in DU-145 prostate cells treated with 10 μM BA. Immunoblots showed post-treatment increases in eIF2α protein at 30 min and ATF4 and ATF6 proteins at 1 h and 30 min, respectively. The increase in ATF4 was accompanied by an increase in the expression of its downstream genes growth arrest and DNA damage-induced protein 34 (GADD34) and homocysteine-induced ER protein (Herp), but a decrease in GADD153/CCAAT/enhancer-binding protein homologous protein (CHOP), a pro-apoptotic gene. The increase in ATF6 was accompanied by an increase in expression of its downstream genes GRP78/BiP, calreticulin, Grp94, and EDEM. BA did not activate IRE1 or induce cleavage of XBP1 mRNA, a target of IRE1. Low boron status has been associated with increased cancer risk, low bone mineralization, and retinal degeneration. ATF4 and BiP/GRP78 function in osteogenesis and bone remodeling, calreticulin is required for tumor suppressor p53 function and mineralization of teeth, and BiP/GRP78 and EDEM prevent the aggregation of misfolded opsins which leads to retinal degeneration. The identification of BA-activated genes that regulate its phenotypic effects provides a molecular underpinning for boron nutrition and biology.

Keywords: ATF4; ATF6A; Boric acid; Boron; Calreticulin (CALR); DU-145; EDEM1; GADD153/CHOP (DDIT3); GADD34 (PPP1R15A); GRP78/BiP (HSPa5); GRP94 (HSP90B1); Herp (HERPUD1); Hrd1 (SYVN1); Nutrition; RE1 (ERN1); XBP1; eIF2α (EIF2A).


Conflict of interest statement

Conflict of Interest

The authors declare that they have no conflict of interest.

Figures

Fig. 1
Fig. 1
BA induces a lower polysome/monosome ratio in DU-145 cells indicating a reduction in global protein translation. DU-145 cells treated with 10 μM BA for 2 h (a) had a significantly lower polysome/monosome ratio than did DU-145 cells treated with 0 μM BA for 2 h (b). Polysomes from untreated and BA-treated cells were obtained from cells treated in parallel using paired culture plates and centrifuging together in the same rotor. Figure shows a representative replicate. The difference in polysome/monosome ratios from three independent experiments was evaluated using a paired t test (p < 0.001, n = 3)
Fig. 2
Fig. 2
BA induces eIF2α phosphorylation at ser-51 in DU-145 cells. a DU-145 cells were treated with 10 μM BA for 0, 0.25, 0.5, 1, 2, 3, 4, 5, and 6 h. Phosphorylation of eIF2α was significantly higher at 0.5 (p < 0.006, n = 3), 1, (p < 0.001, n = 3), and 2 h (p < 0.005, n = 3) post-treatment. b DU-145 cells were treated with 1 μM thapsigargin (Tg), a strong positive control that induces stress and apoptosis, or DMSO (DM), the vehicle for Tg for 1 h, p < 0.01, n = 3. In Figs. 2, 3, 4, 5, 6, 7, 8, 9, 10, 11, and 12, the probabilities of statistical differences are represented as *p < 0.05, **p < 0.01, and ***p < 0.001. Gels shown in Figs. 2, 3, 4, 5, 6, 7, 8, 9, 10, 11, and 12 are a representative replicates of timed studies. Timed study data were analyzed using a one-way repeated measures analysis of variance (ANOVA) followed by a multiple comparison of individual post-treatment time points to treatment time 0 (control). Supplement 1 contains the ANOVA table for each figure giving the number of replicates for each time point and the results of the multiple comparison of each post-treatment time point to treatment time 0
Fig. 3
Fig. 3
BA induces an increase in GADD34 protein in DU-145 cells. a DU-145 cells were treated with 10 μM BA for 0, 0.25, 0.5, 1, 2, 3, 4, 5, and 6 h. GADD34 was increased in cells at 2 (p = 0.018, n = 3) and 3 h (p = 0.011, n = 3). b DU-145 cells treated with 1 μM thapsigargin (Tg) or DMSO (DM) for 1 h, (p < 0.05, n = 3). The gel shown is a representative replicate. A description of the statistical analysis is given in the legend of Fig. 2
Fig. 4
Fig. 4
BA induces an increase in GRP78 (BiP) protein in DU-145 cells. a DU-145 cells were treated with 10 μM BA for 0, 0.25, 0.5, 1, 2, 3, 4, 5, and 6 h. GAPDH was used as an internal loading control. GRP78/BiP translation was increased 0.5 (p = 0.028, n = 4), 1 (p = 0.007, n = 4), 2 h (p = 0.032, n = 4), and 3 h (p = 0.013, n = 4). b DU-145 cells treated with 1 μM thapsigargin (Tg) or DMSO (DM) vehicle for 1 h (p < 0.05, n = 3). The gel shown is a representative replicate. A description of the statistical analysis is given in the legend of Fig. 2
Fig. 5
Fig. 5
BA induces an increase in ATF4 transcription in DU-145 cells. Ten micromoles of BA induced a significant increase in ATF4 mRNA 1 (p = 0.031, n = 4) and 2 h (p = 0.005, n = 4) post-treatment. One micromole of thapsigargin (Tg) and DMSO vehicle (DM) was used as a positive control and significantly induced ATF4 mRNA, p < 0.05 (n = 5). The gel shown is a representative replicate. A description of the statistical analysis is given in the legend of Fig. 2
Fig. 6
Fig. 6
BA induces an increase in ATF4 protein in DU-145 cells. a DU-145 cells were treated with 10 μM BA for 0, 0.25, 0.5, 1, 2, 3, 4, 5, and 6 h. ATF4 protein was significantly increased in cells treated at 1 (p = 0.01, n = 4), 2 (p < 0.05, n = 3), and 3 h (p = 0.004, n = 3) and decreased at 5 h (p < 0.030, n = 4) post-treatment. b ATF3 protein was significantly increased in DU-145 cells treated with 1 μM thapsigargin (Tg) or DMSO (DM) for 1 h, (p < 0.05 n = 3). The gel shown is a representative replicate. A description of the statistical analysis is given in the legend of Fig. 2
Fig. 7
Fig. 7
ATF4-inducible genes GADD34 and Herp are upregulated and CHOP downregulated by BA in DU-145 cells. Ten micromoles of BA induced expression of a GADD34 at 2 h (p < 0.05), n = 4) and b Herp (p < 0.001, n = 8)) at 4 h post-treatment and c downregulated expression of GADD153 (CHOP) 12 h post-treatment (p = 0.012, n = 4). As a positive control, 1 μM thapsigargin (Tg) upregulated expression of all three genes compared to DMSO vehicle (DM), (p < 0.05, n = 3). A description of the statistical analysis is given in the legend of Fig. 2
Fig. 8
Fig. 8
GADD153 (CHOP) protein was reduced in BA-treated DU-145 cells. a DU-145 cells treated with 10 μM BA for 0, 0.25, 0.5, 1, 2, 3, 4, 5, and 6 h. GADD153 (CHOP) protein was decreased at 0.25 (p < 0.043, n = 3), 2 (p < 0.033, n = 3), 3 (p < 0.015, n = 4), 4 (p < 0.006, n = 4), 5 (p < 0.014, n = 4), and 6 h (p < 0.003, n = 4). b DU-145 cells treated with 1 μM thapsigargin (Tg) or DMSO (DM) vehicle for 1 h. Thapsigargin increased GADD153 (CHOP) protein, (p < 0.05, n = 3). The gel shown is a representative replicate. A description of the statistical analysis is given in the legend of Fig. 2
Fig. 9
Fig. 9
BA stimulates ATF6 activation and translocation to the nucleus. a ATF6 (green) was present in the nucleus (blue) of DU-145 cells 1 (p = 0.026, n = 17) and 2 h (p = 0.002, n = 48) post-treatment with 10 μM BA. b ATF6 is activated by cleavage. The proportion of the cleaved product (p70) to full length (p100) was significantly elevated 30 min post-treatment (p = 0.032, n = 3). One micromole of thapsigargin (Tg) also significantly increased the p70/p100 ratio (p < 0.05) (n = 15). The gel shown is a representative replicate. A description of the statistical analysis is given in the legend of Fig. 2. (Color figure online)
Fig. 10
Fig. 10
BA upregulates ATF6-inducible genes BiP, GRP94, calreticulin, and XBP1. Ten micromoles of BA induced expression of a GRP78 (BiP) at 0.5 h (p < 0.001, n = 4). GRP78 returned to control levels for several hours and then dropped to lower levels at 8 h (p < 0.001, n = 4), 12 h (p < 0.001, n = 4), and 24 h (p < 0.001, n = 4), suggesting that the cells adapted to higher concentrations of BA. b GRP94 was unchanged by treatment. c Calreticulin was higher at 4 h (p < 0.001, n = 5) and 8 h (p = 0.003, n = 4). d XBP1 was higher at 24 h of treatment (p < 0.001, n = 4). As a positive control, 1 μM thapsigargin (Tg) upregulated expression of all genes compared to DMSO vehicle (DM) (p < 0.05, n = 4). The gel shown is a representative replicate. A description of the statistical analysis is given in the legend of Fig. 2
Fig. 11
Fig. 11
BA does not activate the IRE1 signaling pathway. a DU-145 cells were treated with 0, 10, 50, 100, or 250 μM BA or 1 μM thapsigargin (Tg) for 24 h. Thapsigargin was used as a positive control. Increasing BA concentrations for 24 h did not cause XBP1 cleavage. b DU-145 cells were treated with 10 μM BA for varying time points or 1 μM thapsigargin (Tg) as a positive control. XBP1 was not cleaved at any time point by BA, but it was by Tg (p < 0.05, n = 3). The gel shown is a representative replicate
Fig. 12
Fig. 12
BA does not activate the XBP1s-inducible gene Hrd1, but did activate Edem1 which is also induced by ATF6 and XBP1. a Ten micromoles of BA did not induce expression of Hrd1 mRNA in DU-145 cell which dropped below pre-treatment values at 2 h (p < 0.05, n = 4) and 24 h (p < 0.05, n = 3). b Ten micromoles of BA induced expression of Edem1 at 24 h (p < 0.001, n = 4) which is regulated by ATF6 and IRE1. As a positive control 1 μM thapsigargin (Tg) upregulated expression of both genes compared to DMSO vehicle (DM), (n = 6). The gel shown is a representative replicate. A description of the statistical analysis is given in the legend of Fig. 2

Similar articles

Cited by

References

    1. Barranco W, Hudak P, Eckhert C. Evaluation of ecological and in vitro effects of boron on prostate cancer risk. Cancer Causes Control. 2007;18:71–77. doi: 10.1007/s10552-006-0077-8. - DOI - PubMed
    1. Barranco W, Hudak P, Eckhert CD. Erratum: evaluation of ecological and in vitro effects of boron on prostate cancer risk. Cancer Causes Control. 2007;18:583–584. doi: 10.1007/s10552-006-0077-8. - DOI - PubMed
    1. Cui Y, Winton M, Zhang Z, Rainey C, Marshall J, et al. Dietary boron intake and prostate cancer risk. Oncol Rep. 2004;11:887–892. - PubMed
    1. Muezzinoglu T, Korkmaz M, Nese N, Bakirdere S, Arslan Y, et al. (2011) Prevalence of prostate cancer in high boron-exposed population: a community-based study. Biol Trace Elem Res - PubMed
    1. Barranco W, Eckhert C. Boric acid inhibits prostate cancer cell proliferation. Cancer Lett. 2004;216:21–29. doi: 10.1016/j.canlet.2004.06.001. - DOI - PubMed

MeSH terms