

Quantitative quality assurance in a multicenter HARDI clinical trial at 3T
- PMID: 27587227
- PMCID: PMC5125830
- DOI: 10.1016/j.mri.2016.08.022
Quantitative quality assurance in a multicenter HARDI clinical trial at 3T
Abstract
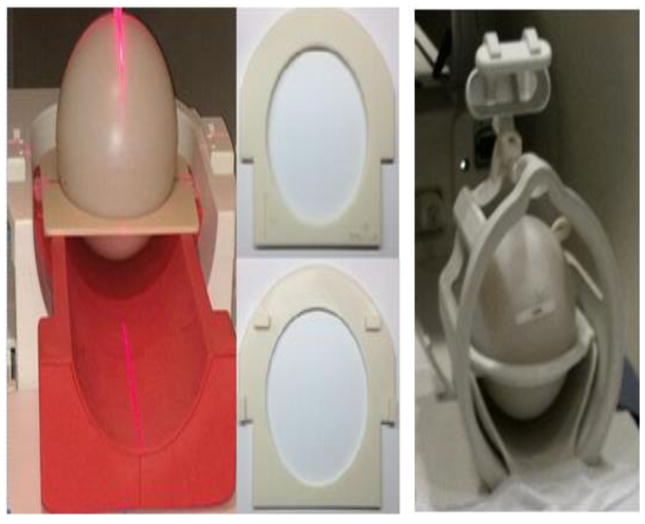
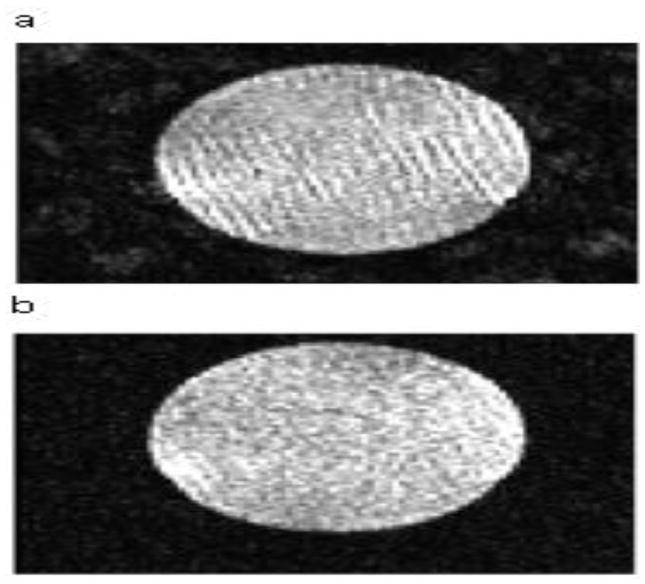
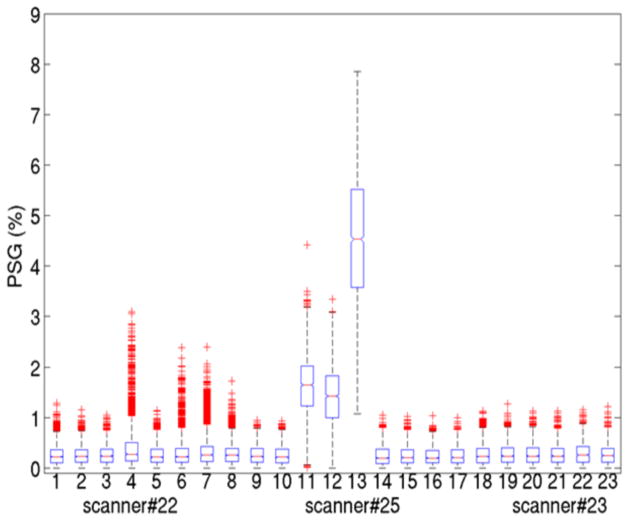
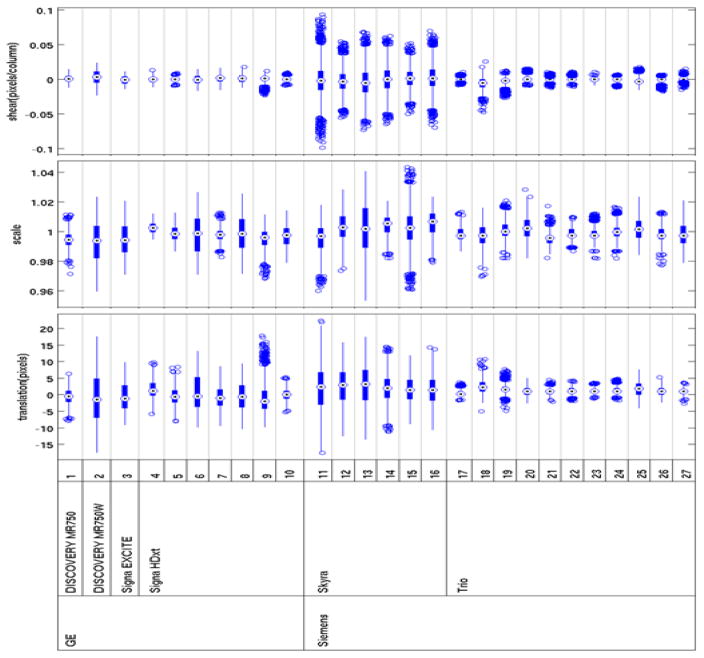
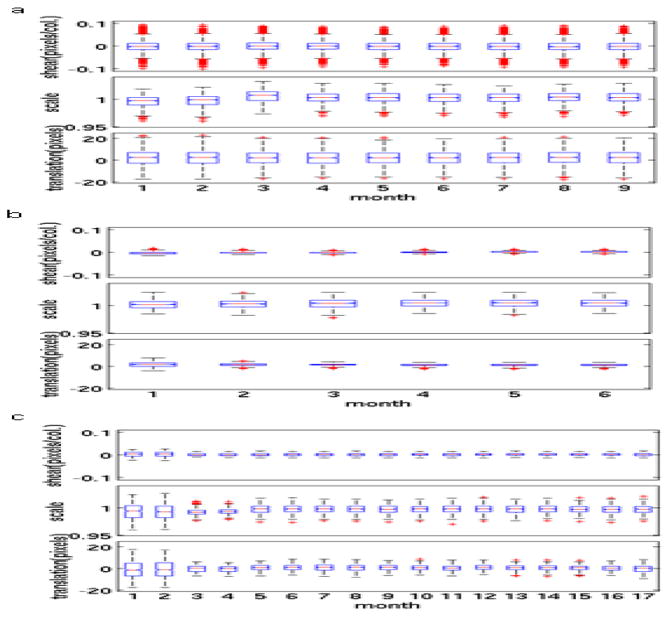
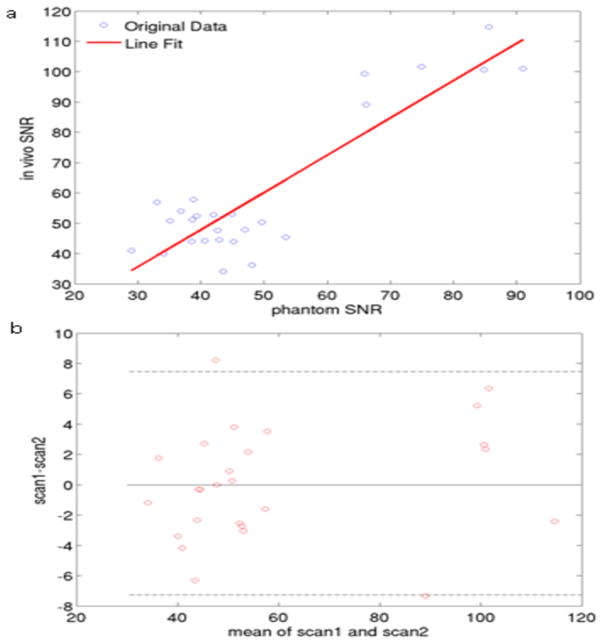
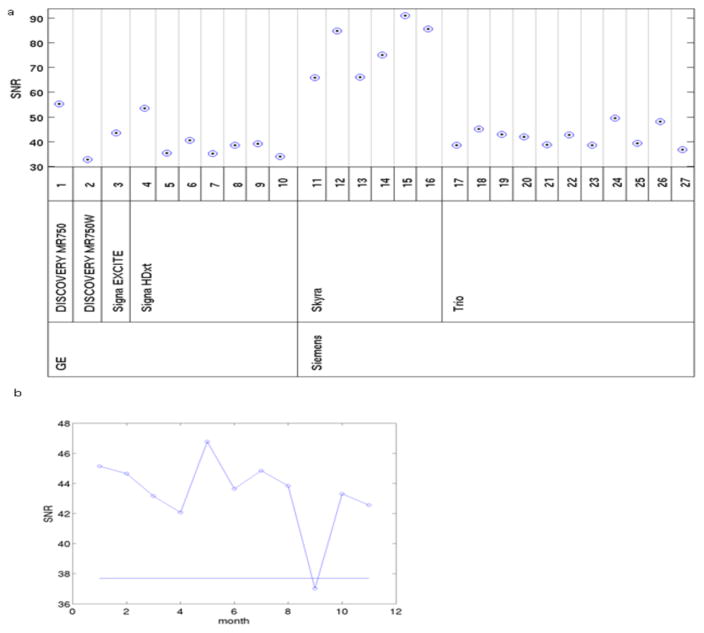
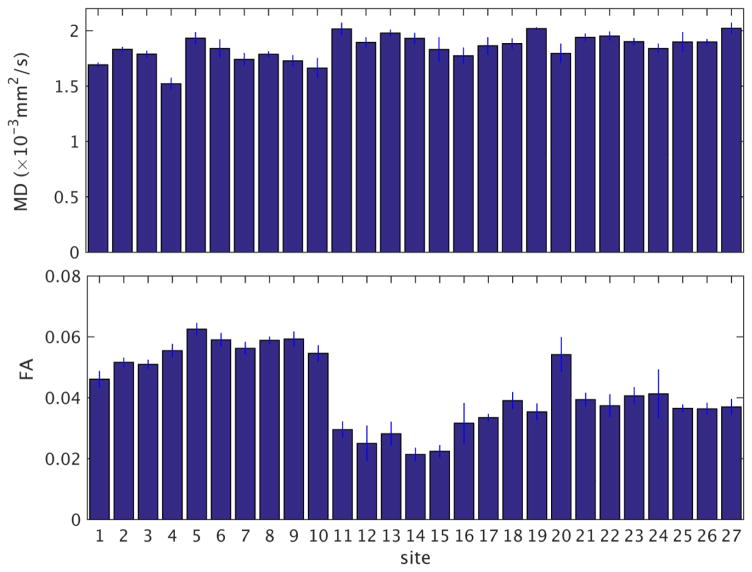
A phantom-based quality assurance (QA) protocol was developed for a multicenter clinical trial including high angular resolution diffusion imaging (HARDI). A total of 27 3T MR scanners from 2 major manufacturers, GE (Discovery and Signa scanners) and Siemens (Trio and Skyra scanners), were included in this trial. With this protocol, agar phantoms doped to mimic relaxation properties of brain tissue are scanned on a monthly basis, and quantitative procedures are used to detect spiking and to evaluate eddy current and Nyquist ghosting artifacts. In this study, simulations were used to determine alarm thresholds for minimal acceptable signal-to-noise ratio (SNR). Our results showed that spiking artifact was the most frequently observed type of artifact. Overall, Trio scanners exhibited less eddy current distortion than GE scanners, which in turn showed less distortion than Skyra scanners. This difference was mainly caused by the different sequences used on these scanners. The SNR for phantom scans was closely correlated with the SNR from volunteers. Nearly all of the phantom measurements with artifact-free images were above the alarm threshold, suggesting that the scanners are stable longitudinally. Software upgrades and hardware replacement sometimes affected SNR substantially but sometimes did not. In light of these results, it is important to monitor longitudinal SNR with phantom QA to help interpret potential effects on in vivo measurements. Our phantom QA procedure for HARDI scans was successful in tracking scanner performance and detecting unwanted artifacts.
Keywords: HARDI; Multicenter; Phantom; QA; SNR.
Copyright © 2016 Elsevier Inc. All rights reserved.
Figures
Similar articles
-
A novel DTI-QA tool: Automated metric extraction exploiting the sphericity of an agar filled phantom.Magn Reson Imaging. 2018 Feb;46:28-39. doi: 10.1016/j.mri.2017.07.027. Epub 2017 Oct 17. Magn Reson Imaging. 2018. PMID: 29054737 Free PMC article.
-
Scan-rescan repeatability and cross-scanner comparability of DTI metrics in healthy subjects in the SPRINT-MS multicenter trial.Magn Reson Imaging. 2018 Nov;53:105-111. doi: 10.1016/j.mri.2018.07.011. Epub 2018 Jul 23. Magn Reson Imaging. 2018. PMID: 30048675 Free PMC article.
-
Design of a fused phantom for quantitative evaluation of brain metabolites and enhanced quality assurance testing for magnetic resonance imaging and spectroscopy.J Neurosci Methods. 2015 Nov 30;255:75-84. doi: 10.1016/j.jneumeth.2015.08.005. Epub 2015 Aug 13. J Neurosci Methods. 2015. PMID: 26277420
-
Report on a multicenter fMRI quality assurance protocol.J Magn Reson Imaging. 2006 Jun;23(6):827-39. doi: 10.1002/jmri.20583. J Magn Reson Imaging. 2006. PMID: 16649196 Review.
-
Development and validation of a novel large field of view phantom and a software module for the quality assurance of geometric distortion in magnetic resonance imaging.Magn Reson Imaging. 2015 Sep;33(7):939-49. doi: 10.1016/j.mri.2015.04.003. Epub 2015 Apr 14. Magn Reson Imaging. 2015. PMID: 25882440 Review.
Cited by
-
Multicenter dataset of multi-shell diffusion MRI in healthy traveling adults with identical settings.Sci Data. 2020 May 27;7(1):157. doi: 10.1038/s41597-020-0493-8. Sci Data. 2020. PMID: 32461581 Free PMC article.
-
A novel DTI-QA tool: Automated metric extraction exploiting the sphericity of an agar filled phantom.Magn Reson Imaging. 2018 Feb;46:28-39. doi: 10.1016/j.mri.2017.07.027. Epub 2017 Oct 17. Magn Reson Imaging. 2018. PMID: 29054737 Free PMC article.
-
Vitamin D Levels and Visual System Measurements in Progressive Multiple Sclerosis: A Cross-sectional Study.Int J MS Care. 2021 Mar-Apr;23(2):53-58. doi: 10.7224/1537-2073.2020-005. Epub 2020 Apr 28. Int J MS Care. 2021. PMID: 33880080 Free PMC article.
-
Variability and Standardization of Quantitative Imaging: Monoparametric to Multiparametric Quantification, Radiomics, and Artificial Intelligence.Invest Radiol. 2020 Sep;55(9):601-616. doi: 10.1097/RLI.0000000000000666. Invest Radiol. 2020. PMID: 32209816 Free PMC article. Review.
-
The sensitivity of diffusion MRI to microstructural properties and experimental factors.J Neurosci Methods. 2021 Jan 1;347:108951. doi: 10.1016/j.jneumeth.2020.108951. Epub 2020 Oct 2. J Neurosci Methods. 2021. PMID: 33017644 Free PMC article. Review.
References
-
- Barkhof F, Hulst HE, Drulovic J, Uitdehaag BM, Matsuda K, Landin R, et al. Ibudilast in relapsing-remitting multiple sclerosis: a neuroprotectant? Neurology. 2010;74:1033–40. - PubMed
-
- Tuch DS, Reese TG, Wiegell MR, Makris N, Belliveau JW, Wedeen VJ. High angular resolution diffusion imaging reveals intravoxel white matter fiber heterogeneity. Magn Reson Med. 2002;48:577–82. - PubMed
-
- Teipel SJ, Reuter S, Stieltjes B, Acosta-Cabronero J, Ernemann U, Fellgiebel A, et al. Multicenter stability of diffusion tensor imaging measures: a European clinical and physical phantom study. Psychiatry Res. 2011;194:363–71. - PubMed
Publication types
MeSH terms
Grants and funding
LinkOut - more resources
Full Text Sources
Other Literature Sources
Medical
