

Reference Tissue-Based Kinetic Evaluation of 18F-AV-1451 for Tau Imaging
- PMID: 27587706
- PMCID: PMC5288744
- DOI: 10.2967/jnumed.116.175273
Reference Tissue-Based Kinetic Evaluation of 18F-AV-1451 for Tau Imaging
Abstract
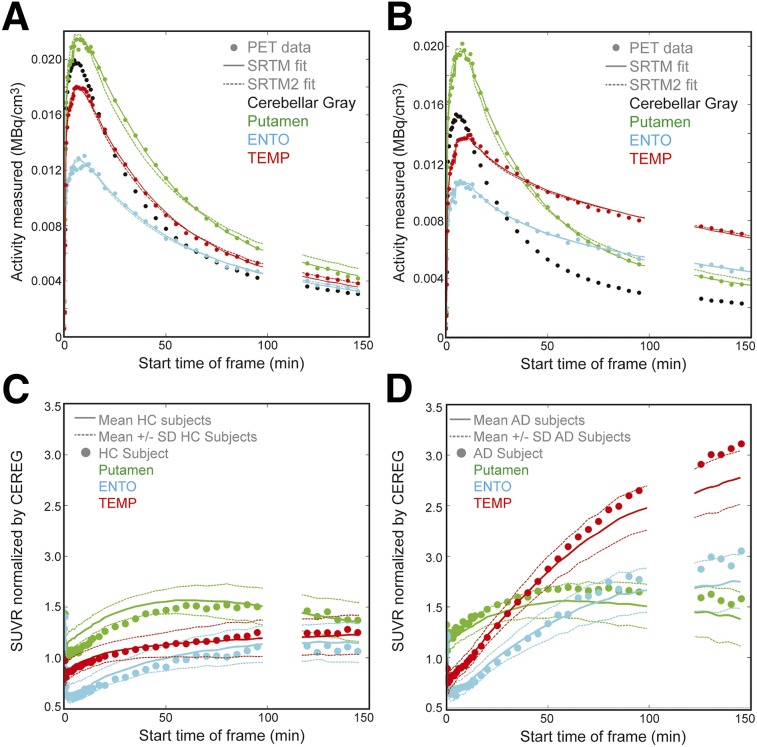
The goal of this paper was to evaluate the in vivo kinetics of the novel tau-specific PET radioligand 18F-AV-1451 in cognitively healthy control (HC) and Alzheimer disease (AD) subjects, using reference region analyses.
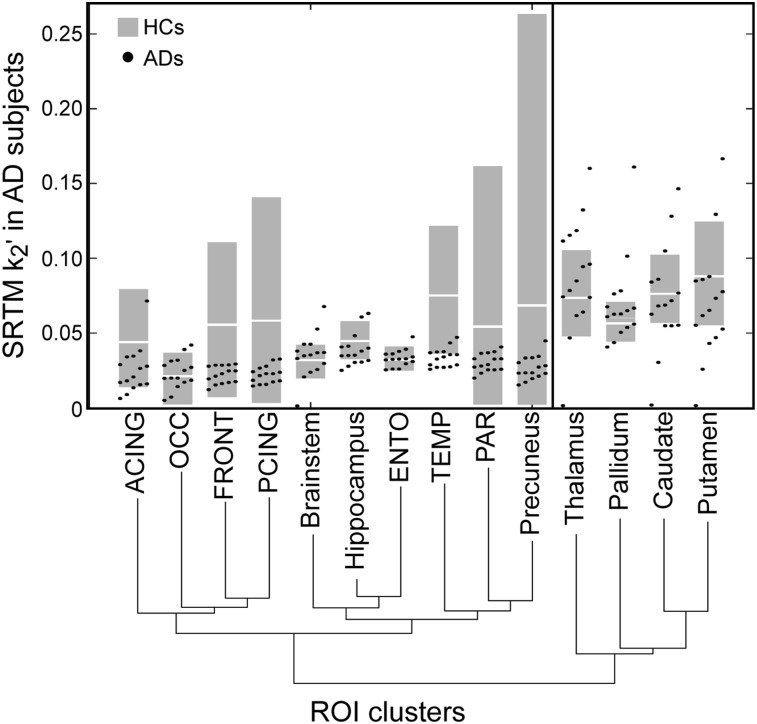
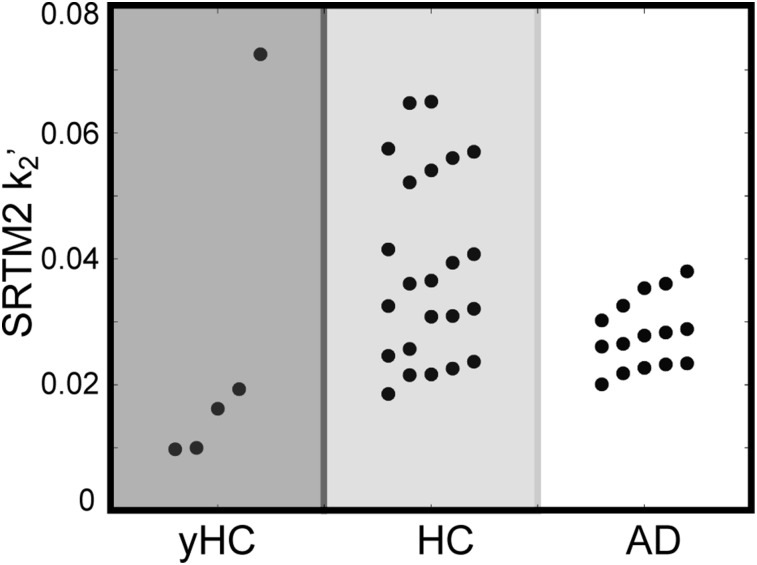
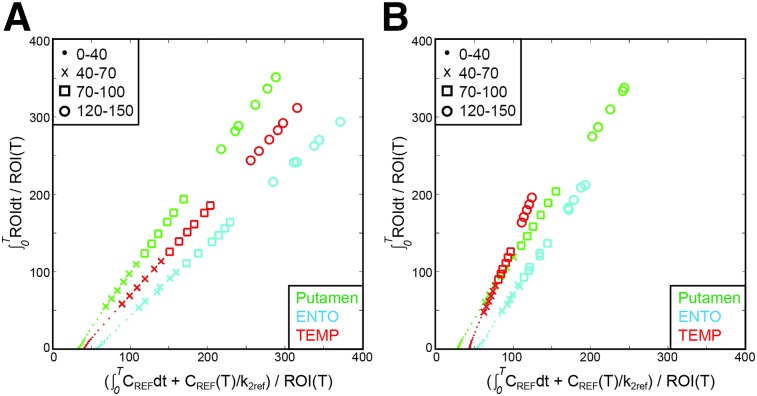
Methods: 18F-AV-1451 PET imaging was performed on 43 subjects (5 young HCs, 23 older HCs, and 15 AD subjects). Data were collected from 0 to 150 min after injection, with a break from 100 to 120 min. T1-weighted MR images were segmented using FreeSurfer to create 14 bilateral regions of interest (ROIs). In all analyses, cerebellar gray matter was used as the reference region. Nondisplaceable binding potentials (BPNDs) were calculated using the simplified reference tissue model (SRTM) and SRTM2; the Logan graphical analysis distribution volume ratio (DVR) was calculated for 30-150 min (DVR30-150). These measurements were compared with each other and used as reference standards for defining an appropriate 20-min window for the SUV ratio (SUVR). Pearson correlations were used to compare the reference standards to 20-min SUVRs (start times varied from 30 to 130 min), for all values, for ROIs with low 18F-AV-1451 binding (lROIs, mean of BPND + 1 and DVR30-150 < 1.5), and for ROIs with high 18F-AV-1451 binding (hROIs, mean of BPND + 1 and DVR30-150 > 1.5).
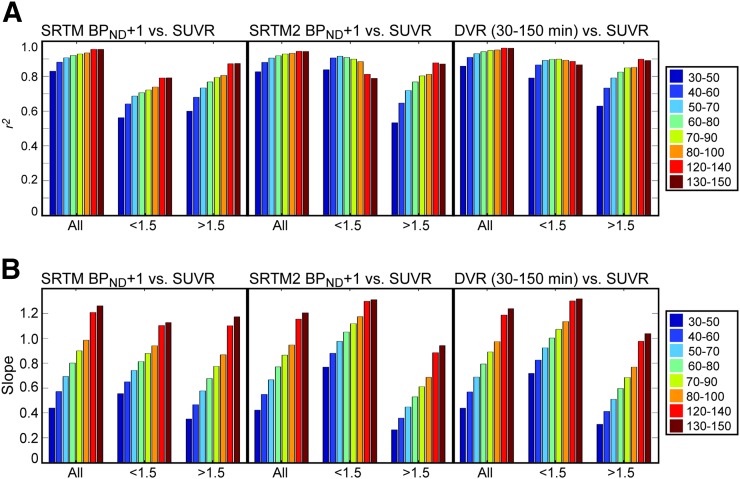
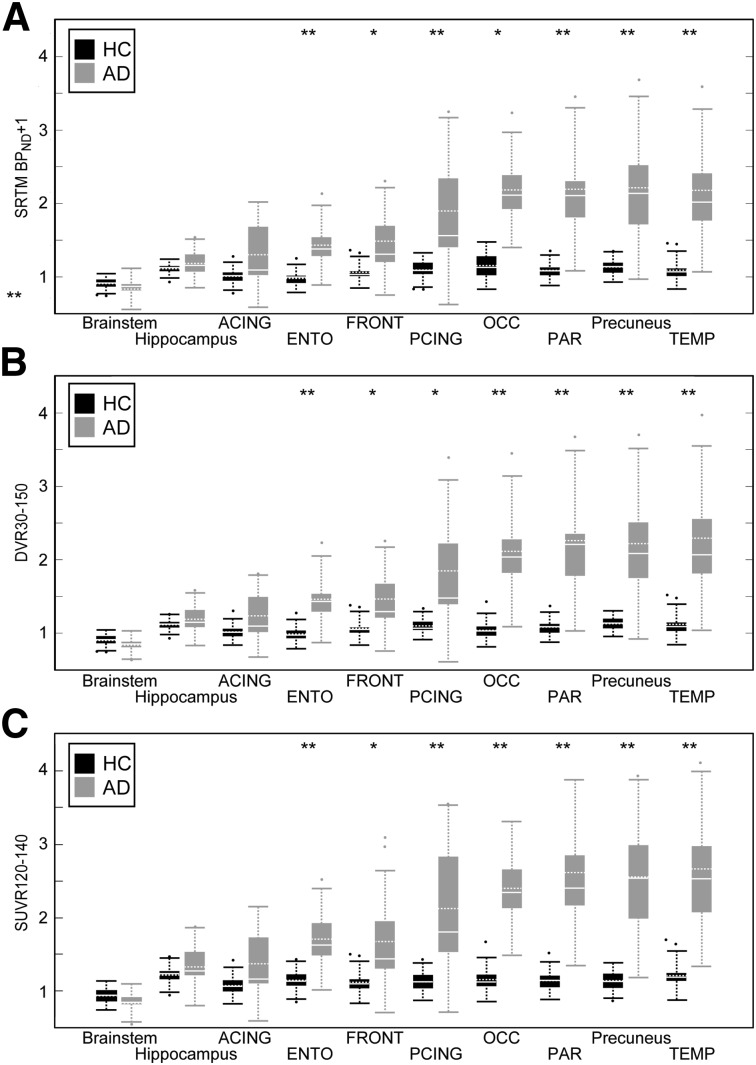
Results: SRTM2 BPND + 1 and DVR30-150 were in good agreement. Both were in agreement with SRTM BPND + 1 for lROIs but were greater than SRTM BPND + 1 for hROIs, resulting in a nonlinear relationship. hROI SUVRs increased from 80-100 to 120-140 min by 0.24 ± 0.15. The SUVR time interval resulting in the highest correlation and slope closest to 1 relative to the reference standards for all values was 120-140 min for hROIs, 60-80 min for lROIs, and 80-100 min for lROIs and hROIs. There was minimal difference between methods when statistical significance between ADs and HCs was calculated.
Conclusion: Despite later time periods providing better agreement between reference standards and SUVRs for hROIs, a good compromise for studying lROIs and hROIs is SUVR80-100. The lack of SUVR plateau for hROIs highlights the importance of precise acquisition time for longitudinal assessment.
Keywords: 18F-AV-1451; Alzheimer’s; kinetics; tau.
© 2017 by the Society of Nuclear Medicine and Molecular Imaging.
Figures
References
-
- Braak H, Braak E. Neuropathological stageing of Alzheimer-related changes. Acta Neuropathol (Berl). 1991;82:239–259. - PubMed
-
- Villemagne VL, Fodero-Tavoletti MT, Masters CL, Rowe CC. Tau imaging: early progress and future directions. Lancet Neurol. 2015;14:114–124. - PubMed
-
- Harada R, Okamura N, Furumoto S, et al. Comparison of the binding characteristics of [18F]THK-523 and other amyloid imaging tracers to Alzheimer’s disease pathology. Eur J Nucl Med Mol Imaging. 2013;40:125–132. - PubMed
MeSH terms
Substances
Grants and funding
LinkOut - more resources
Full Text Sources
Other Literature Sources
Medical