

A critical appraisal of transpulmonary and diastolic pressure gradients
- PMID: 27587711
- PMCID: PMC5027345
- DOI: 10.14814/phy2.12910
A critical appraisal of transpulmonary and diastolic pressure gradients
Abstract
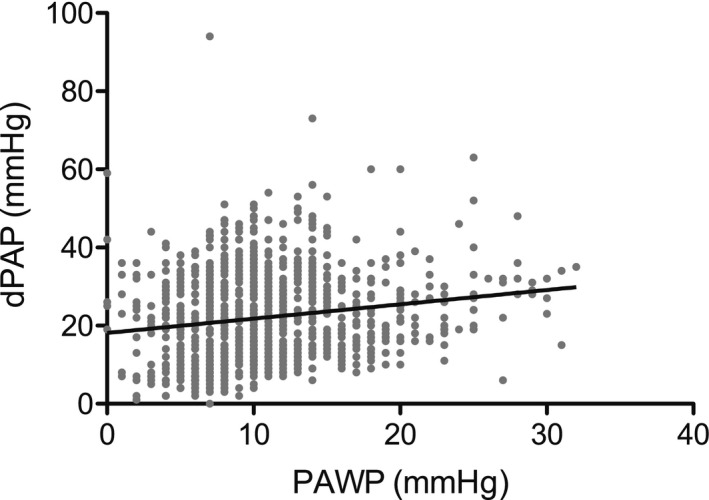
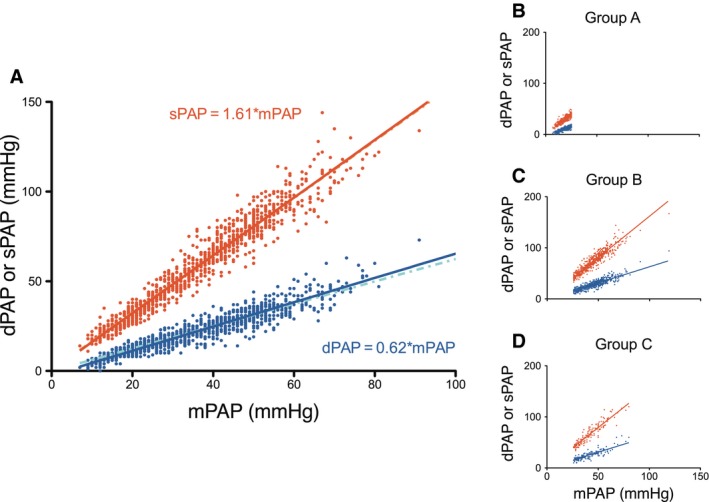
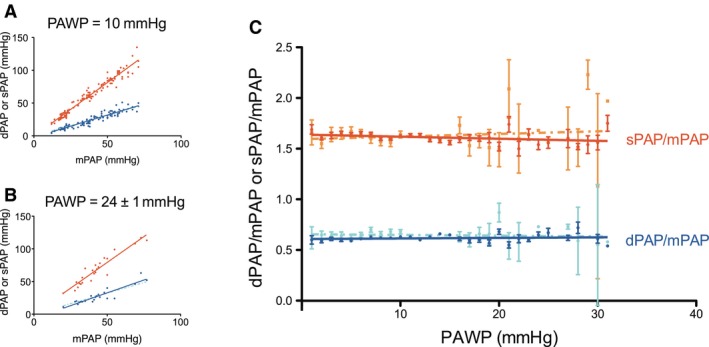
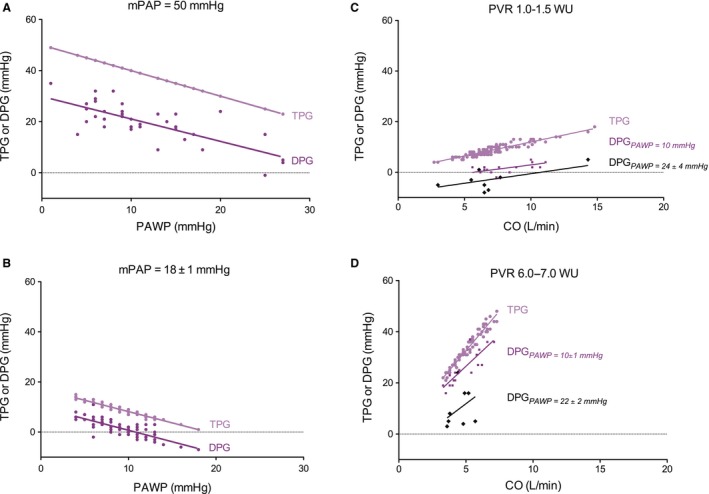
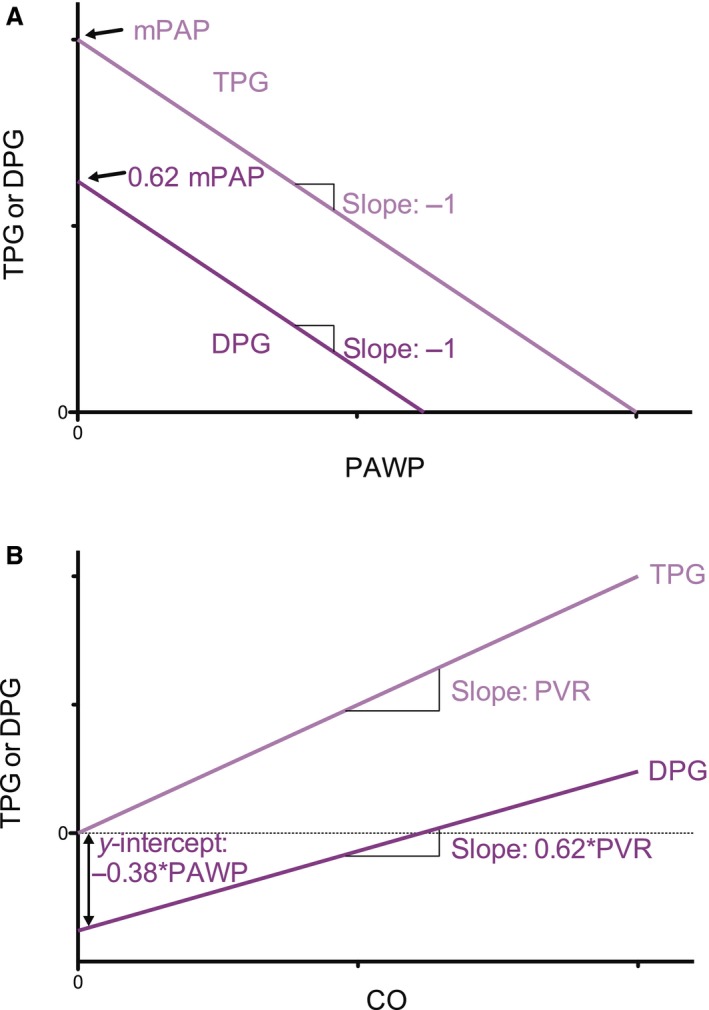
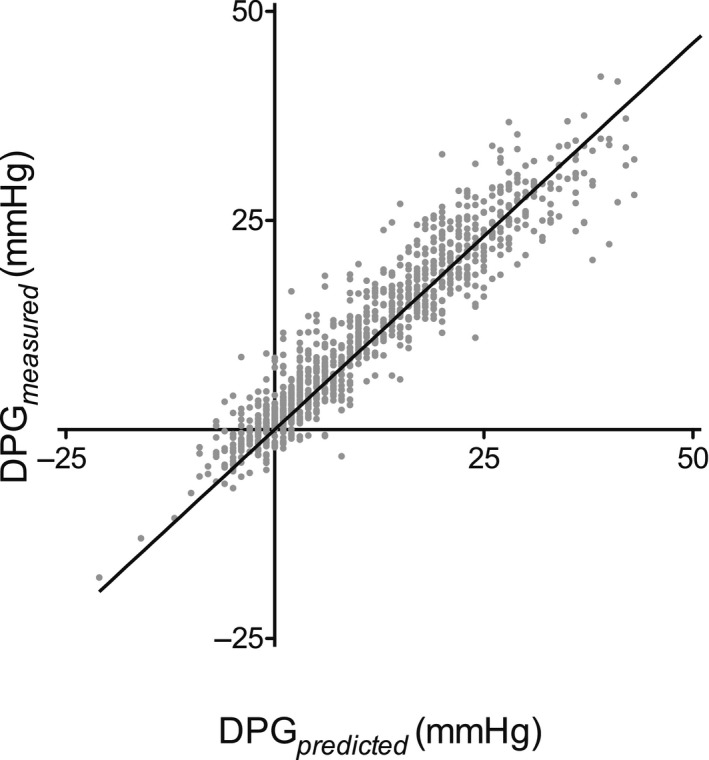
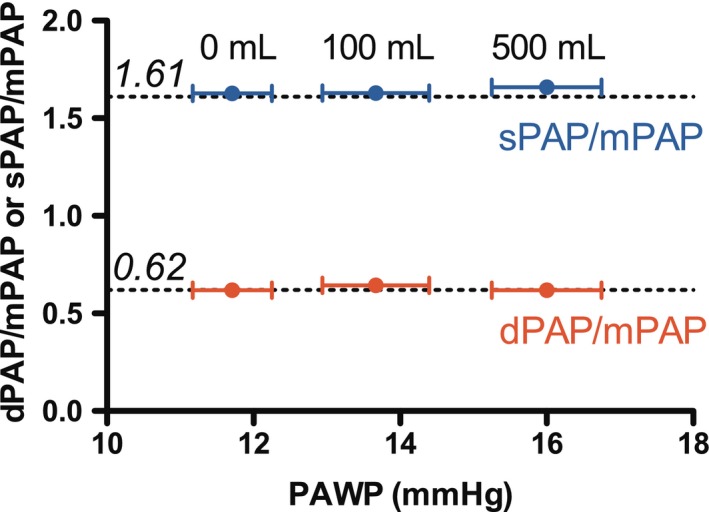
Pulmonary hypertension (PH) resulting from left heart failure is an increasingly recognized clinical entity. To distinguish isolated postcapillary PH from combined post- and precapillary PH, the use of a diastolic pressure gradient (DPG = diastolic Pulmonary Artery Pressure - Pulmonary Arterial Wedge Pressure, dPAP - PAWP) has been advocated over the transpulmonary pressure gradient (TPG = mean Pulmonary Artery Pressure - PAWP, mPAP - PAWP) since DPG was suggested to be independent of cardiac output (CO) and only slightly related to PAWP, while TPG depends on both. We quantitatively derived and compared the DPG and TPG Using right heart catheterization data (n = 1054), we determined systolic pulmonary artery pressure (sPAP), dPAP and mPAP, PAWP, and CO From this data, we derived TPG and DPG and tested their dependence on PAWP and CO We found that dPAP and sPAP are proportional with mPAP over a wide range of PAWP (1-31 mmHg), with dPAP = 0.62mPAP and sPAP = 1.61mPAP As a consequence, TPG and DPG are equally dependent on PAWP: TPG = mPAP - PAWP, and DPG = 0.62mPAP - PAWP Furthermore, we showed that both TPG and DPG depend on CO The absolute increase in DPG with CO is 62% of the TPG increase with CO, but the relative dependence is the same. Both TPG and DPG depend on PAWP and CO Thus, in principle, there are no major advantages for using DPG to distinguish postcapillary pulmonary hypertension from combined post- and precapillary pulmonary hypertension.
Keywords: Cardiac output; heart failure; physiology; pulmonary hypertension; pulmonary wedge pressure.
© 2016 The Authors. Physiological Reports published by Wiley Periodicals, Inc. on behalf of the American Physiological Society and The Physiological Society.
Figures
Similar articles
-
Diastolic Pulmonary Gradient as a Predictor of Right Ventricular Failure After Left Ventricular Assist Device Implantation.J Am Heart Assoc. 2019 Aug 20;8(16):e012073. doi: 10.1161/JAHA.119.012073. Epub 2019 Aug 14. J Am Heart Assoc. 2019. PMID: 31411097 Free PMC article.
-
Optimizing diastolic pressure gradient assessment.Clin Res Cardiol. 2020 Nov;109(11):1411-1422. doi: 10.1007/s00392-020-01641-w. Epub 2020 May 11. Clin Res Cardiol. 2020. PMID: 32394159 Free PMC article.
-
Prognostic value of the pre-transplant diastolic pulmonary artery pressure-to-pulmonary capillary wedge pressure gradient in cardiac transplant recipients with pulmonary hypertension.J Heart Lung Transplant. 2014 Mar;33(3):289-97. doi: 10.1016/j.healun.2013.11.008. Epub 2013 Nov 28. J Heart Lung Transplant. 2014. PMID: 24462554 Free PMC article.
-
Hemodynamic Phenotyping of Pulmonary Hypertension in Left Heart Failure.Circ Heart Fail. 2017 Sep;10(9):e004082. doi: 10.1161/CIRCHEARTFAILURE.117.004082. Circ Heart Fail. 2017. PMID: 28912263 Review.
-
The Diagnostic Challenge of Group 2 Pulmonary Hypertension.Prog Cardiovasc Dis. 2016 Jul-Aug;59(1):22-9. doi: 10.1016/j.pcad.2016.05.003. Epub 2016 May 16. Prog Cardiovasc Dis. 2016. PMID: 27195751 Review.
Cited by
-
Pulmonary Vascular Pressures and Gas Exchange Response to Exercise in Heart Failure With Preserved Ejection Fraction.J Card Fail. 2020 Nov;26(11):1011-1015. doi: 10.1016/j.cardfail.2020.07.009. Epub 2020 Aug 1. J Card Fail. 2020. PMID: 32750488 Free PMC article.
-
Pulsatile pulmonary artery pressure in a large animal model of chronic thromboembolic pulmonary hypertension: Similarities and differences with human data.Pulm Circ. 2022 Jan 12;12(1):e12017. doi: 10.1002/pul2.12017. eCollection 2022 Jan. Pulm Circ. 2022. PMID: 35506099 Free PMC article.
-
Postoperative care after left ventricular assist device implantation: considerations for the cardiac surgical intensivist.Indian J Thorac Cardiovasc Surg. 2023 Jul;39(Suppl 1):182-189. doi: 10.1007/s12055-022-01434-y. Epub 2022 Dec 16. Indian J Thorac Cardiovasc Surg. 2023. PMID: 37525704 Free PMC article. Review.
-
Congestion in heart failure: a contemporary look at physiology, diagnosis and treatment.Nat Rev Cardiol. 2020 Oct;17(10):641-655. doi: 10.1038/s41569-020-0379-7. Epub 2020 May 15. Nat Rev Cardiol. 2020. PMID: 32415147 Review.
-
Pathophysiology of the right ventricle and of the pulmonary circulation in pulmonary hypertension: an update.Eur Respir J. 2019 Jan 24;53(1):1801900. doi: 10.1183/13993003.01900-2018. Print 2019 Jan. Eur Respir J. 2019. PMID: 30545976 Free PMC article. Review.
References
-
- Borlaug, B. A. 2015. In search of new targets and endpoints in heart failure with preserved ejection fraction. J. Am. Coll. Cardiol. Heart Fail. 3:475–477. - PubMed
-
- Chatterjee, N. A. , and Lewis G. D.. 2015. Characterization of pulmonary hypertension in heart failure using the diastolic pressure gradient: limitations of a solitary measurement. J. Am. Coll. Cardiol. Heart Fail. 3:17–21. - PubMed
-
- Chemla, D. , Castelain V., Humbert M., Hébert J. L., Simonneau G., Lecarpentier Y., et al. 2004. New formula for predicting mean pulmonary artery pressure using systolic pulmonary artery pressure. Chest 126:1313–1317. - PubMed
-
- Chemla, D. , Humbert M., Sitbon O., Montani D., and Hervé P.. 2015. Systolic and mean pulmonary artery pressures: are they interchangeable in patients with pulmonary hypertension? Chest 147:943–950. - PubMed
Publication types
MeSH terms
LinkOut - more resources
Full Text Sources
Other Literature Sources
Medical
Research Materials
