

A Comparison of Substantia Nigra T1 Hyperintensity in Parkinson's Disease Dementia, Alzheimer's Disease and Age-Matched Controls: Volumetric Analysis of Neuromelanin Imaging
- PMID: 27587951
- PMCID: PMC5007389
- DOI: 10.3348/kjr.2016.17.5.633
A Comparison of Substantia Nigra T1 Hyperintensity in Parkinson's Disease Dementia, Alzheimer's Disease and Age-Matched Controls: Volumetric Analysis of Neuromelanin Imaging
Abstract
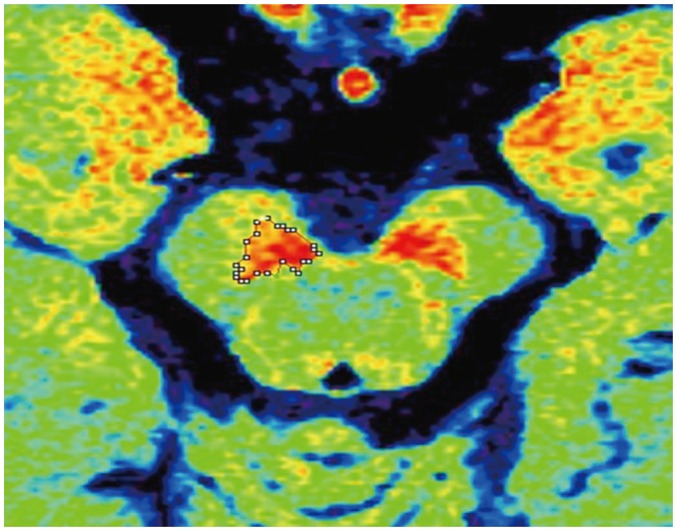
Objective: Neuromelanin loss of substantia nigra (SN) can be visualized as a T1 signal reduction on T1-weighted high-resolution imaging. We investigated whether volumetric analysis of T1 hyperintensity for SN could be used to differentiate between Parkinson's disease dementia (PDD), Alzheimer's disease (AD) and age-matched controls.
Materials and methods: This retrospective study enrolled 10 patients with PDD, 18 patients with AD, and 13 age-matched healthy elderly controls. MR imaging was performed at 3 tesla. To measure the T1 hyperintense area of SN, we obtained an axial thin section high-resolution T1-weighted fast spin echo sequence. The volumes of interest for the T1 hyperintense SN were drawn onto heavily T1-weighted FSE sequences through midbrain level, using the MIPAV software. The measurement differences were tested using the Kruskal-Wallis test followed by a post hoc comparison.
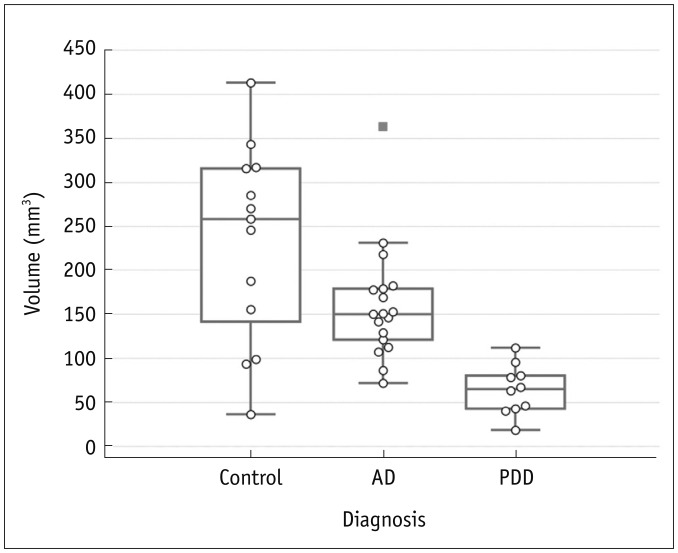
Results: A comparison of the three groups showed significant differences in terms of volume of T1 hyperintensity (p < 0.001, Bonferroni corrected). The volume of T1 hyperintensity was significantly lower in PDD than in AD and normal controls (p < 0.005, Bonferroni corrected). However, the volume of T1 hyperintensity was not different between AD and normal controls (p = 0.136, Bonferroni corrected).
Conclusion: The volumetric measurement of the T1 hyperintensity of SN can be an imaging marker for evaluating neuromelanin loss in neurodegenerative diseases and a differential in PDD and AD cases.
Keywords: Alzheimer disease; Dementia; High-resolution T1-weighted imaging; Magnetic resonance; Neuromelanin; Parkinsonian disorders; Substantia nigra.
Figures


Similar articles
-
Substantia nigra neuromelanin magnetic resonance imaging in de novo Parkinson's disease patients.Eur J Neurol. 2015 Mar;22(3):540-6. doi: 10.1111/ene.12613. Epub 2014 Dec 22. Eur J Neurol. 2015. PMID: 25534480
-
T1-weighted MRI shows stage-dependent substantia nigra signal loss in Parkinson's disease.Mov Disord. 2011 Aug 1;26(9):1633-8. doi: 10.1002/mds.23722. Epub 2011 Apr 12. Mov Disord. 2011. PMID: 21491489
-
Magnetic resonance correlation of iron content with neuromelanin in the substantia nigra of early-stage Parkinson's disease.Eur J Neurol. 2016 Feb;23(2):368-74. doi: 10.1111/ene.12838. Epub 2015 Oct 31. Eur J Neurol. 2016. PMID: 26518135
-
Loss of Nigral Hyperintensity on 3 Tesla MRI of Parkinsonism: Comparison With (123) I-FP-CIT SPECT.Mov Disord. 2016 May;31(5):684-92. doi: 10.1002/mds.26584. Epub 2016 Mar 17. Mov Disord. 2016. PMID: 26990970 Review.
-
Neuromelanin in parkinsonian disorders: an update.Int J Neurosci. 2017 Dec;127(12):1116-1123. doi: 10.1080/00207454.2017.1325883. Epub 2017 May 11. Int J Neurosci. 2017. PMID: 28460588 Review.
Cited by
-
Neuromelanin-sensitive MRI as a promising biomarker of catecholamine function.Brain. 2024 Feb 1;147(2):337-351. doi: 10.1093/brain/awad300. Brain. 2024. PMID: 37669320 Free PMC article. Review.
-
Structural MR Imaging in the Diagnosis of Alzheimer's Disease and Other Neurodegenerative Dementia: Current Imaging Approach and Future Perspectives.Korean J Radiol. 2016 Nov-Dec;17(6):827-845. doi: 10.3348/kjr.2016.17.6.827. Epub 2016 Oct 31. Korean J Radiol. 2016. PMID: 27833399 Free PMC article. Review.
-
Comparative morphometric evaluation of the brainstem in neurodegenerative diseases with healthy individuals using magnetic resonance imaging.J Taibah Univ Med Sci. 2021 Aug 11;17(1):87-95. doi: 10.1016/j.jtumed.2021.06.012. eCollection 2022 Feb. J Taibah Univ Med Sci. 2021. PMID: 35140570 Free PMC article.
-
Reliability and Reproducibility of Neuromelanin-Sensitive Imaging of the Substantia Nigra: A Comparison of Three Different Sequences.J Magn Reson Imaging. 2021 Mar;53(3):712-721. doi: 10.1002/jmri.27384. Epub 2020 Oct 9. J Magn Reson Imaging. 2021. PMID: 33037730 Free PMC article.
-
Parkinson's disease and atypical parkinsonism: the importance of magnetic resonance imaging as a potential biomarker.Radiol Bras. 2017 Jul-Aug;50(4):V-VI. doi: 10.1590/0100-3984.2017.50.4e1. Radiol Bras. 2017. PMID: 28894345 Free PMC article. No abstract available.
References
-
- Double KL, Ben-Shachar D, Youdim MB, Zecca L, Riederer P, Gerlach M. Influence of neuromelanin on oxidative pathways within the human substantia nigra. Neurotoxicol Teratol. 2002;24:621–628. - PubMed
-
- Zecca L, Zucca FA, Wilms H, Sulzer D. Neuromelanin of the substantia nigra: a neuronal black hole with protective and toxic characteristics. Trends Neurosci. 2003;26:578–580. - PubMed
-
- Sasaki M, Shibata E, Tohyama K, Takahashi J, Otsuka K, Tsuchiya K, et al. Neuromelanin magnetic resonance imaging of locus ceruleus and substantia nigra in Parkinson's disease. Neuroreport. 2006;17:1215–1218. - PubMed
-
- Sasaki M, Shibata E, Tohyama K, Kudo K, Endoh J, Otsuka K, et al. Monoamine neurons in the human brain stem: anatomy, magnetic resonance imaging findings, and clinical implications. Neuroreport. 2008;19:1649–1654. - PubMed
Publication types
MeSH terms
Substances
LinkOut - more resources
Full Text Sources
Other Literature Sources
Medical
