

Prospective Comparison of Liver Stiffness Measurements between Two Point Shear Wave Elastography Methods: Virtual Touch Quantification and Elastography Point Quantification
- PMID: 27587964
- PMCID: PMC5007402
- DOI: 10.3348/kjr.2016.17.5.750
Prospective Comparison of Liver Stiffness Measurements between Two Point Shear Wave Elastography Methods: Virtual Touch Quantification and Elastography Point Quantification
Abstract
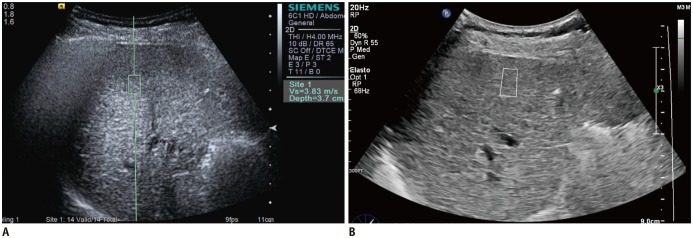
Objective: To prospectively compare technical success rate and reliable measurements of virtual touch quantification (VTQ) elastography and elastography point quantification (ElastPQ), and to correlate liver stiffness (LS) measurements obtained by the two elastography techniques.
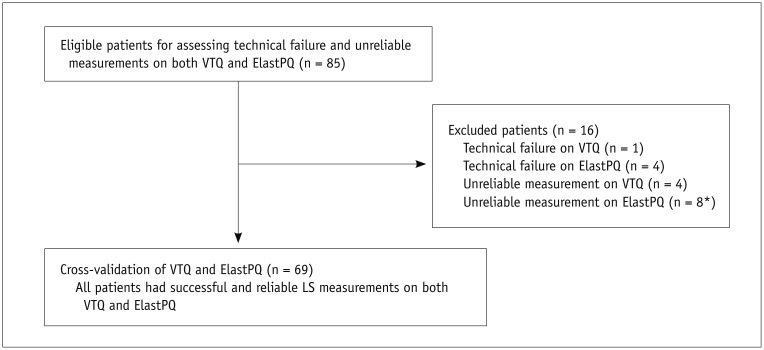
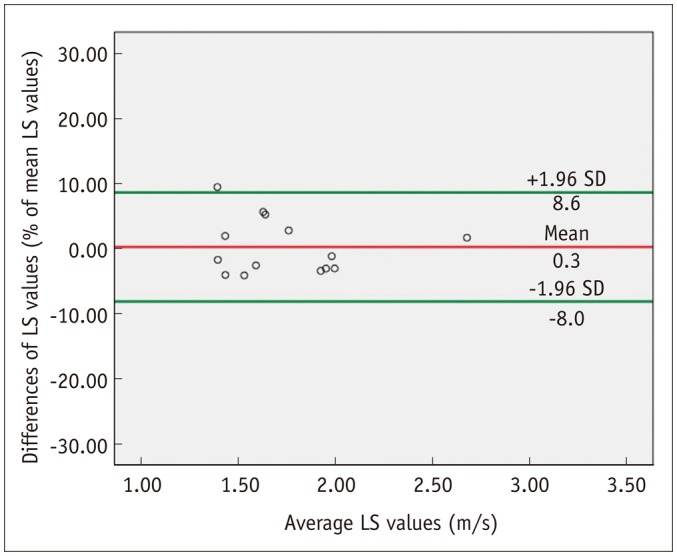
Materials and methods: Our study included 85 patients, 80 of whom were previously diagnosed with chronic liver disease. The technical success rate and reliable measurements of the two kinds of point shear wave elastography (pSWE) techniques were compared by χ(2) analysis. LS values measured using the two techniques were compared and correlated via Wilcoxon signed-rank test, Spearman correlation coefficient, and 95% Bland-Altman limit of agreement. The intraobserver reproducibility of ElastPQ was determined by 95% Bland-Altman limit of agreement and intraclass correlation coefficient (ICC).
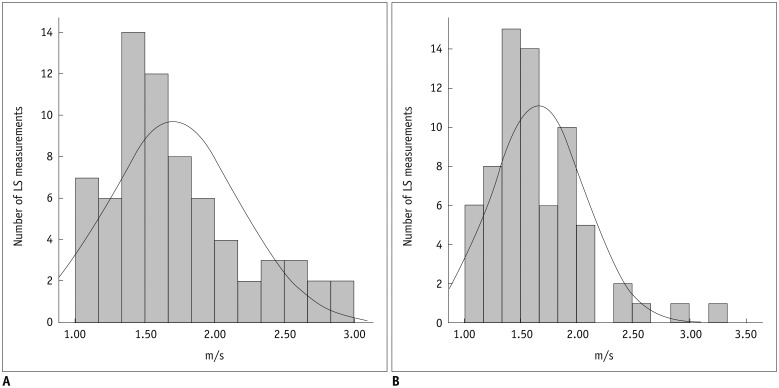
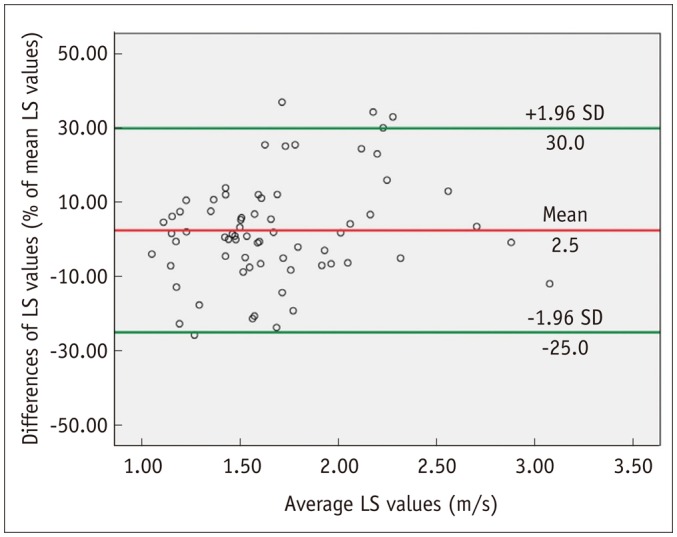
Results: The two pSWE techniques showed similar technical success rate (98.8% for VTQ vs. 95.3% for ElastPQ, p = 0.823) and reliable LS measurements (95.3% for VTQ vs. 90.6% for ElastPQ, p = 0.509). The mean LS measurements obtained by VTQ (1.71 ± 0.47 m/s) and ElastPQ (1.66 ± 0.41 m/s) were not significantly different (p = 0.209). The LS measurements obtained by the two techniques showed strong correlation (r = 0.820); in addition, the 95% limit of agreement of the two methods was 27.5% of the mean. Finally, the ICC of repeat ElastPQ measurements was 0.991.
Conclusion: Virtual touch quantification and ElastPQ showed similar technical success rate and reliable measurements, with strongly correlated LS measurements. However, the two methods are not interchangeable due to the large limit of agreement.
Keywords: Liver fibrosis; Liver stiffness; Shear wave elastography; Ultrasound elastography.
Figures
References
-
- Rockey DC. Hepatic fibrosis, stellate cells, and portal hypertension. Clin Liver Dis. 2006;10:459–479. - PubMed
-
- Castera L. Invasive and non-invasive methods for the assessment of fibrosis and disease progression in chronic liver disease. Best Pract Res Clin Gastroenterol. 2011;25:291–303. - PubMed
-
- Bravo AA, Sheth SG, Chopra S. Liver biopsy. N Engl J Med. 2001;344:495–500. - PubMed
-
- Piccinino F, Sagnelli E, Pasquale G, Giusti G. Complications following percutaneous liver biopsy. A multicentre retrospective study on 68,276 biopsies. J Hepatol. 1986;2:165–117. - PubMed
Publication types
MeSH terms
LinkOut - more resources
Full Text Sources
Other Literature Sources
Medical
