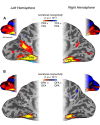
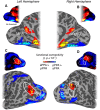
. 2016 Aug 18:10:412.
doi: 10.3389/fnhum.2016.00412. eCollection 2016.

Scene-Selectivity and Retinotopy in Medial Parietal Cortex

Affiliations

Scene-Selectivity and Retinotopy in Medial Parietal Cortex

Edward H Silson et al. Front Hum Neurosci. .

Abstract

Functional imaging studies in human reliably identify a trio of scene-selective regions, one on each of the lateral [occipital place area (OPA)], ventral [parahippocampal place area (PPA)], and medial [retrosplenial complex (RSC)] cortical surfaces. Recently, we demonstrated differential retinotopic biases for the contralateral lower and upper visual fields within OPA and PPA, respectively. Here, using functional magnetic resonance imaging, we combine detailed mapping of both population receptive fields (pRF) and category-selectivity, with independently acquired resting-state functional connectivity analyses, to examine scene and retinotopic processing within medial parietal cortex. We identified a medial scene-selective region, which was contained largely within the posterior and ventral bank of the parieto-occipital sulcus (POS). While this region is typically referred to as RSC, the spatial extent of our scene-selective region typically did not extend into retrosplenial cortex, and thus we adopt the term medial place area (MPA) to refer to this visually defined scene-selective region. Intriguingly MPA co-localized with a region identified solely on the basis of retinotopic sensitivity using pRF analyses. We found that MPA demonstrates a significant contralateral visual field bias, coupled with large pRF sizes. Unlike OPA and PPA, MPA did not show a consistent bias to a single visual quadrant. MPA also co-localized with a region identified by strong differential functional connectivity with PPA and the human face-selective fusiform face area (FFA), commensurate with its functional selectivity. Functional connectivity with OPA was much weaker than with PPA, and similar to that with face-selective occipital face area (OFA), suggesting a closer link with ventral than lateral cortex. Consistent with prior research, we also observed differential functional connectivity in medial parietal cortex for anterior over posterior PPA, as well as a region on the lateral surface, the caudal inferior parietal lobule (cIPL). However, the differential connectivity in medial parietal cortex was found principally anterior of MPA. We suggest that there is posterior-anterior gradient within medial parietal cortex, with posterior regions in the POS showing retinotopically based scene-selectivity and more anterior regions showing connectivity that may be more reflective of abstract, navigationally pertinent and possibly mnemonic representations.

Keywords: memory; population receptive fields; resting-state functional connectivity; retinotopy; scene-selectivity.


Figures
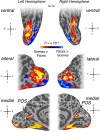
FIGURE 1
FIGURE 1
Scene- and face-selective regions of occipitotemporal and medial parietal cortex. Group averaged (n = 16) responses to scenes > faces (p < 0.0001) are overlaid in false colors on surface reconstructions of the left (left column) and right (right column) hemispheres of a sample participant. Regions responding significantly more to scenes are overlaid in hot colors with regions responding significantly more to faces overlaid in cold colors. (Top row) Ventral surface views demonstrate that parahippocampal place area (PPA) is readily identifiable in both hemispheres, located medially of face-selective responses (see orientation labels inset: A, anterior; P, posterior; M, medial; L, lateral). The location of PPA is consistent with a large number of previous studies. (Middle row) occipital place area (OPA) can be seen on lateral surface views of both hemispheres. OPA can be seen to cover a relatively large swath of cortex on the lateral surface and is located superior to face-selective responses. (Bottom row) medial place area [MPA; or retrosplenial complex (RSC)] can be seen within the posterior and ventral banks of the parieto-occipital sulcus (POS; white-dashed line defines the outer edges of POS) on medial surface views of both hemispheres. The posterior boundary of Brodmann area 30 (BA) is also shown on both hemispheres, redrawn from Brodmann (1909) and Vann et al. (2009).
FIGURE 2
FIGURE 2
Localization of MPA as a function of statistical threshold. (A) Medial view of the right hemisphere of a representative participant is shown with the POS and calcarine sulcus (CaS) labeled. The posterior boundary of BA30, redrawn from Brodmann (1909) and Vann et al. (2009) is also overlaid (white-line). The spatial extent of our group-based MPA regions of interest (ROI) with respect to the posterior-boundary of BA30 at different thresholds is demonstrated in (B–E). At lower thresholds, a small peak of activation does emerge on the cingulate gyrus, potentially corresponding to BA29/30, but it is dorsal to the isthmus and only extends into the callosal sulcus, where most of retrosplenial cortex is contained, at very low thresholds.
FIGURE 3
FIGURE 3
Retinotopic sensitivity in right MPA. (A) The average time-series during pRF mapping of all voxels within the right MPA of a single participant (top time-series), and the group-average (bottom time-series; ±standard error of the mean, SEM) are shown. These time-series show clearly eight peaks of activity. In both examples, each peak occurs once during each of eight sweeps of our mapping stimulus (18 TR’s per sweep; vertical dashed black lines denote the start/end of each sweep). (B) The portion of the visual field at which bar positions corresponding to each peak (corrected for the delay in hemodynamic response) of the group-averaged time-series overlap is also shown. These bars overlap largely within the left (contralateral) visual field. This plot represents the portion of the visual field that right MPA is most sensitive to.
FIGURE 4
FIGURE 4
Visual field coverage and visual field biases in left and right MPA. (A) Group-average visual field coverage for the left and right MPA are shown. Both ROIs exhibit a bias for the contralateral visual field, coupled with large receptive fields. The percentage of pRF centers (Mean ± SEM) within each quadrant of the visual field is given for each ROI and confirms the contralateral visual field bias in MPA bilaterally. (B) Bars depict the contralateral biases present in left and right MPA. In both ROIs, bars depict the mean value in the contralateral minus ipsilateral visual fields. Contralateral biases were found to be significant (relative to zero) in both ROIs (∗∗p < 0.01). (C) Bars depict the elevation bias present within left and right MPA. Bars depict the pRF value in the contralateral upper minus contralateral lower visual fields. Elevation biases were not significant in either ROI.
FIGURE 5
FIGURE 5
Event-related quadrant design and univariate analyses. (A) Schematic representation of our event-related quadrant experiment. Twenty-four scene images were presented randomly (400 ms) into one of the four quadrants of the visual field. Each image was centered 6.5° into each visual field quadrant. Participants performed an orthogonal task at fixation. During presentation of scene stimuli, one arm of the fixation cross (horizontal or vertical) became elongated. Participants indicated via button press which arm was elongated. (B) Group-average contralateral biases in left and right MPA. Bars reflect the beta values for stimuli presented in the contralateral minus ipsilateral visual field. Contralateral responses were significant (relative to zero) in both left and right MPA. (C) Group-average elevation biases in left and right MPA. Bars depict the beta values for stimuli presented in the contralateral upper minus contralateral lower visual field. Elevation biases were not significant (relative to zero) in either left or right MPA (p < 0.05).
FIGURE 6
FIGURE 6
Spatial correspondence between scene-selectivity and retinotopy in medial parietal cortex. (A) Retinotopic responses (left column) and scene-selectivity (right column) are shown on medial surface views of the left hemisphere for a single participant. A region showing strong retinotopic responses can be seen largely overlapping the MPA ROI (white-dashed line). The boundaries of V1 (solid black lines) and the boundaries between V2v and V3v and between V2d and V3d (dashed black lines) are also shown. (B) Group-average retinotopic responses and scene-selectivity are shown on the same surface reconstruction as in (A). Strong retinotopic responses can be seen to overlap with the group-defined MPA. (C) Retinotopic responses (left column) and scene-selectivity (right column) are shown on medial surface views of the right hemisphere for a single participant. A region showing strong retinotopic responses can be seen overlapping the MPA ROI almost entirely. (D) Group-average retinotopic responses and scene-selectivity are shown on the same surface reconstruction as in (A). Strong retinotopic responses can be seen to overlap with the group-defined MPA.
FIGURE 7
FIGURE 7
Differential patterns of resting-state functional connectivity between scene- and face-selective regions on both ventral and lateral surfaces. (A) Medial views of the left (left column) and right (right column) hemisphere of a representative participant are shown with the group-average differential connectivity maps for PPA vs. FFA (ventral surface contrast). Unthresholded versions in both hemispheres are inset above. The group-level MPA (white-dashed line) and PPA (black-dashed line) ROIs are identified. A region within the POS, exhibiting significantly greater PPA connectivity, can be seen to overlap with our MPA ROI in both hemispheres. (B) The same region is not visible when the contrast of OPA vs. OFA is performed and thresholded at the same significance level (p < 10-7). Again unthresholded versions are inset above for both hemispheres.
FIGURE 8
FIGURE 8
Differential connectivity patterns between posterior and anterior PPA. (A) Medial view of the left hemisphere of a representative participant is shown. Regions of cortex showing significant (p < 10-7) differential connectivity with anterior over posterior PPA (hot colors) or vice-versa (cold colors) at the group-level are overlaid. A region showing significant connectivity with anterior PPA can be seen directly adjacent and anterior to our scene- and retinotopically sensitive MPA ROI (white dashed-line), referred to as anterior MPA (aMPA). Although MPA does demonstrate stronger anterior PPA connectivity in the raw correlation (see unthresholded version inset above) this does not survive statistical analysis. (B) Medial view of the right hemisphere. A region showing significant anterior PPA connectivity can be seen largely anterior of our MPA ROI (unthresholded version inset above). (C) Lateral view of the left hemisphere of a representative participant. A region overlapping with the cIPL (white solid-line) showing significantly greater anterior PPA connectivity can be seen. Scene-selective OPA (white dashed-line) is more strongly correlated with posterior PPA. The unthresholded version is inset above. (D) Lateral view of the right hemisphere of a representative participant. A region overlaping with the cIPL (white solid-line) showing significantly greater anterior PPA connectivity can be seen. Scene-selective OPA (white dashed-line) is more strongly correlated with posterior PPA. The unthresholded version is inset above.
FIGURE 9
FIGURE 9
Differential connectivity patterns between MPA and connectivity ROI (CON). (A) Medial views of the left hemisphere (left) and right (right) hemisphere of a representative participant are shown. Scene-selective MPA can be seen within the posterior and ventral banks of the POS in both hemispheres (dashed-white line). Our CON can be seen more anteriorly within POS in both hemispheres (soild-black line). (B) Group-level differential connectivity patterns between MPA (cold colors) and CON (hot colors) are overlaid onto surface reconstructions of both hemispheres, with unthresholded versions inset above. Medial views are shown along the top-row, with lateral views shown along the bottom-row. (Top row) in both left (left column) and right (right column) medial views, significant (p < 10-7) aMPA connectivity can be seen extending into the precuneus and also within orbitofrontal regions, whereas significant MPA connectivity is seen largely posterior of MPA. Posterior PPA (dashed-white line) and anterior PPA (solid-white line) ROIs are also highlighted. (Bottom row) In both left (left column) and right (right column) lateral views, significant aMPA connectivity can be seen overlapping the cIPL (solid-white line), and within anterior temporal and superior frontal regions. Significant MPA connectivity is observed more posteriorly overlapping OPA.
FIGURE 10
FIGURE 10
Functional connectivity matrices for all scene-related ROIs. Group-average (n = 48) connectivity matrices between all scene-related ROIs (MPA, CON, pPPA, aPPA, OPA, and cIPL) are shown for the left and right hemispheres, respectively.
FIGURE 11
FIGURE 11
Posterior–anterior gradient across medial parietal cortex. (A) Bars depict the differential connectivity with pPPA and aPPA exhibited by both MPA and CON in both hemispheres (image inset above depicts the ROIs used for analysis). In both hemispheres there is significantly greater differential connectivity with CON than MPA but this difference is markedly stronger in the right hemisphere (t-tests between MPA and CON in each hemisphere separately). (B) Bars depict the differential connectivity with cIPL and OPA exhibited by both MPA and CON in both hemispheres (image inset above depicts the ROIs used for analysis). In both hemispheres there is significantly greater differential connectivity with CON than MPA but this difference is stronger in the right hemisphere (t-tests between cIPL and OPA in each hemisphere separately; p < 0.01, ∗∗∗p < 0.0001). Solid bars represent left hemisphere, open bars represent right hemisphere.
FIGURE 12
FIGURE 12
Scene-selectivity and retinotopy within MPA and the connectivity-defined CON. (A) The node-by-node correlation within MPA between scene-selectivity and explained variance of the pRF model (collapsed across hemispheres). These two functional properties are significantly positively correlated, suggesting that the same neural populations are capable of representing both scene-relevant visual features and retinal location. (B) Group-average scene-selectivity within the retinotopically defined MPA and CON, respectively. Although both regions exhibit evidence for scene-selectivity, this is significantly more pronounced within MPA. (C) Group-average contralateral biases (Contralateral minus Ipsilateral pRF value) within scene-selective MPA and CON, respectively. Again, despite both regions showing an overall contralateral bias, this bias is significantly more pronounced within MPA. p < 0.05, ∗∗p < 0.01.

Similar articles

Cited by

References

    1. Aminoff E., Gronau N., Bar M. (2007). The parahippocampal cortex mediates spatial and nonspatial associations. Cereb. Cortex 17 1493–1503. 10.1093/cercor/bhl078 - DOI - PubMed
    1. Arcaro M. J., McMains S. A., Singer B. D., Kastner S. (2009). Retinotopic organization of human ventral visual cortex. J. Neurosci. 29 10638–10652. 10.1523/JNEUROSCI.2807-09.2009 - DOI - PMC - PubMed
    1. Baldassano C., Beck D. M., Fei-Fei L. (2013). Differential connectivity within the parahippocampal place area. Neuroimage 75 228–237. 10.1016/j.neuroimage.2013.02.073 - DOI - PMC - PubMed
    1. Baldassano C., Esteva A., Beck D. M., Fei-Fei L. (2016). Two distinct scene processing networks connecting vision and memory. bioRxiv 15 571. - PMC - PubMed
    1. Brodmann K. (1909). Vergleichende Lokalisationslehre der Groshirnrinde. Leipzig: Barth.

LinkOut - more resources