

doi: 10.1016/j.joa.2016.05.002.
Epub 2016 Jul 11.
EHRA/HRS/APHRS/SOLAECE expert consensus on Atrial cardiomyopathies: Definition, characterisation, and clinical implication
Affiliations
- PMID: 27588148
- PMCID: PMC4996910
- DOI: 10.1016/j.joa.2016.05.002
Item in Clipboard
EHRA/HRS/APHRS/SOLAECE expert consensus on Atrial cardiomyopathies: Definition, characterisation, and clinical implication
J Arrhythm.
2016 Aug.
No abstract available
Figures
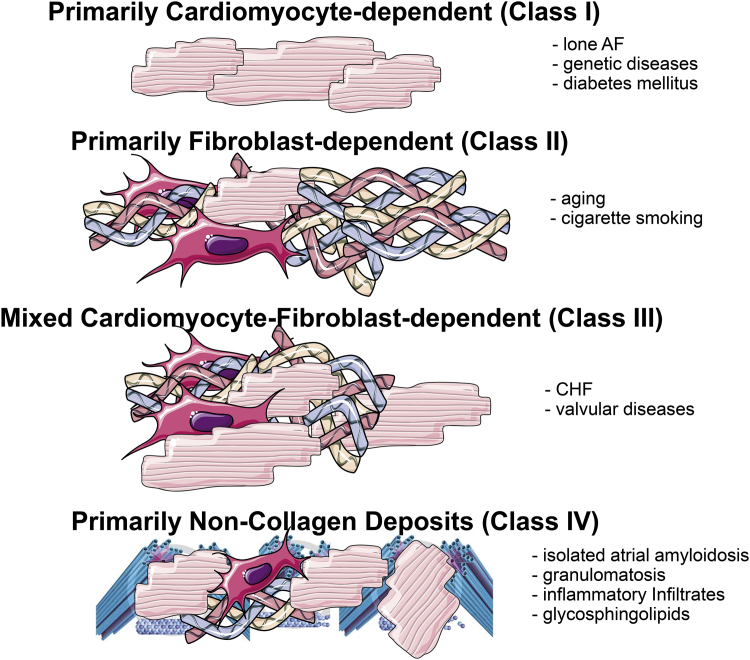
Histological and pathopysiological classification of atrial cardiomyopathies (EHRA/HRS/APHRS/SOLAECE): EHRAS classification. The EHRAS class may vary over time in the cause of the disease and may differ at various atrial sites. Of note, the nature of the classification is purely descriptive. EHRAS I–IV is not intended to describe disease progression from EHRAS I to EHRAS IV.
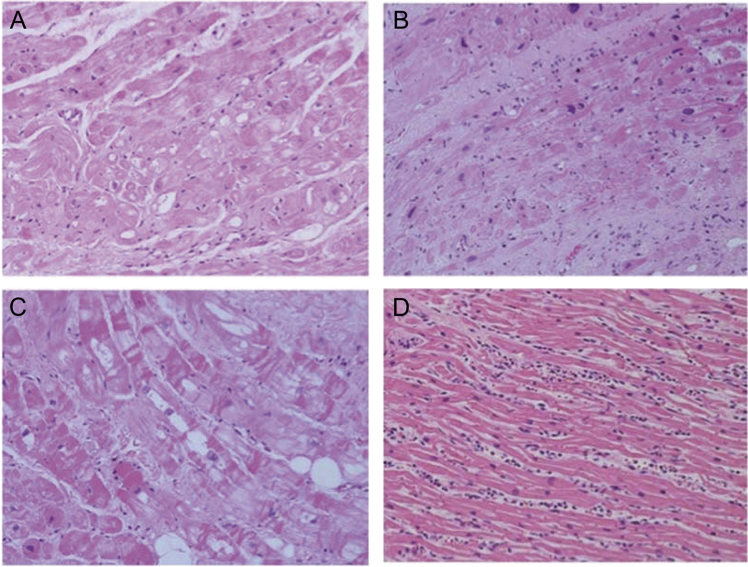
(A) EHRAS Class I (biopsy): there are severe changes affecting ‘primarily’ the cardiomyocytes in terms of cell hypertrophy and myocytolysis; fibrosis is much less evident than myocyte modifications. (B) EHRAS Class II (biopsy): cardiomyocyte alterations are relatively modest compared with severe fibrotic changes; in this case, interstitial changes are much more prevalent than myocyte ones. (C) EHRAS Class III (biopsy): this is a combination of cardiomyocyte changes and collagen fibre deposition. (D) EHRAS Class IV (autopsy heart): primarily neutro-philic myocarditis.
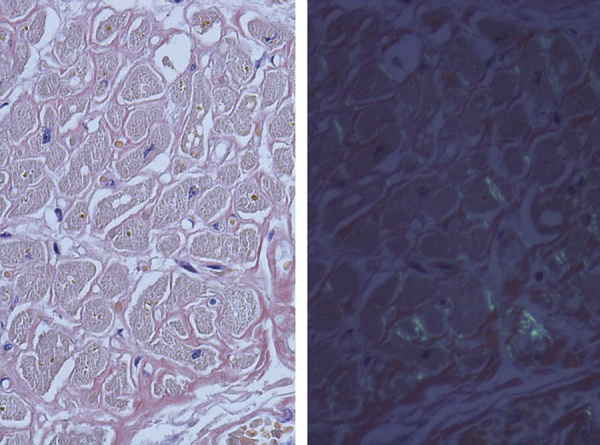
EHRAS Class IV (autopsy heart): this image shows a myocardial interstitial with some fibrosis but prominent amyloid (AL type) deposition (left-hand side, congo red staining under regular light microscope; right-hand side, congo red staining under polarised light microscope).
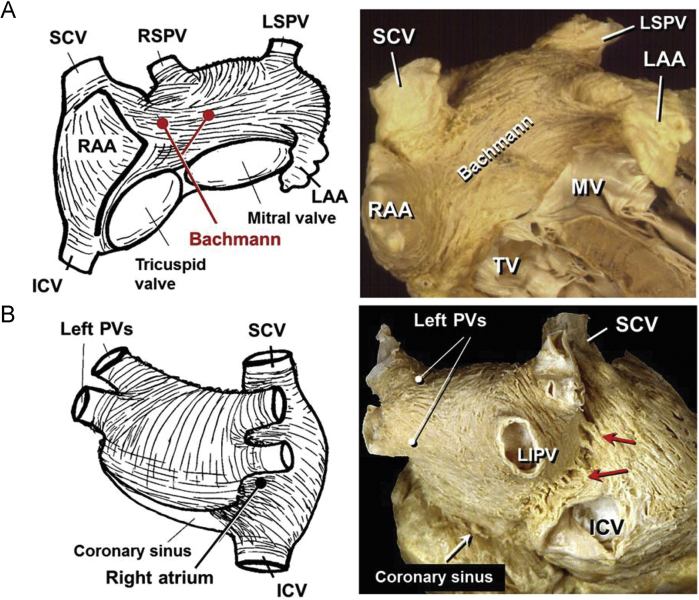
Schematic representations and heart dissections to show the arrangement of the myocardial strands in the superficial parts of the walls. (A) The dissection viewed from the anterior aspect display the interatrial muscle Bachmann bundle and its bifurcating branches leftward and rightward. (B) A view of the roof and posterior wall of the left and right atriums. The right pulmonary veins (PVs) passes behind the intercaval area. The subepicardial dissection shows the abrupt changes in fibre orientation and the myocardial strands (septopulmonary bundle) in the region between the left and right PVs. The red arrows show multiple muscle bridges connecting the two atria. ICV, inferior caval vein; LAA, left atrial appendage; LSPV, left superior pulmonary vein; MV, mitral valve; RAA, right atrial appendage; RIPV, right inferior pulmonary vein; RSPV, right superior pulmonary vein; SCV, superior caval vein; TV, tricuspid valve (see text for details).
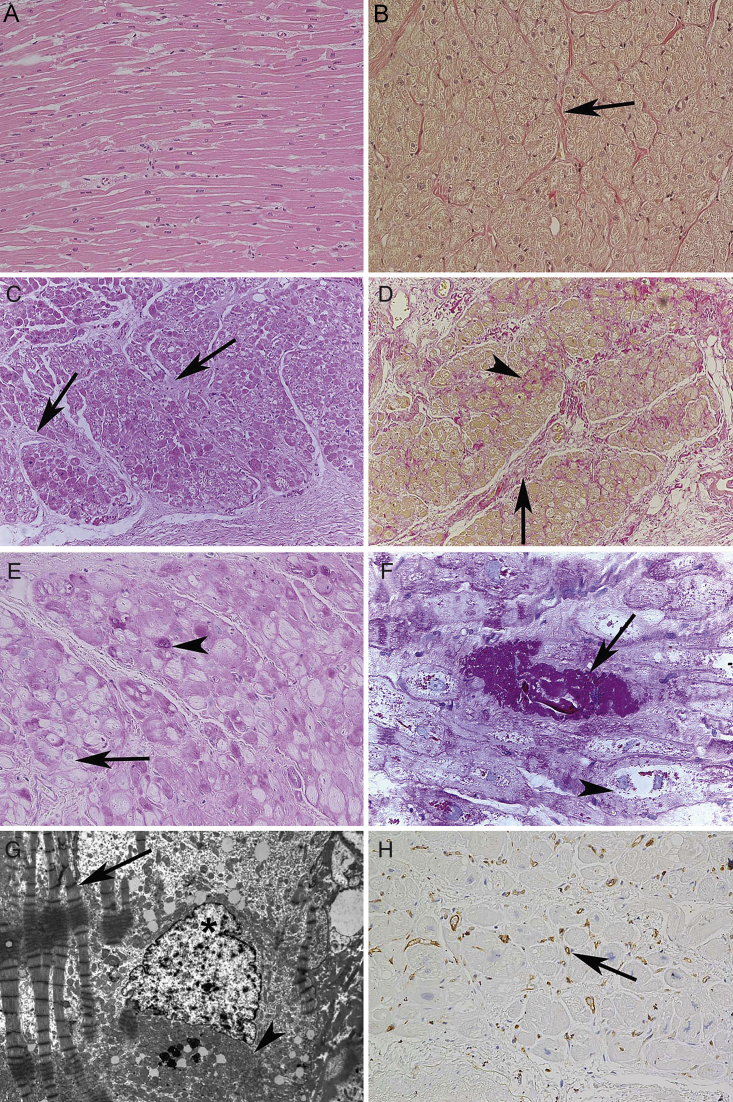
Normal histology of the left atrium and relevant pathological changes in mitral valve disease-associated atrial fibrillation. (A) Medium-power view of a normal left atrial myocardium which is composed of large bands of homogeneous cardiomyocytes. (B) In the same atrium as in (A), the Van Gieson staining show that collagen fibres (red colour) are primarily seen in the adventitial spaces of blood vessels (arrow). (C) Low-power view of a left atrium from a patient with mitral valve disease-associated atrial fibrillation. Large bands of cardiomyocytes are separated by significant amounts of pathologic fibrous tissue (arrows). (D) In the same atrium as in (C), the Van Gieson staining shows that the pathologic fibrous significantly thickens the perivascular spaces (perivascular fibrosis, arrow) and separates single or small groups of cardiomyocytes (interstitial fibrosis, arrowhead). (E) In atrial fibrillation, a variable number of cardiomyocytes undergo loss of contractile elements starting from the perinuclear area and resulting in so-called myocytolysis. These spaces may be empty (arrow) or filled with glycogen (arrowhead). (F) A higher-power view of myocytolysis with both glycogen rich (arrow) and optically empty (arrowhead) cardiomyocytes. (G) Ultrastructural view of a myolytic cardiomyocyte with significant loss of contractile elements around the nucleus (asterisk). In this empty area, there is very often accumulation of mitochondria (arrowhead) while the adjacent myofibrils display signs of abnormal contraction (arrow). (H) An LA from a patient with atrial fibrillation where the myocardial microcirculation (arrow) is slightly reduced and irregularly distributed. Stainings. (A and C) haematoxylin–eosin staining; (B and D) Van Gieson staining for collagen; (E and F) Periodic acid Schiff staining; (G) ultrastructural image; (H) immunohistochemical analysis with an anti-CD31 antibody. Original magnifications. (A, B, E, and H) ×20; (C and D) ×4; (F) ×40; (G) ×2800.
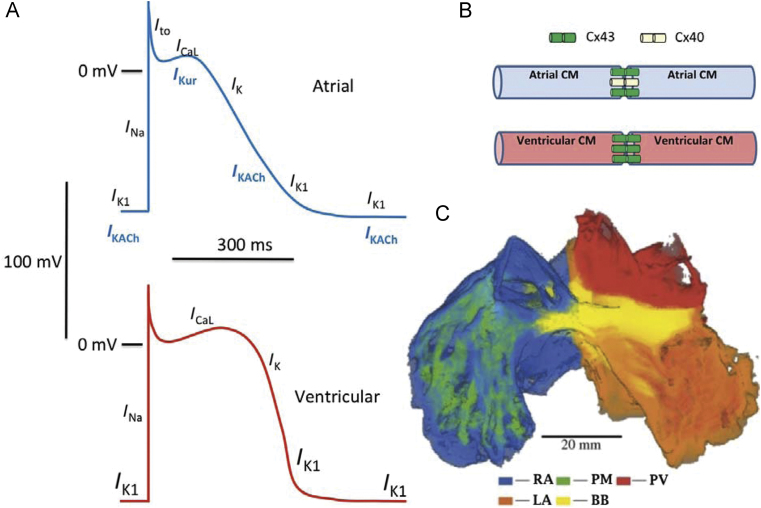
(A) Comparison of atrial and ventricular action potential properties and underlying ionic currents. Resting potentials (2 mV) are more negative (averaging 280–285 mV) in ventricular vs. atrial (270–275 mV) myocytes. (B) Connexin distribution differs between atria and ventricles, with connexin-43 only expressed in ventricular cardiomyocytes (CMs) but atrial CMs having both connexin-40 and connexin-43. (C) Ralistic reconstruction of the structure of sheep atria. The right atrium (RA), left atrium (LA), pectinate muscles (PM), Bachmann׳s bundle (BB) and pulmonary veins (PV) are colour coded. From Ref. with permission.
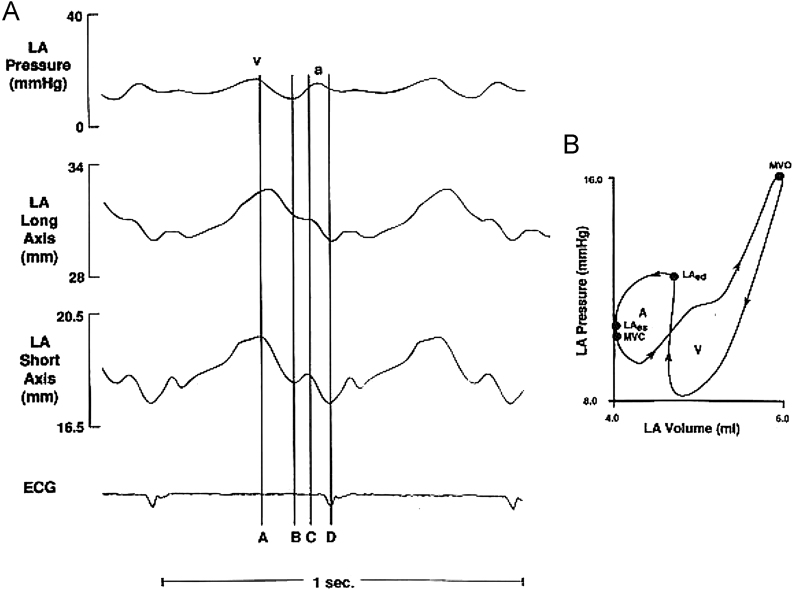
Left atrial pressure–volume loop. (A) Analogue recordings of left atrial pressure and dimensions in the time domain. Vertical lines indicate time of mitral valve opening (A), end of passive atrial emptying and onset of atrial diastasis (B), atrial end-diastole (C), and atrial end-systole (D). a and v represent respective venous pressure waves. (B) Left atrial pressure–volume loop from a single beat illustrating characteristic figure-of-eight configuration. Arrows indicate the direction of loop as a function of time. A loop represents active atrial contraction. V loop represents passive filling and emptying of the LA. MVO, time of mitral valve opening; MVC, approximate time of mitral valve closure; LA, left atrial end-systole; and LAd, left atrial end-diastole. Reproduced from Ref. with permission.
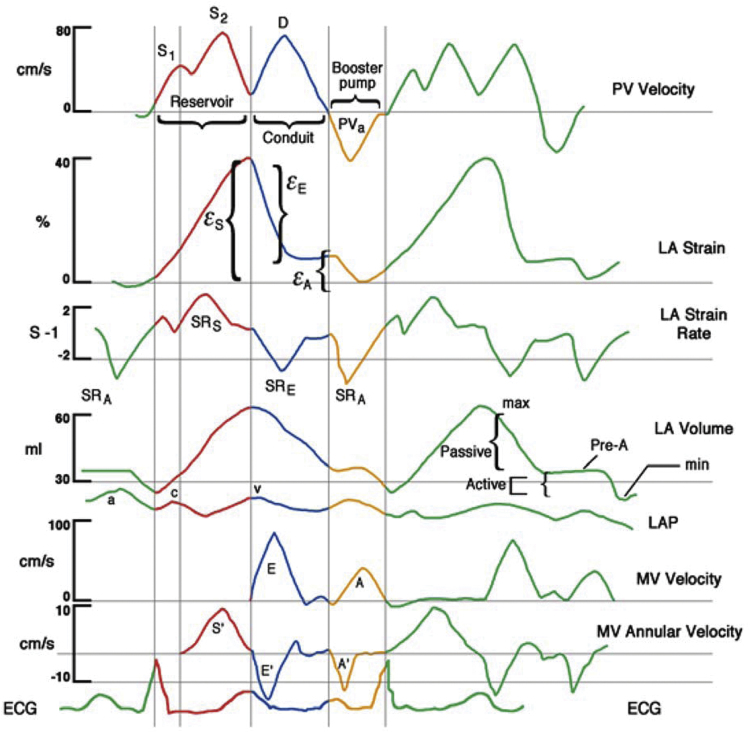
LA functions colour-coded displays of atrial functions (red, reservoir; blue, conduit; yellow, booster pump) related to events in the cardiac cycle. Displayed are pulmonary venous (PV) velocity, LA strain, LA strain rate, LA volume and pressure, and mitral spectral and tissue Doppler. Reproduced from Ref. with permission.
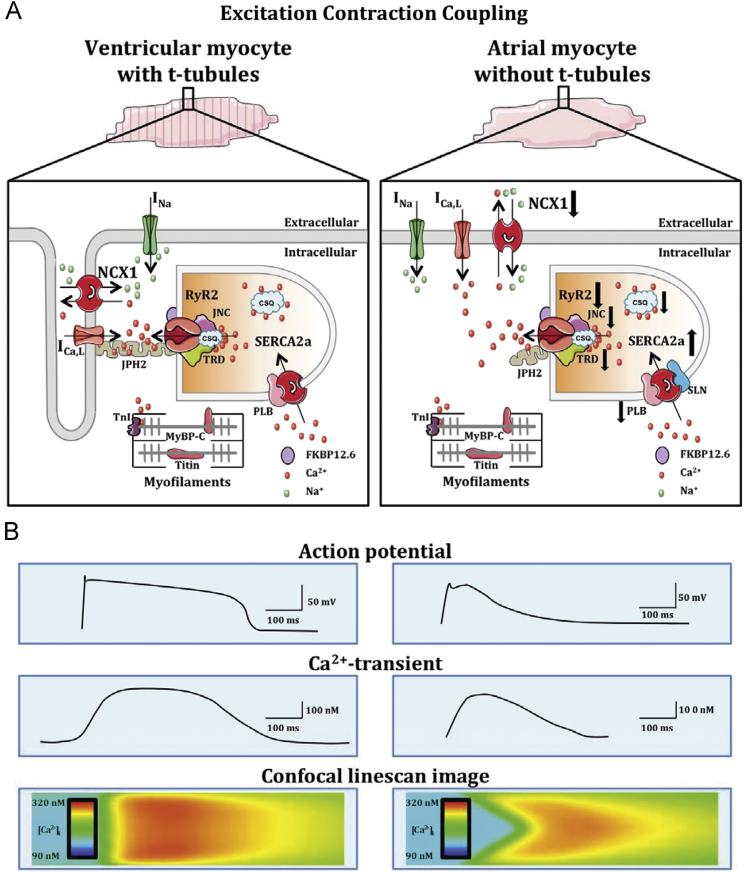
Excitation–contraction coupling in atria vs. ventricles. Schematic representation of the cell structure and major Ca2+ handling proteins, along with related currents and ion transporters (A). Illustration of action potential (top), Ca2+ transient (middle) and confocal linescan image of intracellular Ca2+ wave propagation towards cell centre (bottom) in a ventricular (left) vs. atrial (right) cardiomyocyte (B). Arrows indicate differences in expression and/or function of Ca2+ handling proteins in atrial vs. ventricular cardiomyocytes. INa, Na+ current; FKPB12.6, FK506-binding protein 12.6; JPH2, Junctophilin-2; MyBP-CMyosin bindig protein C; TnI, Troponin-I; for further abbreviations, see text.
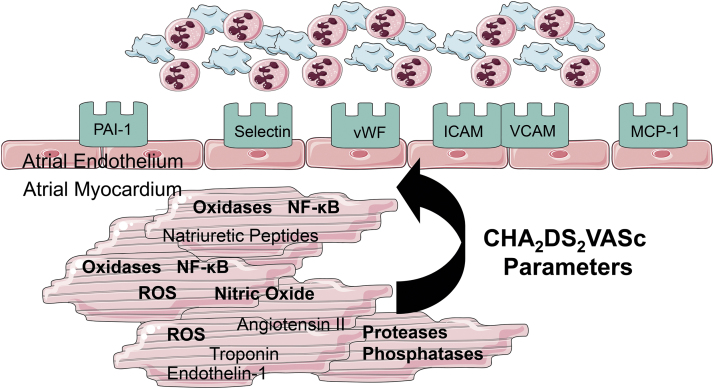
Concept of ‘endocardial remodelling’ in fibrillating atria. In accordance to Virchow׳s triad hypercoagulability, flow abnormalities, and endothelial changes must co-exist to induce thrombogenesis at the atrial endocardium. Molecular studies have revealed substantial endocardial changes in left atrial tissue samples. Prothrombogenic factors (vWF, adhesion molecules like VCAM-1, P-selectin etc; green) are expressed at the surface of endothelial cells causing an increased adhesiveness of platelets and leucocytes to the atrial endocardium. This initiates atrial thrombogenesis at the atrial endocardium. Several clinical factors like diabetes mellitus, heart failure ageing etc. (CHA2DS2VASc Parameters) increase molecular alterations (oxidative stress pathways etc.) within myocytes and endothelial cells, and thereby, increase the expression of prothrombogenic factors. These alterations are not directly related to the presence of absensce of atrial fibrillation in the surface ECG, and therefore, help to explain, why thrombogenesis is increased even during episodes of sinus rhythm.
References
-
- Hoit B.D. Left atrial size and function: role in prognosis. J Am Coll Cardiol. 2014;63:493–505. - PubMed
-
- Schotten U., Verheule S., Kirchhof P., Goette A. Pathophysiological mechanisms of atrial fibrillation: a translational appraisal. Physiol Rev. 2011;91:265–325. - PubMed
-
- Andrade J., Khairy P., Dobrev D., Nattel S. The clinical profile and pathophysiology of atrial fibrillation: relationships among clinical features, epidemiology, and mechanisms. Circ Res. 2014;114:1453–1468. - PubMed
-
- Burstein B., Libby E., Calderone A., Nattel S. Differential behaviors of atrial versus ventricular fibroblasts: a potential role for platelet-derived growth factor in atrial-ventricular remodeling differences. Circulation. 2008;117:1630–1641. - PubMed
Grants and funding
LinkOut - more resources
Full Text Sources
Other Literature Sources
