. 2016 Aug 23;3(4):ENEURO.0080-16.2016.
doi: 10.1523/ENEURO.0080-16.2016. eCollection 2016 Jul-Aug.

Presynaptic GABA Receptors Mediate Temporal Contrast Enhancement in Drosophila Olfactory Sensory Neurons and Modulate Odor-Driven Behavioral Kinetics

Affiliations

Presynaptic GABA Receptors Mediate Temporal Contrast Enhancement in Drosophila Olfactory Sensory Neurons and Modulate Odor-Driven Behavioral Kinetics

Davide Raccuglia et al. eNeuro. .

Abstract

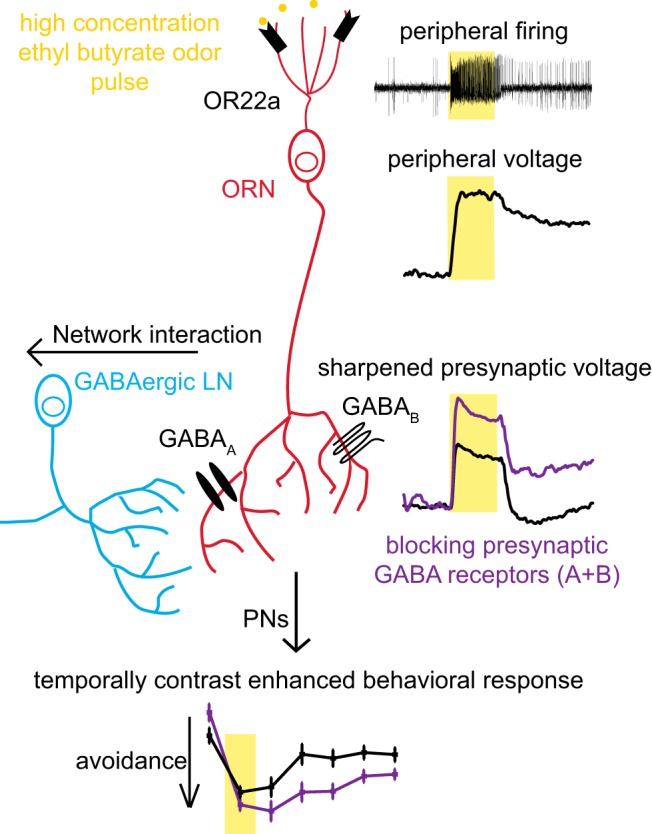
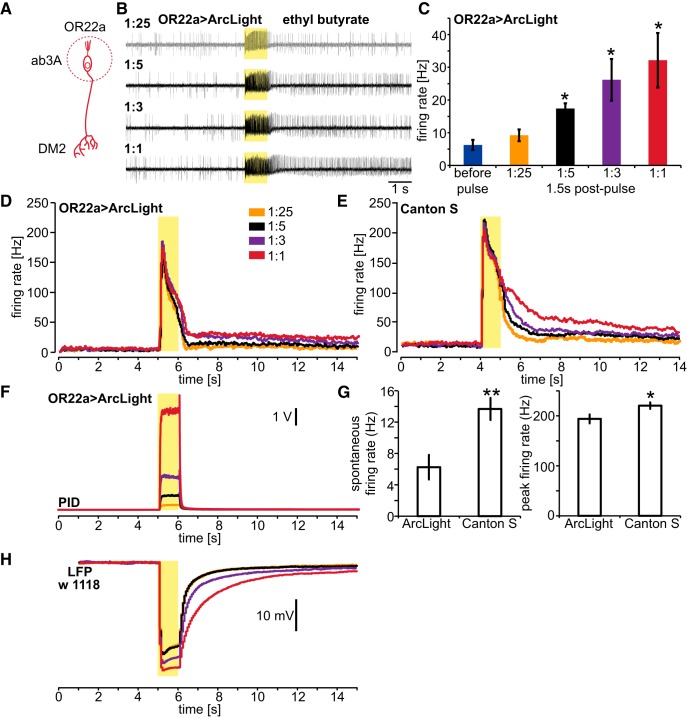
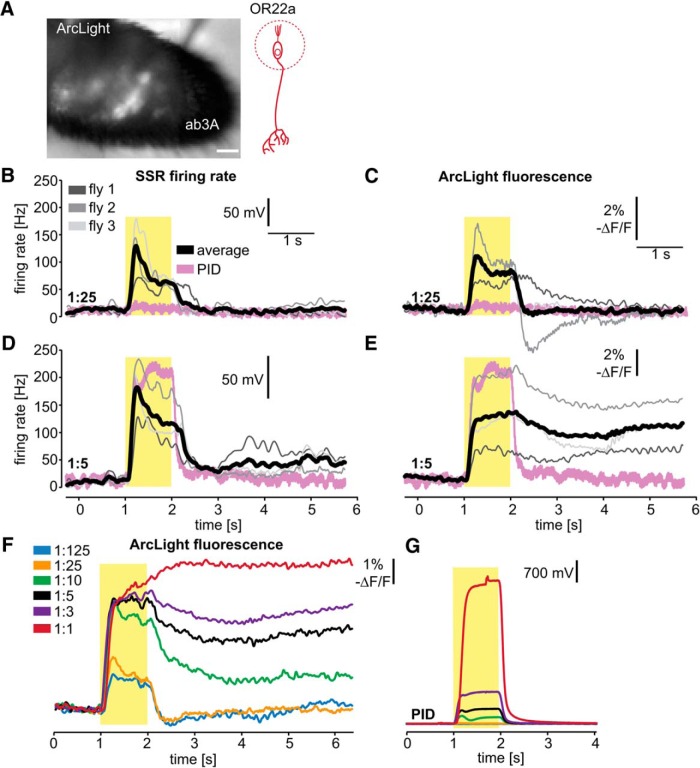
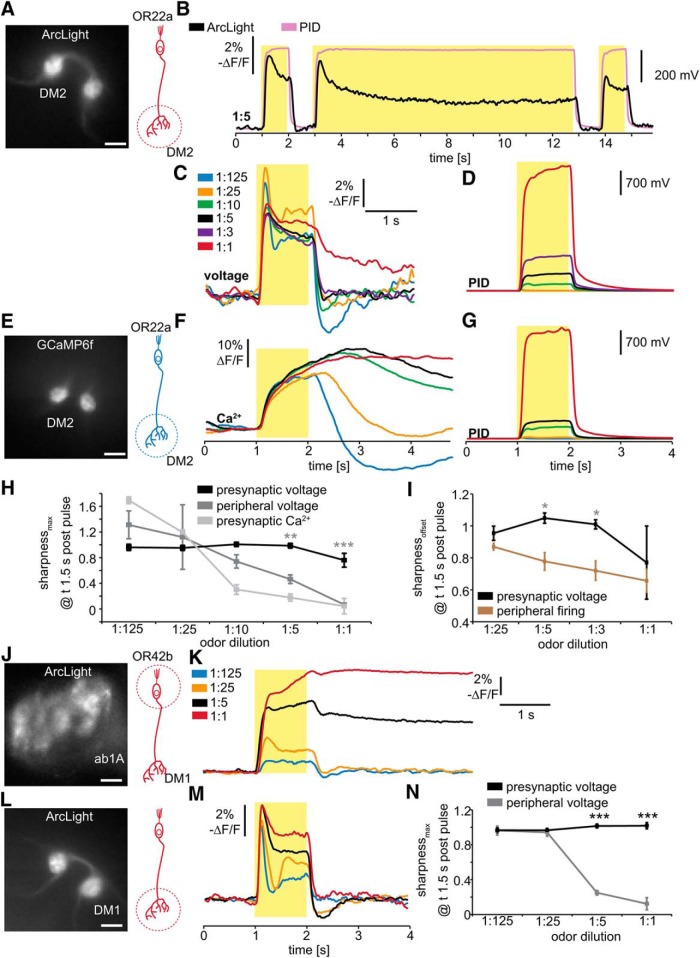
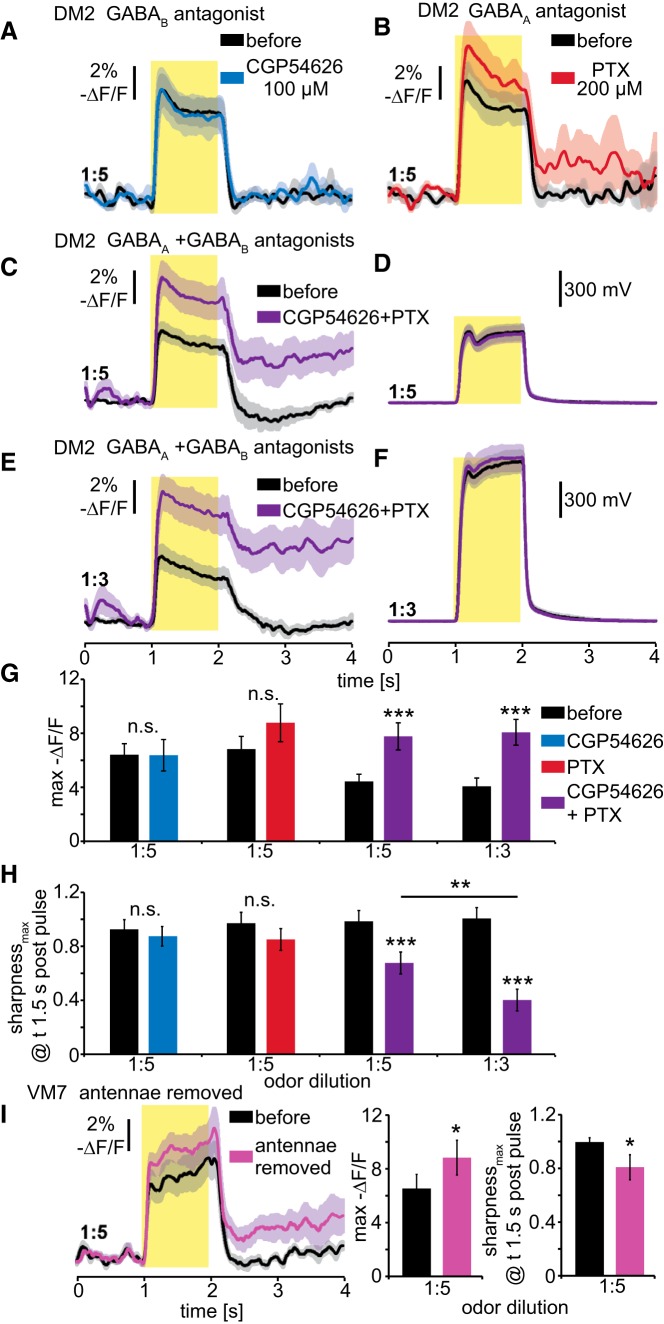
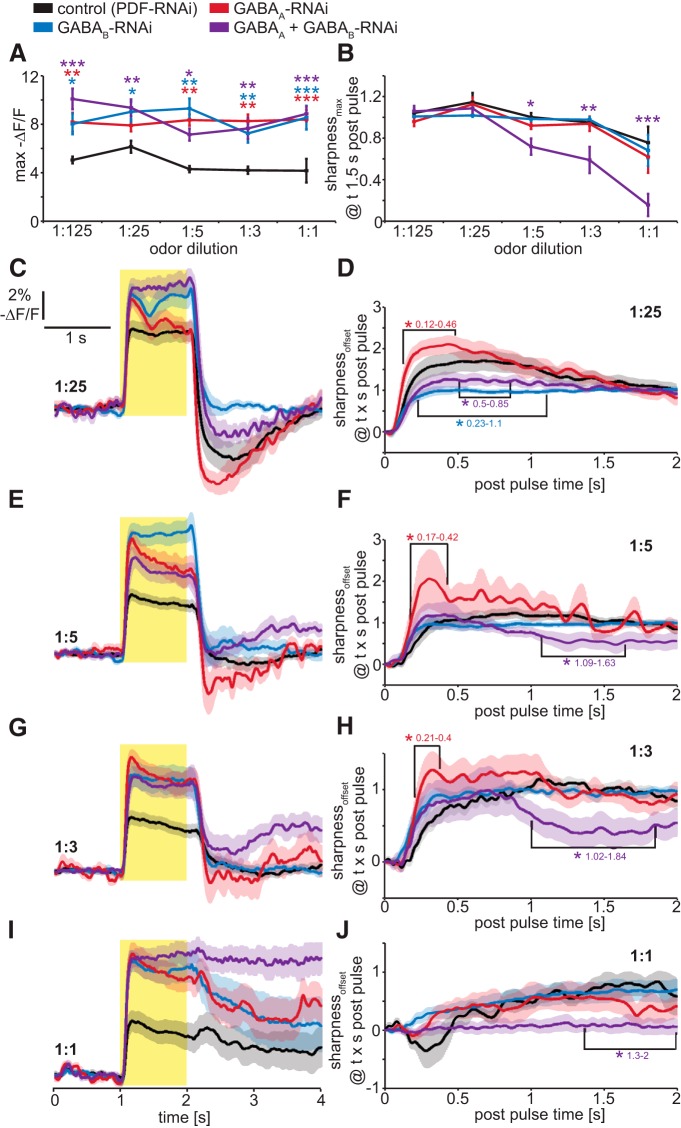
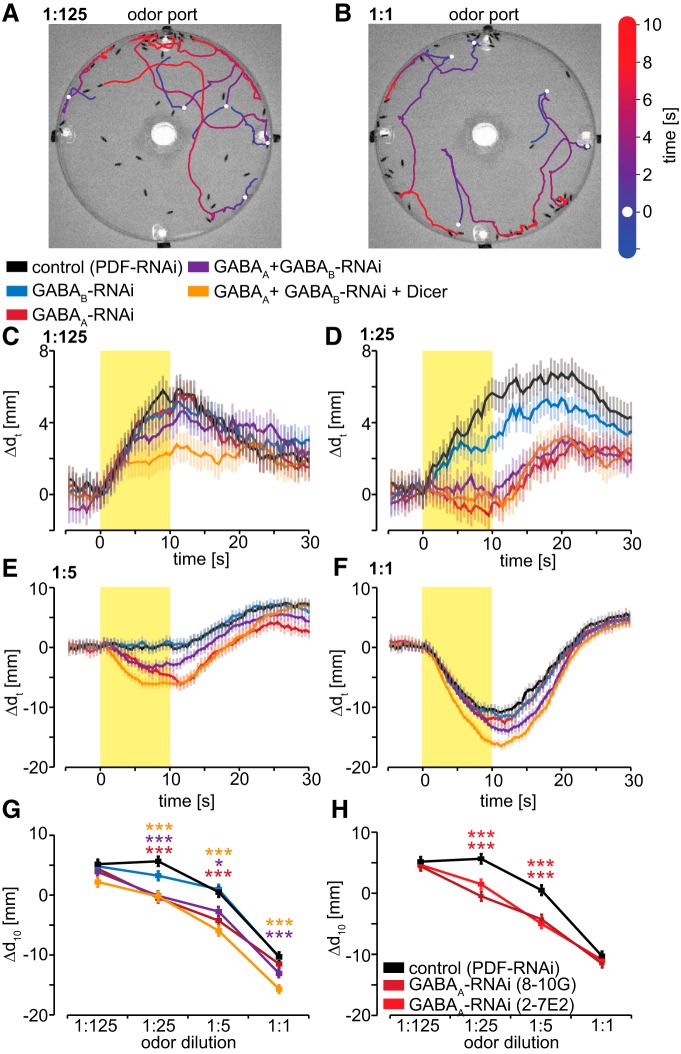
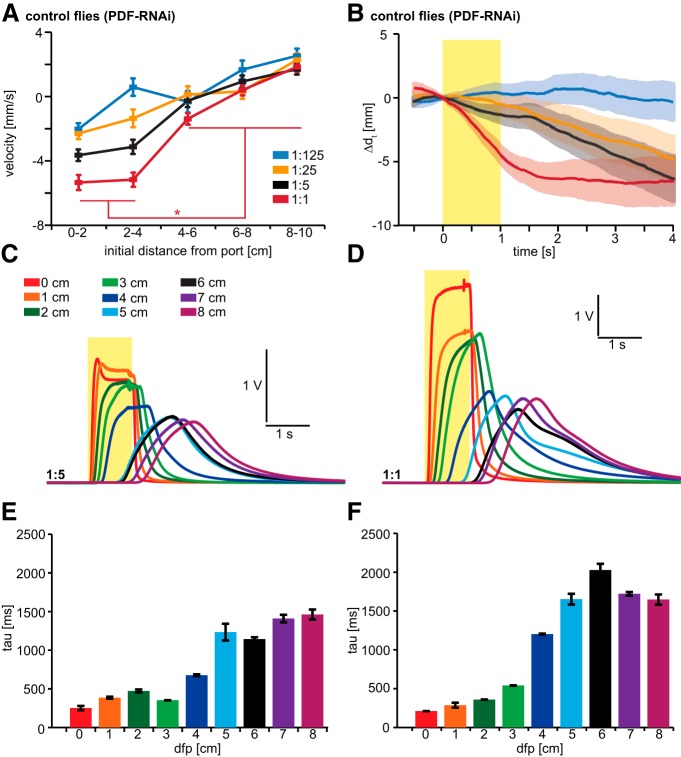
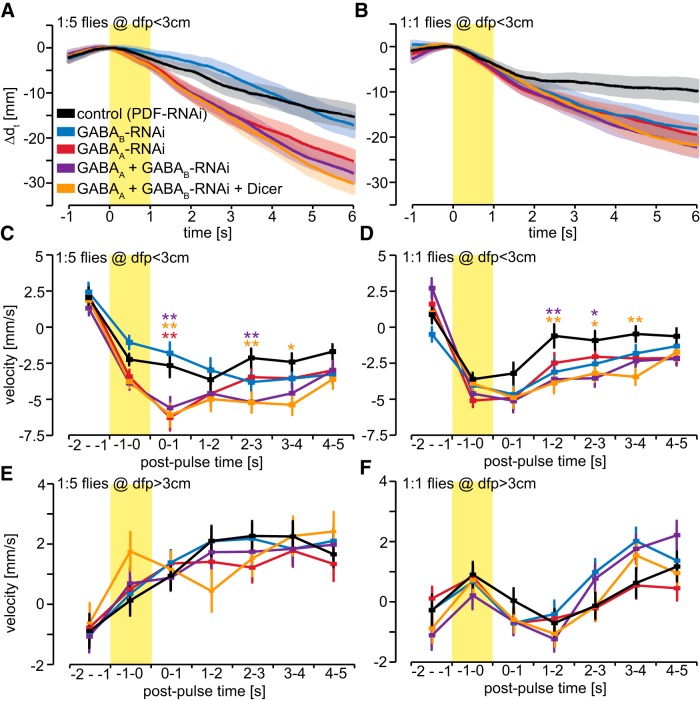
Contrast enhancement mediated by lateral inhibition within the nervous system enhances the detection of salient features of visual and auditory stimuli, such as spatial and temporal edges. However, it remains unclear how mechanisms for temporal contrast enhancement in the olfactory system can enhance the detection of odor plume edges during navigation. To address this question, we delivered to Drosophila melanogaster flies pulses of high odor intensity that induce sustained peripheral responses in olfactory sensory neurons (OSNs). We use optical electrophysiology to directly measure electrical responses in presynaptic terminals and demonstrate that sustained peripheral responses are temporally sharpened by the combined activity of two types of inhibitory GABA receptors to generate contrast-enhanced voltage responses in central OSN axon terminals. Furthermore, we show how these GABA receptors modulate the time course of innate behavioral responses after odor pulse termination, demonstrating an important role for temporal contrast enhancement in odor-guided navigation.


Figures

None
Graphical abstract
Figure 1.
Figure 1.
Increasing odor concentrations induces sustained peripheral OSN responses. A, An OSN depicting the dendrites and cell body in the antenna and the presynaptic axon terminals in the antennal lobe. The circle indicates focus on odor-elicited activity in the dendrites and cell body. B, Extracellular SSRs of action potentials in an ab3 sensillum, which contains OR22a-expressing OSNs. One second pulses of Eb of the indicated gas-phase dilutions were delivered during the indicated interval (yellow box). Recordings are representative of those obtained from four flies and 10 sensilla per concentration. C, Comparison between the spontaneous and postpulse firing rate at 1.5 s after odor pulse offset shows sustained firing for odor intensities of ≥1:5. Mean ± SEM; n = 4. Statistical analysis: one-way ANOVA for repeated measurements with Dunn’s post hoc test (spontaneous firing as control); *p < 0.05. D, Mean firing rates (n = 4 flies) of a neuron recorded in ab3 sensilla of ArcLight-expressing flies. E, Mean firing rates (n = 4 flies) of a neuron recorded in ab3 sensilla of Canton S flies. F, Representative odor signals measured at the outlet of the odor delivery system using a PID. G, OR22a-OSNs expressing ArcLight display reduced spontaneous and odor-induced peak firing rates compared with wild-type OR22a-OSNs (Canton S). Data from D and E were averaged across concentrations. Statistical analysis: unpaired t test, *p < 0.05; **p < 0.01. H, Mean LFP (n = 3) of ab3 sensilla in w1118 flies showing sustained neuronal activity.
Figure 2.
Figure 2.
Optical electrophysiology reveals sustained peripheral OSN responses. A, Combined fluorescent and transmitted light image of the antenna of a fly expressing ArcLight in OR22a-expressing OSNs. Scale bars, 20 µm. B–E, Simultaneous SSR of ab3 and voltage imaging of the antenna of three flies expressing ArcLight in OR22a-expressing OSNs. Representative PID signals are shown and were measured ∼2–4 mm behind the fly. Yellow boxes indicate odor pulse duration. F, Mean ArcLight signals (n = 4) in response to 1 s Eb pulses at the indicated gas-phase dilutions. G, Mean PID signals for the odor pulses in F, measured at the fly.
Figure 3.
Figure 3.
Optical electrophysiology of presynaptic axon terminals of OSNs indicates temporal contrast enhancement. A, Fluorescent image of the antennal lobe of a fly expressing ArcLight in OR22a-expressing OSNs. Scale bars, 10 µm. The axon terminals of these neurons innervate the DM2 glomerulus. B, Single-trial optical recording of presynaptic membrane potential in DM2 in response to pulses of 1:5 Eb, measured with the PID at the fly. Yellow boxes indicate odor pulse duration. C, Mean presynaptic electrical responses (n = 5–11) in DM2 to 1 s Eb pulses of the indicated gas-phase dilutions. D, Mean PID signals for the odor pulses in C, measured at the fly. E, Fluorescent image of the antennal lobe of a fly expressing GCaMP6F in OR22a-expressing OSNs. Scale bar, 10 µm. F, Mean presynaptic Ca2+ responses (n = 4–5) in DM2 to 1 s Eb pulses of the gas-phase dilutions indicated in C. G, Mean PID signals for the odor pulses in F, measured at the fly. H, Sharpness coefficient based on peak amplitude [(ΔF/F)Max − (ΔF/F)1.5 s postpulse]/(ΔF/F)Max of OSN voltage and Ca2+ responses in the antenna and AL. Sharpness of antennal voltage and presynaptic Ca2+ responses decreases with increasing odor concentration, while presynaptic voltage responses remain sharp, indicating the existence of a mechanism for temporal contrast enhancement of presynaptic electrical responses. Mean ± SEM; n = 4 for antennal voltage, n = 4-5 for presynaptic Ca2+, and n = 5-11 for presynaptic voltage. Statistical analysis: two-way ANOVA with Bonferroni post hoc test (antennal voltage as control); **p < 0.01; ***p < 0.001. I, Sharpness coefficient based on neuronal activity at odor offset [(ΔF/F or Hz)offset − (ΔF/F or Hz)1.5 s postpulse]/(ΔF/F or Hz)offset comparing presynaptic voltage and peripheral firing rate of OSNs also indicates presynaptic contrast enhancement. Statistical analysis: two-way ANOVA with Bonferroni post hoc test; *p < 0.05. J, Fluorescent image of the antenna of a fly expressing ArcLight in OR42b-expressing OSNs. Scale bars, 10 µm. K, Mean peripheral electrical responses (n = 4) in OR42b-expressing neurons to 1 s Eb pulses of the indicated gas-phase dilutions. L, Fluorescent image of the antennal lobe of a fly expressing ArcLight in OR42b-expressing OSNs. Scale bar, 10 µm. The axon terminals of these neurons innervate the DM1 glomerulus. M, Mean presynaptic electrical responses (n = 6) in DM1 to 1 s Eb pulses of the indicated gas-phase dilutions. N, Sharpness coefficient of peripheral voltage is reduced at high odor concentrations (1:5, 1:1), while presynaptic voltage responses remain sharp. Statistical analysis: two-way ANOVA with Bonferroni post hoc test, ***p < 0.001.
Figure 4.
Figure 4.
Temporal contrast enhancement in OSN presynaptic terminals is mediated by GABAA and GABAB receptors. A, Pharmacological inhibition of GABAB receptors with CGP54626 has no effect on presynaptic electrical responses of OR22a-expressing OSNs in DM2 to a 1 s pulse of 1:5 Eb. Mean ± SEM; n = 5. B, Pharmacological inhibition of GABAA receptors with PTX appears to slightly increase magnitude and prolong presynaptic electrical responses in DM2 to 1 s pulses of 1:5 Eb. Mean ± SEM; n = 5. C–F, Simultaneous pharmacological inhibition of GABAA and GABAB receptors increases magnitude and prolongs presynaptic electrical responses in DM2 to 1 s pulses of 1:5 (C) and 1:3 (E) Eb. Simultaneously recorded PID signals are identical before and after drug application (D, F). Mean ± SEM; n = 9. G, Maximum presynaptic voltage responses indicate that only simultaneous pharmacological inhibition of GABAA and GABAB receptors significantly increases the magnitude of voltage responses. Mean ± SEM; n = 5 for CGP54626, n = 5 for PTX, and n = 9 for CGP54626+PTX. Statistical analysis: two-way repeated-measures ANOVA with Bonferroni post hoc test, ***p < 0.001. H, Sharpness coefficient indicates that only simultaneous inhibition of GABAA and GABAB receptors significantly reduces the temporal contrast enhancement of presynaptic voltage responses. The sharpness of responses to 1:3 Eb is reduced significantly more than that to 1:5 Eb, which is consistent with the larger sustained peripheral response to 1:3 Eb (Fig. 2F). Mean ± SEM; n = 5 for CGP54626, n = 5 for PTX and n = 9 for CGP54626+PTX. Statistical analysis: two-way repeated-measures ANOVA with Bonferroni post hoc test, **p < 0.01; ***p < 0.001. I, Removal of the antennae reduces lateral inhibition of the maxillary palp glomerulus VM7 (Olsen and Wilson, 2008). In response to 1:5 Eb, removal of the antennae increases presynaptic voltage responses and reduces sharpness. Mean ± SEM; n = 7. Statistical analysis: paired t test, *p < 0.05.
Figure 5.
Figure 5.
Temporal contrast enhancement in OSN presynaptic terminals is mediated by presynaptic GABAA and GABAB receptors as demonstrated by cell-specific RNAi-mediated knockdown. A, Maximum presynaptic voltage responses are increased by individual and simultaneous RNAi-mediated knockdown of GABAA (8-10G) and GABAB receptors. Mean ± SEM; n = 8. Statistical analysis: two-way repeated-measures ANOVA with Bonferroni post hoc test (asterisks are color coded to indicate pairwise comparisons vs control), *p < 0.05; **p < 0.01; ***p < 0.001. B, Temporal contrast enhancement of DM2 presynaptic voltage responses is unaffected by RNAi-mediated knockdown of either GABAA (8-10G) or GABAB receptors individually in OR22a-expressing OSNs. Simultaneous knockdown of GABAA (8-10G) and GABAB receptors reduces temporal contrast enhancement at odor intensities of 1:5 and higher. Mean ± SEM; n = 8. Statistical analysis: two-way repeated-measures ANOVA with Bonferroni post hoc test, *p < 0.05; **p < 0.01; ***p < 0.001. C, E, G, I, Presynaptic DM2 voltage responses to 1 s Eb pulses of gas-phase dilutions 1:25 (C), 1:5 (E), 1:3 (G), and 1:1 (I) in flies expressing either, or both, GABAA (8-10G) and GABAB-RNAi in OR22a-expressing OSNs. Mean ± SEM; n = 8-10. D, F, H, J, Time-dependent sharpness coefficient to analyze the time window in which GABA receptor knockdown affects contrast enhancement. After a 1:25 pulse (D) knockdown of GABAB receptors and simultaneous knockdown of GABAA (8-10G) and GABAB receptors affect sharpness during the hyperpolarization phase immediately after odor offset. Knockdown of GABAA receptors leads an increase in postpulse hyperpolarization for 1:25 (D), 1:5 (F), and 1:3 (H). Contrast enhancement of sustained activity later than 1 s after the odor offset is only achieved by simultaneous knockdown of GABAA and GABAB receptors in OR22a-expressing OSNs, indicating a combined role for these receptors. Statistical analysis: two-way repeated-measures ANOVA with Bonferroni post hoc test, *p < 0.05.
Figure 6.
Figure 6.
Presynaptic OSN GABA receptors affect innate olfactory attraction and avoidance. A, B, Representative trajectories of control flies (PDF-RNAi) in the olfactory arena. The white dot indicates the position of the fly at the beginning of the 10 s odor pulse. The odor enters the arena from the top odor port. Trajectories indicate movement toward the odor port during a 10 s 1:125 Eb pulse (A), and away from the odor port during a 1:1 Eb pulse (B). C, D, Behavioral responses to 10 s 1:125 (C) and 1:25 (D) Eb pulses. We defined Δdt as the difference in distance from the odor port between odor onset and time tdt = d0dt), such that positive Δdt values reflect movement toward the odor port (i.e, attraction) and negative values reflect movement away (i.e., avoidance). Control flies (PDF-RNAi) are attracted to the odor port during Eb pulses of these intensities, and this attraction is inhibited by RNAi-mediated knockdown in OR22a-expressing OSNs of GABAA receptors individually or GABAA and GABAB receptors simultaneously. Mean ± SEM; E, F, Control flies (PDF-RNAi) avoid the odor port during 10 s at 1:5 (C) and at 1:1 (D) Eb pulses, and this avoidance is increased by RNAi-mediated knockdown in OR22a-expressing OSNs of GABAA receptors individually or GABAA and GABAB receptors simultaneously. Mean ± SEM; G, Net distance moved at the end of 10 s Eb pulses of the indicated gas-phase dilutions. For Eb dilutions of 1:25 or 1:5, knockdown in OR22a-expressing OSNs of GABAA receptors individually or simultaneous knockdown of GABAA and GABAB receptors, increases avoidance of the odor port. For Eb dilution of 1:1, only simultaneous knockdown of GABAA and GABAB receptors increases avoidance. Mean ± SEM, n = 650–800 total flies per genotype and concentration assayed in at least 10 independent experiments. Statistical analysis: two-way ANOVA followed with Bonferroni post hoc test (asterisks are color coded to indicate pairwise comparisons vs control), *p < 0.05; ***p < 0.001. H, Expression of either of two different GABAA-RNAi transgenes in OR22a-expressing OSNs increases avoidance. Mean ± SEM. Statistical analysis: two-way ANOVA with Bonferroni post hoc test, ***p < 0.001.
Figure 7.
Figure 7.
Behavioral responses to quick 1 s Eb pulses are dependent on temporal odor dynamics in the behavioral chamber. A, Velocity of flies during and after 1 s Eb pulses is dependent on initial position within the olfactory arena at initiation of the odor pulse. Control flies expressing PDF-RNAi in OR22a-expressing neurons exhibit strong avoidance only to 1:1 Eb and only when initial position in the arena is ≤4 cm from the odor port. Mean ± SEM; n = 116–172 total flies per genotype and concentration assayed in at least 10 independent experiments. Statistical analysis: two-way ANOVA with Bonferroni post hoc test, *p < 0.05. B, Behavioral responses of control flies (initial position to port <5 cm) to 1 s Eb pulses of gas-phase dilutions, as indicated in A. Mean ± SEM. C, D, Mean PID recordings (n = 5) in the behavioral chamber showing odor dynamics of 1 s odor pulses of 1:5 (C) and 1:1 (D) that vary dependent on the distance to the odor port. E, F, Tau represents the time that the odor stimulus takes to reach 36.8% of its peak value. For 1:5 (E) and 1:1 (F), tau drastically increases after a distance of 3–4 cm from the odor port, indicating that flies within 3 cm from the odor port experience a fast increase and decrease in odor intensity, while flies that are >3 cm away from the odor port experience more gradual changes in odor intensity. Mean ± SEM. n = 5.
Figure 8.
Figure 8.
Presynaptic OSN GABA receptors accelerate behavioral responses to odor pulse termination. A, B, Behavioral responses of flies within 3 cm from the odor port show avoidance during and after a 1 s Eb pulse of 1:5 (A) and 1:1 (B). Mean ± SEM; n = 100–200 total flies per genotype and concentration assayed over at least 10 independent experiments. C, Average velocity of flies within 3 cm from the odor port during and after a 1 s 1:5 Eb pulse. During and immediately after the odor pulse, the velocity away from the odor port is significantly increased by individual knockdown of GABAA receptors and simultaneous knockdown of GABAA and GABAB receptors. The velocity between 2 and 4 s after the odor pulse is significantly increased by simultaneous knockdown of GABAA and GABAB receptors. Statistical analysis: two-way ANOVA with Bonferroni post hoc test (asterisks are color coded to indicate pairwise comparisons vs control), *p < 0.05; **p < 0.01. D, Average velocity during 1:1 Eb odor pulses is unaffected by the knockdown of GABA receptors. However, simultaneous knockdown of GABAA and GABAB receptors significantly prolongs avoidance between 1 and 4 s after termination of the odor pulse. Statistical analysis: two-way ANOVA with Bonferroni post hoc test, *p < 0.05; **p < 0.01. E, F, Average velocity of flies that are >3 cm away from the odor port is unaffected by knockdown of GABA receptors for 1:5 (E) 1:1 (F) Eb odor pulses. Mean ± SEM. N = 200–300 flies.
Figure 9.
Figure 9.
GABAA and GABAB receptors mediate presynaptic inhibition of OSNs to implement temporal contrast enhancement of sustained peripheral responses. A 1 s ethyl butyrate odor pulse (yellow boxes) of high concentration induces sustained peripheral neuronal activity in dendrites and cell bodies of OR22a-expressing OSNs. GABAergic LNs activate GABAA and GABAB receptors, leading to temporally sharpened odor responses in presynaptic terminals. Presynaptic sharpening contributes in mediating temporal contrast enhancement improving the detection of termination of a high-intensity odor pulse.

References

    1. Ache BW, Young JM (2005) Olfaction: diverse species, conserved principles. Neuron 48:417–430. 10.1016/j.neuron.2005.10.022 - DOI - PubMed
    1. Anderson JS, Carandini M, Ferster D (2000) Orientation tuning of input conductance, excitation, and inhibition in cat primary visual cortex. J Neurophysiol 84:909–926. - PubMed
    1. Asahina K, Louis M, Piccinotti S, Vosshall LB (2009) A circuit supporting concentration-invariant odor perception in Drosophila. J Biol 8:9 10.1186/jbiol108 - DOI - PMC - PubMed
    1. Buldyrev I, Taylor WR (2013) Inhibitory mechanisms that generate centre and surround properties in ON and OFF brisk-sustained ganglion cells in the rabbit retina. J Physiol 591:303–325. 10.1113/jphysiol.2012.243113 - DOI - PMC - PubMed
    1. Cao G, Platisa J, Pieribone VA, Raccuglia D, Kunst M, Nitabach MN (2013) Genetically targeted optical electrophysiology in intact neural circuits. Cell 154:904–913. 10.1016/j.cell.2013.07.027 - DOI - PMC - PubMed

Publication types

MeSH terms

LinkOut - more resources