. 2016 Aug 23;3(4):ENEURO.0199-16.2016.
doi: 10.1523/ENEURO.0199-16.2016. eCollection 2016 Jul-Aug.

Excessive Sensory Stimulation during Development Alters Neural Plasticity and Vulnerability to Cocaine in Mice

Affiliations

Excessive Sensory Stimulation during Development Alters Neural Plasticity and Vulnerability to Cocaine in Mice

Shilpa Ravinder et al. eNeuro. .

Abstract

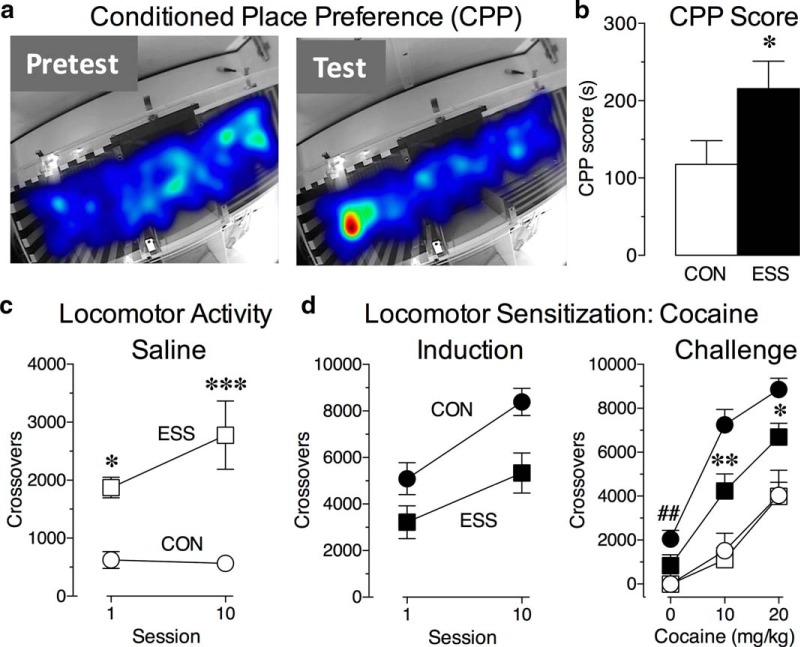
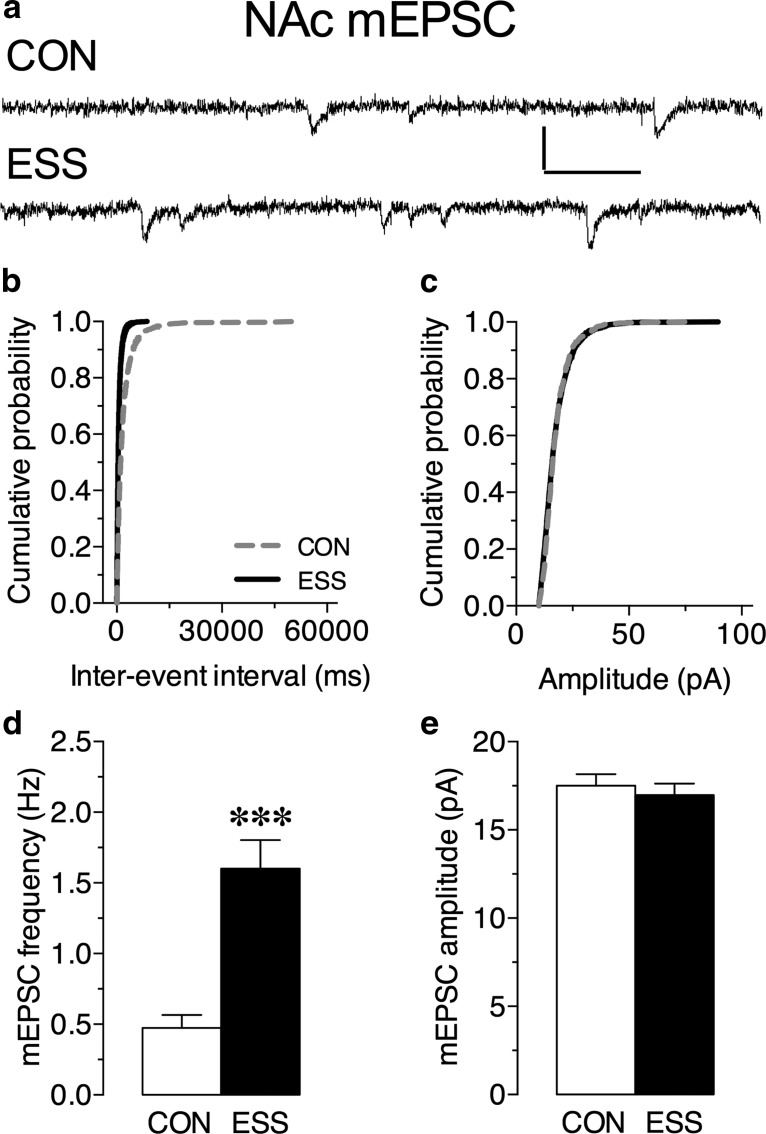
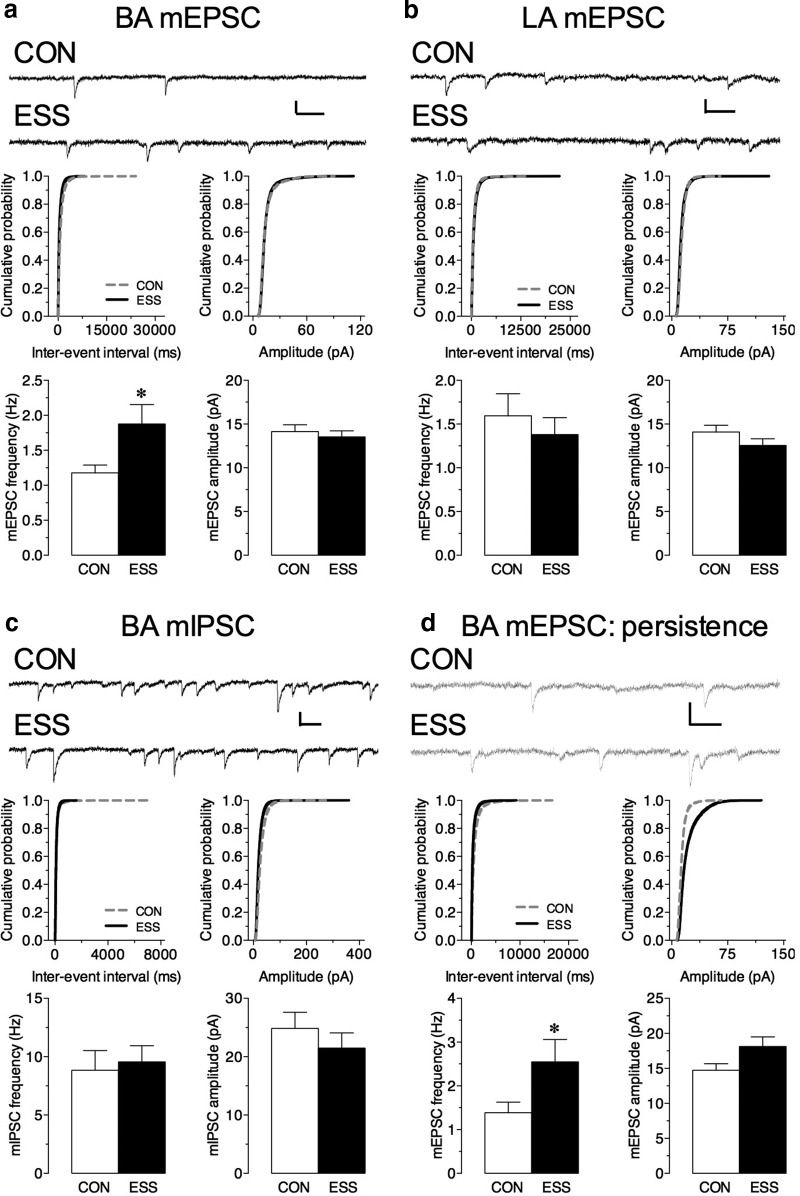
Early life experiences affect the formation of neuronal networks, which can have a profound impact on brain function and behavior later in life. Previous work has shown that mice exposed to excessive sensory stimulation during development are hyperactive and novelty seeking, and display impaired cognition compared with controls. In this study, we addressed the issue of whether excessive sensory stimulation during development could alter behaviors related to addiction and underlying circuitry in CD-1 mice. We found that the reinforcing properties of cocaine were significantly enhanced in mice exposed to excessive sensory stimulation. Moreover, although these mice displayed hyperactivity that became more pronounced over time, they showed impaired persistence of cocaine-induced locomotor sensitization. These behavioral effects were associated with alterations in glutamatergic transmission in the nucleus accumbens and amygdala. Together, these findings suggest that excessive sensory stimulation in early life significantly alters drug reward and the neural circuits that regulate addiction and attention deficit hyperactivity. These observations highlight the consequences of early life experiences and may have important implications for children growing up in today's complex technological environment.

Keywords: amygdala; drug addiction; environment; mice; nucleus accumbens; sensory stimulation.


Figures

Figure 1.
Figure 1.
Exposure to excessive sensory stimulation (ESS) during development alters behavioral responses to cocaine and locomotor activity. a, Representative heat map of time spent in the different compartments of the CPP box during the pretest (left) and on the test (right). b, Mice exposed to ESS during development had a significantly greater CPP score compared with control (CON) mice (*p < 0.05 vs CON; n = 13-14/group). c, Locomotor activity following saline administration in CON mice (white circles) and ESS (white squares) mice, as measured by the total number of crossovers. Exposure to ESS during development led to a significant increase in locomotion compared with controls (*p < 0.05 vs CON mice in session 1; ***p < 0.001 vs CON mice in session 10; n = 7-9/group). d, Left, induction phase, Total number of crossovers made during the 60 min following cocaine injection normalized to baseline responding (i.e., the average total crossovers in the corresponding saline group were subtracted from total crossovers for each mouse) in CON (black circles) and ESS (black squares) mice. Exposure to ESS during development had no effect on the development of locomotor sensitization during cocaine treatment (n = 10-11 mice/group). Right, challenge phase, Total number of crossovers made during the 60 min following each dose of a multidose challenge (0, 10, and 20 mg/kg cocaine). Responses normalized to the corresponding saline pretreatment group at the 0 mg/kg challenge. Control mice that received cocaine during the induction phase, but not mice that were exposed to ESS during development, displayed a conditioned locomotor response (##p = 0.009 vs saline-pretreated CON mice). In addition, ESS mice showed a significantly blunted locomotor sensitization to cocaine (**p = 0.007 vs cocaine-pretreated CON; *p = 0.05 vs cocaine-pretreated CON mice in session 10; n = 7-11 mice/group). Data represent the mean ± SEM.
Figure 2.
Figure 2.
Exposure to excessive sensory stimulation (ESS) does not affect measures of a stress response. a, Exposure to ESS during development does not alter body weight at P53 (i.e., the day after the end of ESS exposure) compared with control (CON) mice (n = 32-39 mice/group). b, Plasma CORT levels at P53. Exposure to ESS during development does not affect baseline plasma CORT levels compared with CON mice (n = 10 mice/group). Data represent the mean ± SEM.
Figure 3.
Figure 3.
Excessive sensory stimulation (ESS) ESS enhances excitatory tone in the nucleus accumbens (NAc) shell. a, Representative mEPSC traces from NAc shell neurons in slices from control (CON) and ESS mice. b, c, Cumulative probability distribution for interevent interval (b) and amplitude (c) of mEPSCs in NAc shell neurons. d, e, Exposure to ESS during development significantly increased the frequency (***p = 0.0002; n = 9-11 cells/group; N = 3-4 mice/group), but not the amplitude of mEPSCs in the NAc shell compared with CON mice. Calibration: 20 pA (vertical axis), 50 ms (horizontal axis). Data represent the mean ± SEM.
Figure 4.
Figure 4.
Excessive sensory stimulation (ESS) during development enhances excitatory tone in the basal amygdala (BA). a, b, Top, Representative mEPSC traces from BA (a) and lateral amygdala (LA) (b) principal neurons in slices from ESS and control (CON) mice. Bottom, Exposure to ESS during development significantly increased the frequency of mEPSCs in the BA (a, left: *p = 0.03; n = 16-17 cells/group; N = 4-9 mice/group) but not in the LA (b, left: n = 10 cells/group; N = 3-4 mice/group) compared with CON mice. There was no effect of this manipulation during development on the amplitude of mEPSCs in the BA (a, right) or in the LA (b, right). Middle, Cumulative probability distribution for interevent interval (left) and amplitude (right) of mEPSCs in BA (a, center) and LA (b, center) neurons. c, Top, Representative mIPSC traces from BA principal neurons in slices from ESS and CON mice. Bottom, Exposure to ESS during development had no effect on the frequency (left) or the amplitude (right) of mIPSCs in the BA compared to that for CON mice (n = 8-10 cells/group; N = 3-4 mice/group). Middle, Cumulative probability distribution for the interevent interval (left) and amplitude (right) of mIPSCs in BA neurons. d, Top, Representative mEPSC traces from BA principal neurons in slices from adult ESS and CON mice 2 months after the end of the stimulation protocol. Bottom, The mEPSC frequency (d, left: *p = 0.05; n = 11-13 cells/group; N = 3-4 mice/group) but not amplitude (right) was significantly increased 2 months following the end of ESS. Middle, Cumulative probability distribution for the interevent interval (left) and amplitude (right) of mEPSCs in BA neurons 2 months following the end of ESS. Calibration (b–e): 20 pA (vertical axis), 50 ms (horizontal axis). Data represent the mean ± SEM.
Figure 5.
Figure 5.
Exposure to excessive sensory stimulation (ESS) does not change action potential firing or basic properties of basal amygdala (BA) principal neurons. a, Representative spike trains evoked by somatic injection of increasing steps of depolarizing currents. b, Input–output (I–O) curve (number of action potentials vs current injected) for BA principal neurons in slices from mice exposed to ESS during development (black squares) and control (CON) mice (white circles). There were no differences in the I–O curve between groups (n = 6-7 cells/group; N = 3-4 mice/group). c–f, Basic properties of BA principal neurons recorded from control and ESS brain slices. c, Resting Vm was not different between BA principal neurons in ESS and CON brain slices (n = 6-7 cells/group; N = 3-4 mice/group). d, Action potential threshold (in millivolts) was not different between BA principal neurons in ESS and CON brain slices (n = 6 cells/group; N = 3-4 mice/group). e, The I–V curve was not different between BA principal neurons in ESS and CON brain slices (n = 5-6 cells/group; N = 3 mice/group). f, Input resistance was not different between BA principal neurons in ESS and CON brain slices (n = 5-6 cells/group; N = 3 mice/group). Calibration: 40 mV (vertical axis), 100 ms (horizontal axis). Error bars indicate the mean ± SEM.

Similar articles

Cited by

References

    1. Aggleton JP (2000) The amygdala: a functional analysis. New York: Oxford UP.[TQ1][TQ2]
    1. Anand A, Shekhar A (2003) Brain imaging studies in mood and anxiety disorders: special emphasis on the amygdala. Ann N Y Acad Sci 985:370–388. - PubMed
    1. Andersen SL, Teicher MH (2009) Desperately driven and no brakes: developmental stress exposure and subsequent risk for substance abuse. Neurosci Biobehav Rev 33:516–524. 10.1016/j.neubiorev.2008.09.009 - DOI - PMC - PubMed
    1. Baxter MG, Murray EA (2002) The amygdala and reward. Nat Rev Neurosci 3:563–573. 10.1038/nrn875 - DOI - PubMed
    1. Britt JP, Benaliouad F, McDevitt RA, Stuber GD, Wise RA, Bonci A (2012) Synaptic and behavioral profile of multiple glutamatergic inputs to the nucleus accumbens. Neuron 76:790–803. 10.1016/j.neuron.2012.09.040 - DOI - PMC - PubMed

MeSH terms

LinkOut - more resources