. 2016 Sep 27;7(39):64007-64020.
doi: 10.18632/oncotarget.11746.

Gata3 restrains B cell proliferation and cooperates with p18INK4c to repress B cell lymphomagenesis

Affiliations

Gata3 restrains B cell proliferation and cooperates with p18INK4c to repress B cell lymphomagenesis

Shiqin Liu et al. Oncotarget. .

Abstract

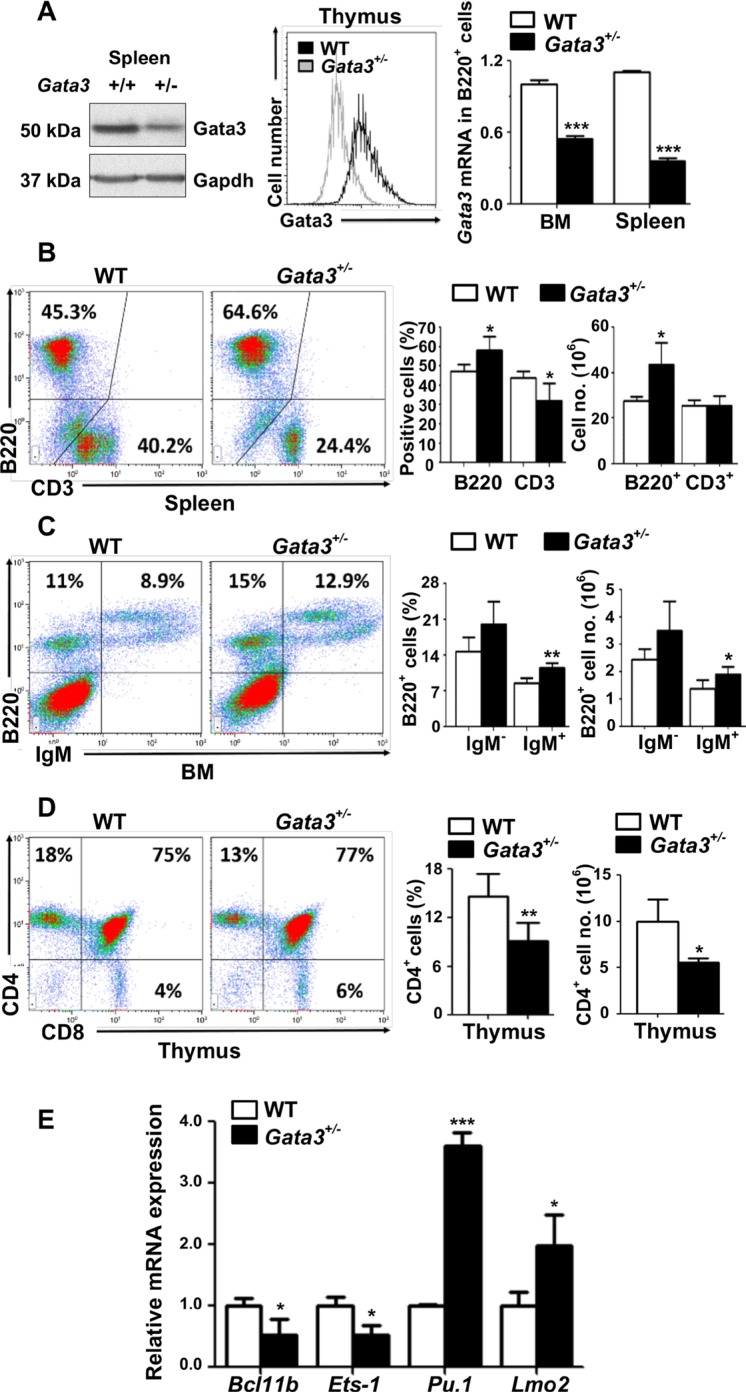
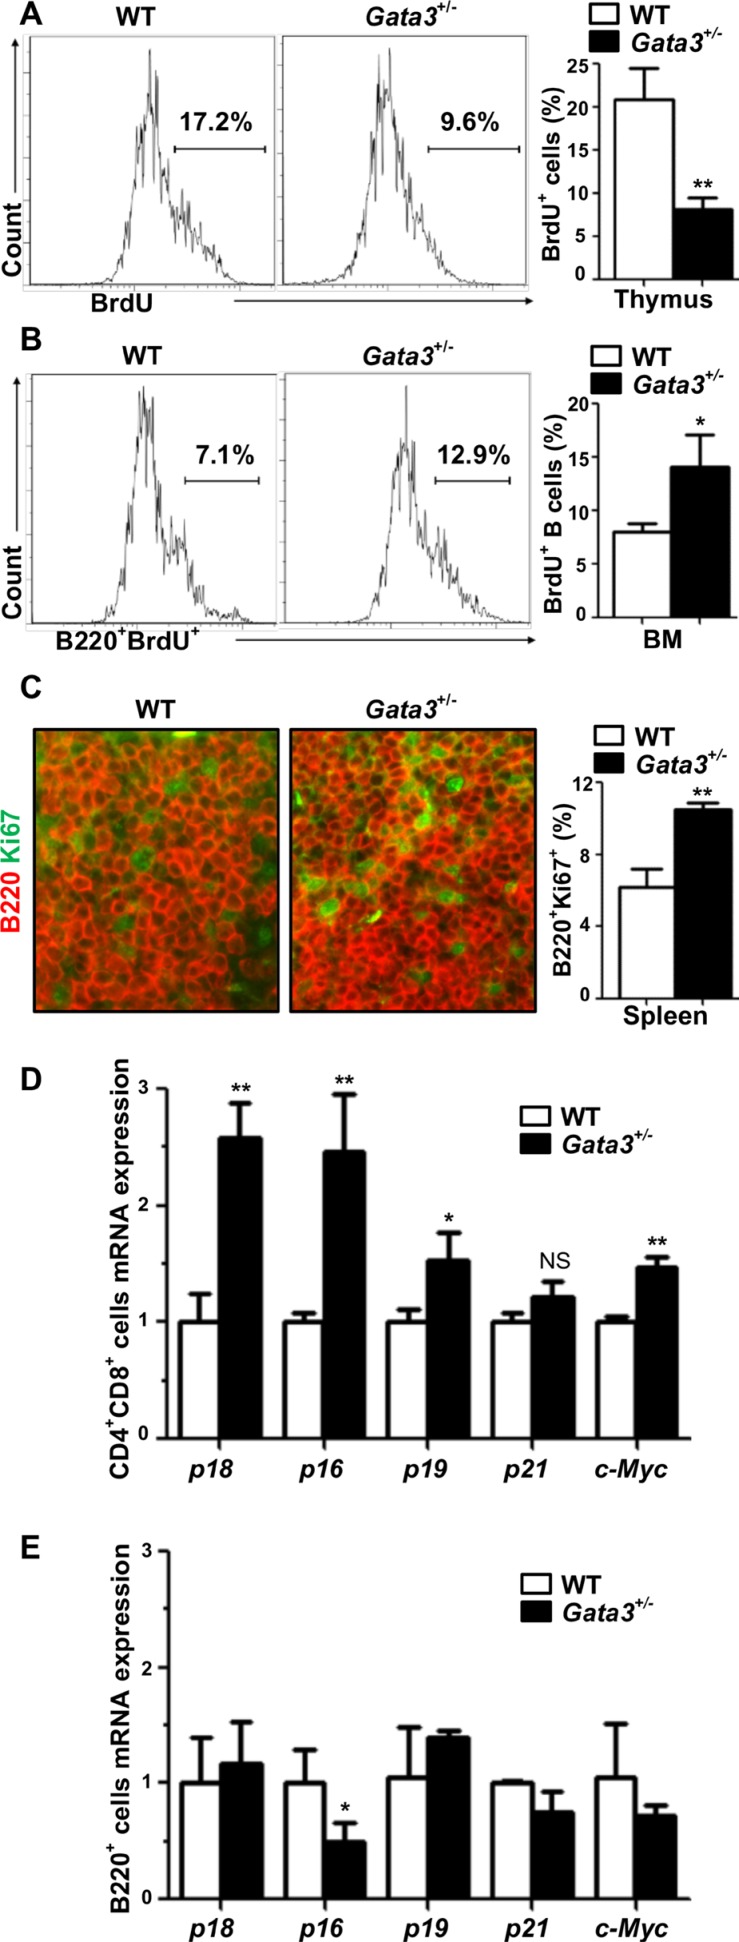
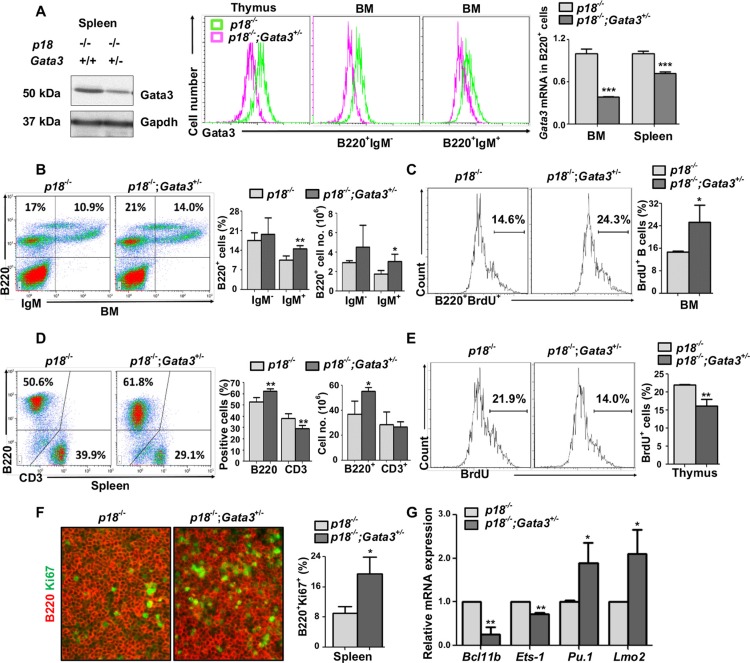
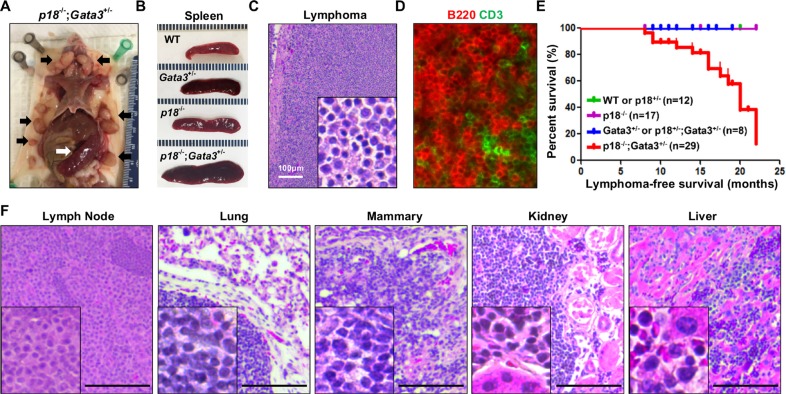
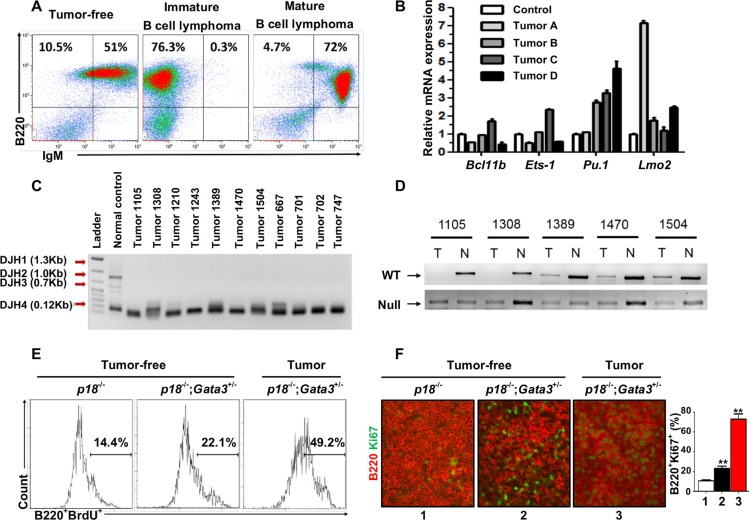
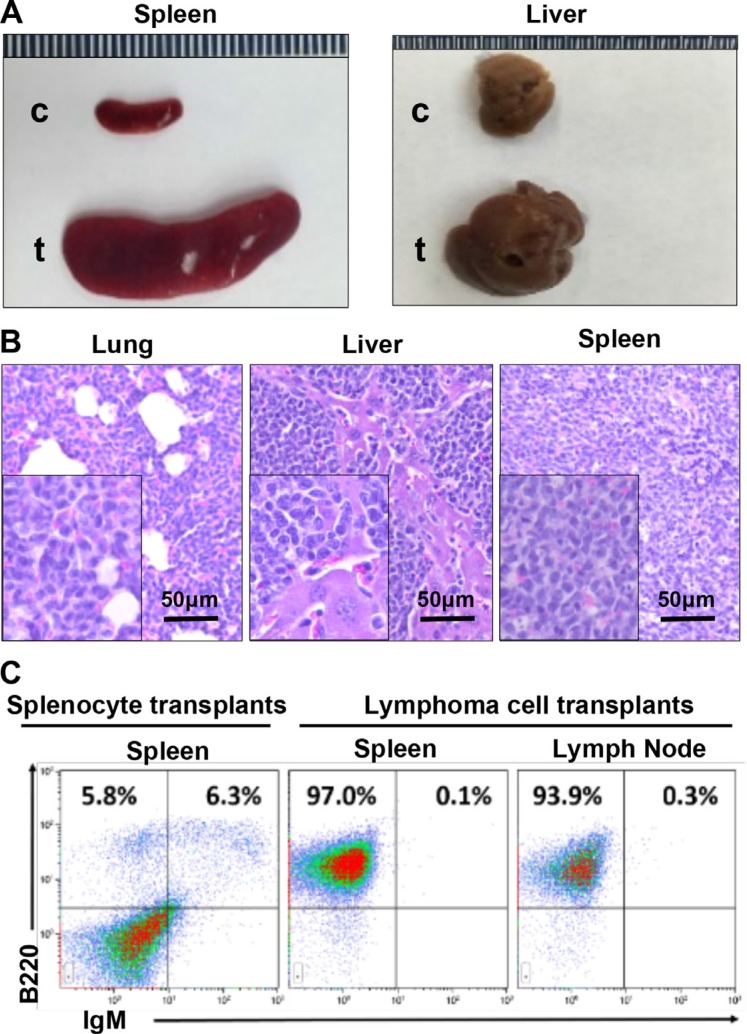
GATA3, a lineage specifier, controls lymphoid cell differentiation and its function in T cell commitment and development has been extensively studied. GATA3 promotes T cell specification by repressing B cell potential in pro T cells and decreased GATA3 expression is essential for early B cell commitment. Inherited genetic variation in GATA3 has been associated with lymphoma susceptibility. However, it remains elusive how the loss of function of GATA3 promotes B cell development and induces B cell lymphomas. In this study, we found that haploid loss of Gata3 by heterozygous germline deletion increased B cell populations in the bone marrow (BM) and spleen, and decreased CD4 T cell populations in the thymus, confirming that Gata3 promotes T and suppresses B cell development. We discovered that haploid loss of Gata3 reduced thymocyte proliferation with induction of p18Ink4c (p18), an inhibitor of CDK4 and CDK6, but enhanced B cell proliferation in the BM and spleen independent of p18. Loss of p18 partially restored Gata3 deficient thymocyte proliferation, but further stimulated Gata3 deficient B cell proliferation in the BM and spleen. Furthermore, we discovered that haploid loss of Gata3 in p18 deficient mice led to the development of B cell lymphomas that were capable of rapidly regenerating tumors when transplanted into immunocompromised mice. These results indicate that Gata3 deficiency promotes B cell differentiation and proliferation, and cooperates with p18 loss to induce B cell lymphomas. This study, for the first time, reveals that Gata3 is a tumor suppressor specifically in B cell lymphomagenesis.

Keywords: B cell; Gata3; lymphoma; p18INK4c.


Conflict of interest statement

CONFLICTS OF INTEREST

The authors declare no conflicts of interest.

Figures

Figure 1
Figure 1. Haploid loss of Gata3 enhances B cell populations in the bone marrow and spleen, but reduces T cell populations in the thymus
(A) Tissues from the spleen or thymocytes of WT and Gata3+/− mice at 2 months of age were analyzed for Gata3 expression by Western blot (left panel) and flow cytometry (middle panel). Sorted B220+ B cells from the BM or spleen were analyzed for Gata3 expression by Q-RT-PCR (right panel). Data represent the mean ± SD from triplicates of 2 mice per genotype. (BD). Cells from the spleen, BM and thymus of WT (n = 5) and Gata3+/− (n = 5) mice at 2 months of age were analyzed by flow cytometry. Representative profiles are shown. no., number. (E) mRNA levels of the indicated genes in thymocytes from WT and Gata3+/− mice at 2 months of age were determined by Q-RT-PCR. Data represent the mean ± SD from triplicates of 3 mice per genotype.
Figure 2
Figure 2. Haploid loss of Gata3 reduces thymocyte proliferation, but stimulates B cell proliferation in the bone marrow and spleen
(A, B) BrdU incorporation in thymocytes and B220+ BM cells from WT and Gata3+/− mice at 2 months of age were analyzed by flow cytometry. Results represent the mean ± SD of 3 animals per group. (C) Immunofluorescence staining of Ki67 (green, nuclear staining) and B220 (red, membrane staining) in spleens from WT and Gata3+/− mice. The percentages of Ki67+ cells were calculated from B220+ cells and quantitated in five randomly selected fields in splenic sections of WT and Gata3+/− mice, and the results represent the mean ± SD of three animals per group. (D, E) Q-RT-PCR analysis for FACS sorted CD4+ CD8+ cells from the thymus and B220+ cells from BM at 2 months of age. Data represent the mean ± SD from triplicates of 2 mice per genotype.
Figure 3
Figure 3. Loss of p18 partially restores Gata3 deficient thymocyte proliferation, and haploid loss of Gata3 in a p18 null background promotes B cell proliferation and differentiation
(A). Splenic tissue, thymocytes, or sorted BM B cells (B220+IgMand B220+IgM+) from p18−/− and p18−/−;Gata3+/− mice at 2 months of age were analyzed for Gata3 expression by Western blot (left panel) and flow cytometry (middle panel). Sorted B220+ B cells from the spleen and BM were analyzed for Gata3 expression by Q-RT-PCR (right panel). Data represent the mean ± SD from triplicates of 2 mice per genotype. (B, D) Cells from the BM (B) and spleen (D) of p18−/− and p18−/−;Gata3+/− mice at 2 months of age were analyzed. Results represent the mean ± SD of 5 animals per group. (C, E) BrdU incorporation in B220+ BM cells (C) and thymocytes (E) from p18−/− and p18−/−;Gata3+/− mice at 2 months of age were analyzed by flow cytometry. Results represent the mean ± SD of 3 animals per group. (F) Immunofluorescence staining of Ki67 (green, nuclear staining) and B220 (red, membrane staining) in the spleen from p18−/− and p18−/−;Gata3+/− mice. The percentagest of Ki67+ cells were calculated from B220+ cells and quantitated in five randomly selected fields in splenic sections of WT and Gata3+/− mice, and the results represent the mean ± SD of three animals per group. (G) mRNA levels of the indicated genes in thymocytes from p18−/− and p18−/−;Gata3+/− mice at 2 months of age were determined by Q-RT-PCR. Data represent the mean ± SD from triplicates of 3 mice per genotype.
Figure 4
Figure 4. Gata3 deficiency in p18 null mice induces B-cell lymphomas
(A) Representative lymphomas developed in p18−/−;Gata3+/− mice. Note the multiple enlarged lymph nodes (black arrows) and typical enlarged spleen (white arrow). (B) Representative gross appearance of spleens from age-matched (12–14 months of age) WT, Gata3+/−, p18−/− and p18−/−;Gata3+/− mice. (C, D) Representative H&E (C) and immunofluorescence staining (D) of primary lymphomas developed in p18−/−;Gata3+/−mice. (E) Lymphoma-free survival of mice with different genotypes. p = 0.018 among four groups by Log-rank (Mantel-Cox) Test. (F) Representative p18−/−;Gata3+/− lymphomas infiltrated into multiple organs, determined by H&E staining.
Figure 5
Figure 5. Characterization of lymphomas developed in p18−/−;Gata3+/− mice
(A) Representative lymphomas from p18−/−;Gata3+/− mice at 14–16 months of age were analyzed by FACS with the indicated antibodies. Age-matched spleens from tumor-free mice of the same genotype were used as control. (B) Q-RT-PCR analysis for cells derived from four representative p18−/−;Gata3+/−lymphomas. Splenocytes from the age-matched, lymphoma-free mice of the same genotype were used to normalize the expression for each gene. Data represent the mean ± SD from triplicate experiments. (C) DJ rearrangement of the heavy chain of immunoglobulin in DNA from p18−/−;Gata3+/− lymphomas was determine by PCR. DNA from a WT spleen with polyclonal B-cell populations was shown as a control. (D) Loss of heterozygosity analysis of representative p18−/−;Gata3+/− lymphomas. DNA isolated from microdissected lymphomas or ear tissues from the same mice were analyzed by PCR. (E) Representative BrdU incorporation in cells from a p18−/−;Gata3+/− lymphoma (Lane 3) and splenocytes from the age-matched (14–6 months), p18−/− (Lane 1) and p18−/−;Gata3+/− (Lane 2) lymphoma-free mice. (F) Immunofluorescence staining of Ki67 (green, nuclear staining) and B220 (red, membrane staining) in spleens from p18−/− (Lane 1) and p18−/−;Gata3+/− (Lane 2) lymphoma-free mice and a p18−/−;Gata3+/− lymphoma (Lane 3). The percentages of Ki67+ cells were calculated from B220+ cells and quantitated in five randomly selected fields in splenic sections, and the results represent the mean ± SD of three animals per group.
Figure 6
Figure 6. p18−/−;Gata3+/− lymphoma cells are transplantable
(A) Representative gross appearance of spleens and livers from recipient mice transplanted by p18−/−;Gata3+/− lymphoma cells (t) and asymptomatic splenocytes (c). (B) Representative H&E staining for lung, liver, and spleen in mice that received lymphoma cell transplants. Note massiave lymphoma cells infiltrating into these organs. (C) Representative FACS analysis for the cells isolated from receipient mouse spleens and lymph nodes. Splenocytes from the mice that received asymptomatic splenocyte transplants were used and analyzed as control.

References

    1. Horner MJ RL, Krapcho M, Neyman N, Aminou R, Howlader N, Altekruse SF, Feuer EJ, Huang L, Mariotto A, Miller BA, Lewis DR, Eisner MP, Stinchcomb DG, et al. SEER Cancer Statistics Review 1975–2006. National Cancer Institute; Bethesda MD: based on November 2008 SEER data submission posted to the SEER web site 2009.
    1. Morton LM, Wang SS, Devesa SS, Hartge P, Weisenburger DD, Linet MS. Lymphoma incidence patterns by WHO subtype in the United States 1992–2001. Blood. 2006;107:265–276. - PMC - PubMed
    1. Wang Y, Misumi I, Gu AD, Curtis TA, Su L, Whitmire JK, Wan YY. GATA-3 controls the maintenance and proliferation of T cells downstream of TCR and cytokine signaling. Nat Immunol. 2013;14:714–722. - PMC - PubMed
    1. Frelin C, Herrington R, Janmohamed S, Barbara M, Tran G, Paige CJ, Benveniste P, Zuniga-Pflucker JC, Souabni A, Busslinger M, Iscove NN. GATA-3 regulates the self-renewal of long-term hematopoietic stem cells. Nat Immunol. 2013;14:1037–1044. - PMC - PubMed
    1. Ku CJ, Hosoya T, Maillard I, Engel JD. GATA-3 regulates hematopoietic stem cell maintenance and cell-cycle entry. Blood. 2012;119:2242–2251. - PMC - PubMed

MeSH terms