. 2016 Sep 2;10(9):e0004957.
doi: 10.1371/journal.pntd.0004957. eCollection 2016 Sep.

A Unified Framework for the Infection Dynamics of Zoonotic Spillover and Spread

Affiliations

A Unified Framework for the Infection Dynamics of Zoonotic Spillover and Spread

Giovanni Lo Iacono et al. PLoS Negl Trop Dis. .

Abstract

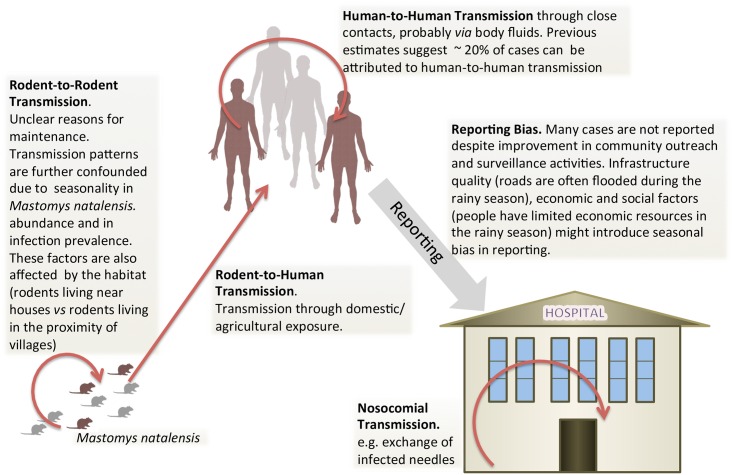
A considerable amount of disease is transmitted from animals to humans and many of these zoonoses are neglected tropical diseases. As outbreaks of SARS, avian influenza and Ebola have demonstrated, however, zoonotic diseases are serious threats to global public health and are not just problems confined to remote regions. There are two fundamental, and poorly studied, stages of zoonotic disease emergence: 'spillover', i.e. transmission of pathogens from animals to humans, and 'stuttering transmission', i.e. when limited human-to-human infections occur, leading to self-limiting chains of transmission. We developed a transparent, theoretical framework, based on a generalization of Poisson processes with memory of past human infections, that unifies these stages. Once we have quantified pathogen dynamics in the reservoir, with some knowledge of the mechanism of contact, the approach provides a tool to estimate the likelihood of spillover events. Comparisons with independent agent-based models demonstrates the ability of the framework to correctly estimate the relative contributions of human-to-human vs animal transmission. As an illustrative example, we applied our model to Lassa fever, a rodent-borne, viral haemorrhagic disease common in West Africa, for which data on human outbreaks were available. The approach developed here is general and applicable to a range of zoonoses. This kind of methodology is of crucial importance for the scientific, medical and public health communities working at the interface between animal and human diseases to assess the risk associated with the disease and to plan intervention and appropriate control measures. The Lassa case study revealed important knowledge gaps, and opportunities, arising from limited knowledge of the temporal patterns in reporting, abundance of and infection prevalence in, the host reservoir.


Conflict of interest statement

The authors have declared that no competing interests exist.

Figures

Fig 1
Fig 1. Schematic of the transmission cycle of Lassa virus in Mastomys natalensis and in humans.
Fig 2
Fig 2. Comparison with ABM I.
(a) Cumulative number of zoonotic infections generated by the ABM (10 independent runs, grey points) for the case when the rate of infection is not affected by the number of humans already infected (no human-to-human transmission) or by depletion of susceptibles (’Simple Poisson’ model). According to model (1) the mean cumulative number of zoonotic infections grows linearly with λ (green line). (b) Quantile-Quantile plot of the distribution of infections, generated by the ABM compared with the theoretical Poisson distribution. (c) As in panel a, but the rate of infection is also subjected to random variation (‘Poisson-Gamma-Mixture’ model); the green line represents the mean cumulative number of zoonotic infections as in panel a. (d) Quantile-Quantile plot of the distribution of infections generated by the ABM compared with the theoretical negative binomial distribution.
Fig 3
Fig 3. Comparison with ABM II.
(a) Cumulative number of infections generated by the ABM (10 independent runs, grey points) for zoonotic spillover with depletion of susceptbibles model (‘Self-Correcting Poisson’); its analytical solution (green line), is given by Eq (S3) in S7 Text. (b) Cumulative number of infections arising from human-to-human transmission generated by the ABM (10 independent runs, grey points) and no depletion of susceptibles (‘Poisson with Feedback’ model). In the special case of no mortality and no recovery, its analytical solution (green line), is an exponential function (Eq (S10) in S7 Text). (c) Cumulative number of infections generated by the ABM (10 independent runs, grey points) for zoonotic spillover with human-to-human transmission and depletion of susceptibles (‘Poisson with Feedback’ model). The dashed blue line represents the mean cumulative number of infections; the special case of no mortality and no recovery is represented by the green line (Eq (S10) in S7 Text).
Fig 4
Fig 4. Estimating the relative contributions of zoonotic spillover and human-to-human transmission.
Comparison with ABM III.(a) Cumulative number of infections for zoonotic spillover with human-to-human transmission and depletion of susceptibles (‘Poisson with Feedback’ model) generated by the ABM (10 independent runs). The green and red points represent cumulative infections arising from zoonotic and human-to-human transmission respectively. The continuous blue and black line represent the analytical solutions and the isolated contributions of zoonotic, CHzoon, and human-to-human transmission, CHh-h, recalculated with parameters (median values of ζ and κ, right panel) estimated from the MCMC. (b) Traceplot of the time series and histogram of the two parameters: ζ (median 0.008338, mean 0.008364, SE 0.0006919, bandwidth 0.0001162) and κ (median 0.055118, mean 0.055134, SE 0.0033703, bandwidth 0.0005541) number of iterations 10000, burning time 1000, thinning interval 1. The small discrepancy between the parameters and the ones imposed in the ABM (respectively 0.05 and 0.01) is expected as the ABM simulates Bernoulli trials rather than Poisson processes. Full agreement is expected when the number of trials approaches infinity.
Fig 5
Fig 5. Application to LF.
(a) Predicted cumulative number of zoonotic and human-to-human infections (governed by ‘Poisson with Feedback’ model, Eq (12)) for constant zoonotic exposure and (b) As in (a), but exposure to zoonotic LASV is governed by an piecewise linear trend in exposure to zoonotic LASV (i.e. the piecewise zoonotic exposure ζ is linearly increasing up to March 2011 followed by a decrease up to January 2012). The parameters are optimized with the data from KGH (red line) by employing MCMC (number of iterations 50000, burning time 1000, thinning interval 1). The grey dots represent 100 independent stochastic realisations; 5 five random examples of which are visualized in blue lines. The black line represents the cumulative number of occurrences averaged over the 100 multiple stochastic realisations.

References

    1. Jones KE, Patel NG, Levy MA, Storeygard A, Balk D, Gittleman JL, et al. Global trends in emerging infectious diseases. Nature. 2008;451(7181):990–3. 10.1038/nature06536 - DOI - PMC - PubMed
    1. Slingenbergh JI, Gilbert M, de Balogh KI, Wint W. Ecological sources of zoonotic diseases. Revue scientifique et technique (International Office of Epizootics). 2004;23(2):467–84. - PubMed
    1. Lloyd-Smith JO, George D, Pepin KM, Pitzer VE, Pulliam JRC, Dobson AP, et al. Epidemic dynamics at the human-animal interface. Science (New York, NY). 2009;326(5958):1362–7. 10.1126/science.1177345 - DOI - PMC - PubMed
    1. Kamara A, Koroma BM, Gogra AB. Seasonal Changes in Vegetation and Land Use in Lassa-Fever-Prone Areas (Kenema and Kailahun Districts) in Eastern Sierra Leone. Natural Resources. 2015;06(07):450–456. 10.4236/nr.2015.67043 - DOI
    1. Blumberg S, Lloyd-Smith JO. Inference of R0 and Transmission Heterogeneity from the Size Distribution of Stuttering Chains. PLoS Computational Biology. 2013;9(5):e1002993 10.1371/journal.pcbi.1002993 - DOI - PMC - PubMed

Publication types