. 2016 Sep 1;63(5):884-97.
doi: 10.1016/j.molcel.2016.07.026.

Global Mapping of Small RNA-Target Interactions in Bacteria

Affiliations

Global Mapping of Small RNA-Target Interactions in Bacteria

Sahar Melamed et al. Mol Cell. .

Abstract

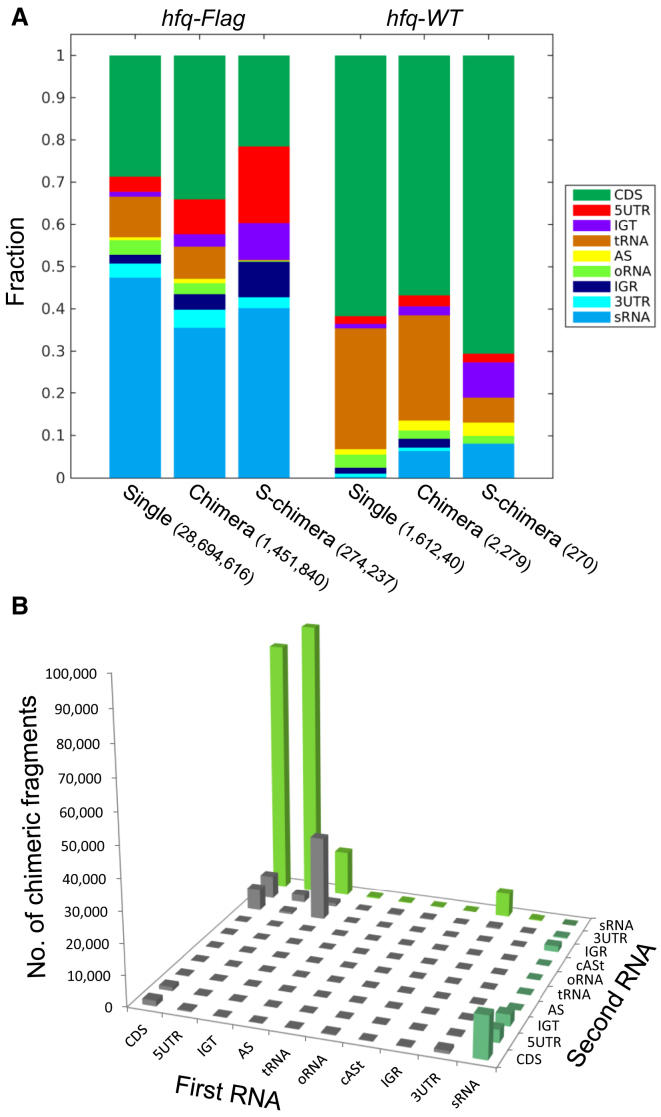
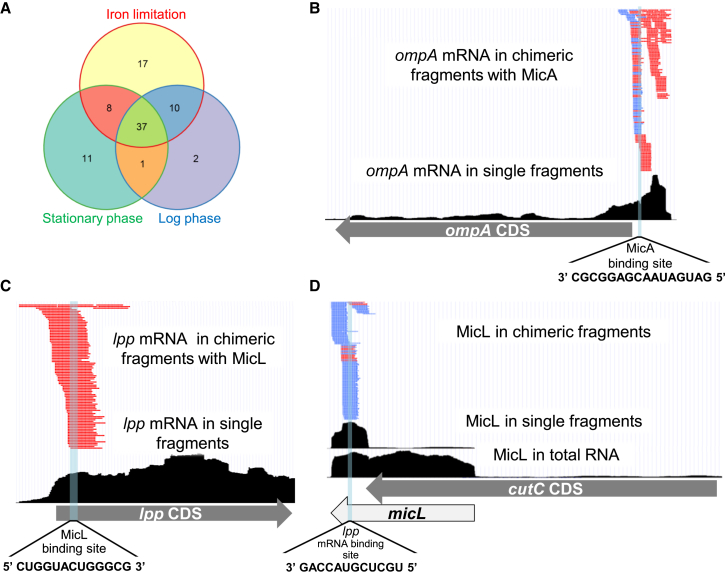
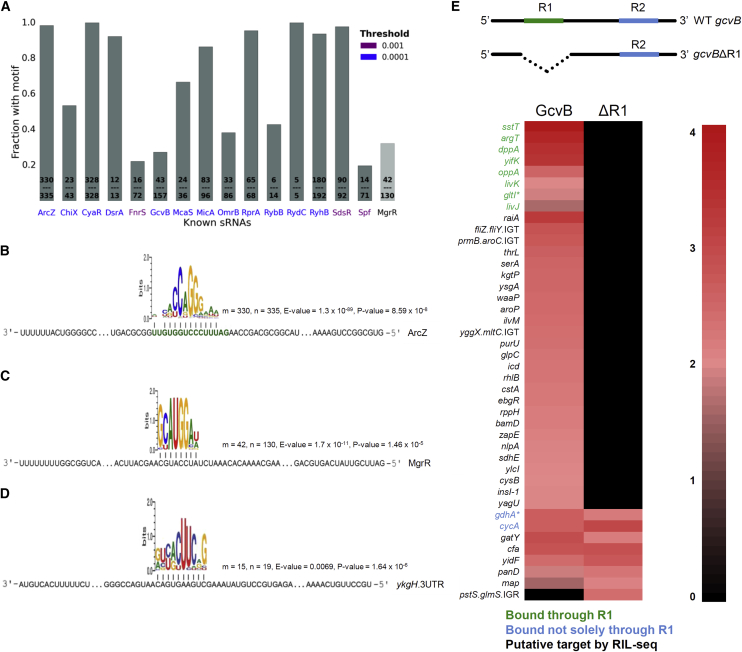
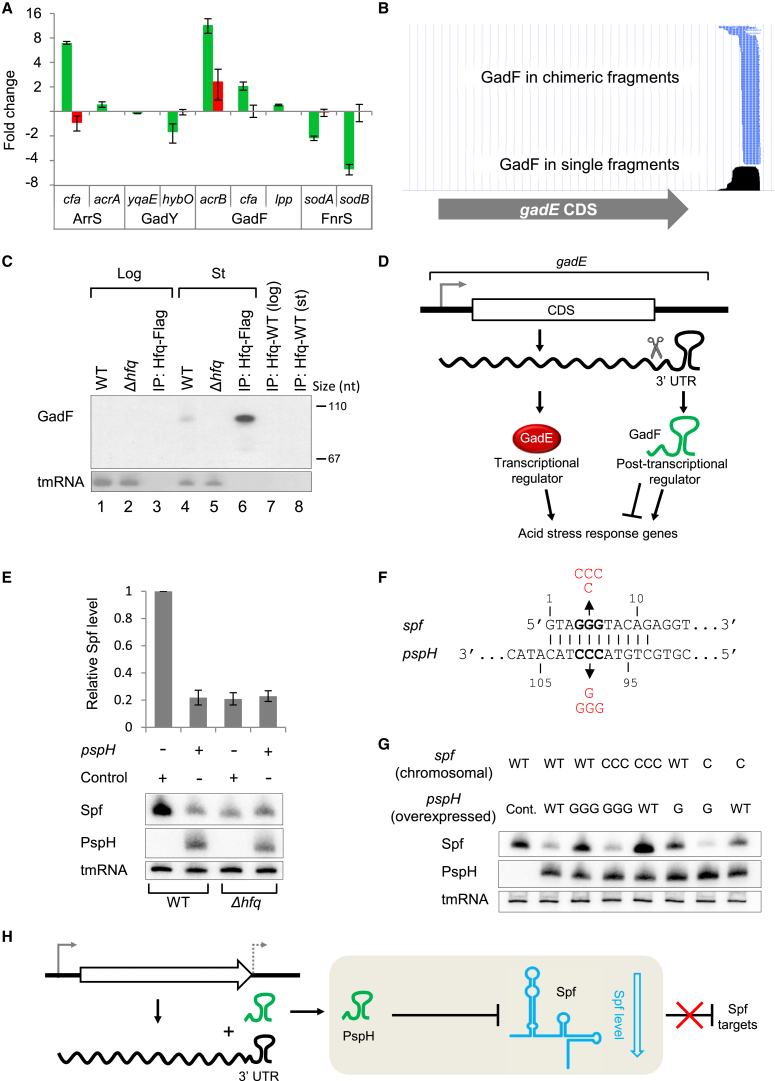
Small RNAs (sRNAs) associated with the RNA chaperon protein Hfq are key posttranscriptional regulators of gene expression in bacteria. Deciphering the sRNA-target interactome is an essential step toward understanding the roles of sRNAs in the cellular networks. We developed a broadly applicable methodology termed RIL-seq (RNA interaction by ligation and sequencing), which integrates experimental and computational tools for in vivo transcriptome-wide identification of interactions involving Hfq-associated sRNAs. By applying this methodology to Escherichia coli we discovered an extensive network of interactions involving RNA pairs showing sequence complementarity. We expand the ensemble of targets for known sRNAs, uncover additional Hfq-bound sRNAs encoded in various genomic regions along with their trans encoded targets, and provide insights into binding and possible cycling of RNAs on Hfq. Comparison of the sRNA interactome under various conditions has revealed changes in the sRNA repertoire as well as substantial re-wiring of the network between conditions.


Figures

None
Graphical abstract
Figure 1
Figure 1
Overview of RIL-seq Experimental and Computational Procedures See also Figures S1 and S2 and Table S1.
Figure 2
Figure 2
RIL-seq Data Are Enriched with sRNAs and mRNAs (A) Distribution of RNAs derived from various genomic elements. Single (Single), chimeric (Chimera), and statistically significant chimeric (S-chimera) sequenced fragments from the log phase hfq-Flag and hfq-WT libraries were classified into nine major categories: 5UTR (5′ UTR), CDS, 3UTR (3′ UTR), tRNA, sRNA, oRNA (other non-coding RNAs), AS (antisense), IGR (intergenic region), and IGT (intergenic within transcript). rRNA-derived fragments were excluded. Fractions are shown (total counts are denoted in parentheses). (B) Total number of S-chimera fragments for each combination of genomic elements. Mapped fragments were classified as in (A) with an additional sub-division of the AS category to cASt (cis antisense with putative trans target). Bars representing fragments with sRNAs as the first/second RNA in the chimera are colored in dark/light green, respectively. See also Figure S3 and Table S2.
Figure 3
Figure 3
Known Targets Are Recovered by RIL-seq (A) 86 out of 154 known sRNA-target pairs (∼56%) were collectively identified by RIL-seq under the three tested conditions (not drawn to scale). (B–D) Examples of identified interactions in log-phase library. (B) ompA-MicA interaction. Coverage of ompA, a known target of MicA is shown. Bottom: in single fragments (black). Top: in S-chimeras with MicA (broken lines in red or blue for ompA mRNA as first or second RNA in the chimera, respectively). MicA reported binding site (Udekwu et al., 2005) is highlighted. (C and D) lpp-MicL interaction. (C) Coverage of lpp, the major target of MicL, in RIL-seq library is shown. Bottom: in single fragments (black). Top: in S-chimeras with MicL (red broken lines). Colors are as in (B). The reported MicL binding site (Guo et al., 2014) is highlighted. (D) Coverage of MicL, a sRNA processed from a transcript transcribed from within the cutC gene, is shown. Bottom: in a total RNA library (black). Middle: in single fragments in RIL-seq library (black), showing that Hfq binds mainly the MicL processed fragment. Top: in S-chimeras (colors are as in B). The reported lpp mRNA binding site (Guo et al., 2014) is highlighted. Data are illustrated with UCSC genome browser (Kent et al., 2002). See also Table S3.
Figure 4
Figure 4
Computational and Experimental Analyses Support the Validity of the Interactions Revealed by RIL-seq (A–D) Common sequence motifs in putative target sets are complementary to binding sites on the sRNA. (A) Bars represent the fractions of targets sharing a common motif that complements the known binding site of a sRNA. Numbers on the bars indicate the number of targets that shared the motif out of all RIL-seq targets of that sRNA. The color of the sRNA name presents the MAST p value threshold in which the motif matched the known binding site, when applicable. MgrR (p ≤ 5.55 × 10−8) has no known binding site. (B–D) Common sequence motifs identified in RIL-seq target sets shown for: (B) ArcZ, (the known binding site is marked in green), (C) MgrR, showing a putative binding site, and (D) ykgH 3′ UTR, a putative 3′ UTR-derived sRNA, for which a putative binding site was identified. Indicated are the number of target sequences that shared the common motif (m), the number of sequences in the target set (n), the E value of MEME, and the p value of MAST. See also Table S4. (E) RIL-seq captures true sRNA-target interactions. Upper part: a schematic representation of the plasmids expressing WT gcvB and gcvBΔR1 used in the experiment. Lower part: a heatmap presenting RIL-seq results of GcvB interactions identified in a ΔgcvB strain carrying WT gcvB or gcvBΔR1 plasmid. For clarity, only known GcvB-target interactions and interactions supported by ≥100 sequenced fragments are shown. For each GcvB-target chimera, the normalized count of sequenced fragments in the respective library multiplied by 105 is presented (log scale). Targets of GcvB, shown in Salmonella to interact through R1 (green), are revealed only with the WT gcvB, while targets shown in Salmonella to interact not solely through R1 (blue) are revealed in both WT gcvB and gcvBΔR1, implying RIL-seq captures true interactions. Known targets in Salmonella not included in our compilation (Table S3). See also Table S5.
Figure 5
Figure 5
sRNAs Tend to be Second in the Chimeric Fragments (A) Distribution of RNA locations as first (red) and second (blue) in S-chimera fragments for RNAs derived from various genomic elements. Mapped fragments were classified as in Figure 2A. See also Figures S5A and S5B and Table S6. (B) The Rho-independent transcription terminator motif was revealed as a common motif for the second RNAs in S-chimeras. See also Figure S5C. The results presented in (A) and (B) are based on S-chimera fragments in the log-phase dataset. n and m are as in Figure 4.
Figure 6
Figure 6
Functional sRNAs (A) Effect of ArrS, GadY and GadF on the GFP intensity of GFP translational fusions of targets identified by RIL-seq. The effect of FnrS on its GFP fused known targets, sodA and sodB, is shown as a positive control. The fold change between GFP fluorescence in the presence of a sRNA overexpressing plasmid and of a control plasmid is presented (WT cells, green bars; Δhfq mutant, red bars). To maintain a unified scale, negative values represent the fold change of control/sRNA overexpression (reduction in GFP intensity) and positive values represent the fold change of sRNA overexpression/control (increase in GFP intensity). Error bars indicate 95% confidence intervals based on at least three independent repeats. The predicted binding sites for each pair are shown in Table S7. (B) The coverage of GadF, a sRNA encoded in the gadE 3′ UTR, in RIL-seq stationary-phase library. Bottom: single fragments (black). Top: S-chimeras (broken lines in blue, indicating that GadF is found always as second RNA in the chimera). (C) Northern blot of GadF. Total RNA from cells grown to log phase (OD600 = 0.3) (lanes 1, 2) and to stationary phase (6 hr) (lanes 4, 5); RNA coimmunoprecipitated from lysates of hfq-Flag cells (lanes 3, 6) or hfq-WT cells (lanes 7, 8) grown to log or stationary phase. (D) Schematic representation of a regulatory circuit involving a transcription factor (GadE) and a sRNA (GadF), generated from the same transcript and regulating genes in the acid stress response pathway at the transcriptional and posttranscriptional level, respectively. (E) The effect of overexpressing PspH on its target, Spf. Northern blot analysis of total RNA from WT or Δhfq cells carrying either a pJV300 plasmid (Control) or a pspH overexpressing plasmid (pspH). The relative Spf level was determined from three independent replicates; Error bars are as in (A). (F) Spf-PspH base-pairing region. Compensatory mutations in chromosomal spf and in plasmid-borne pspH, of either one base change (G or C) or three base changes (GGG or CCC), are indicated in red. (G) The effect of compensatory mutations in spf and pspH on Spf levels. WT cells or cells carrying mutations in chromosomal spf were transformed with a PspH (WT or mutated) overexpressing plasmid or with a pJV300 plasmid as control (Cont.). Cells were grown to OD600 = 0.3, and total RNA was extracted and subjected to northern blot. (H) Schematic description of Spf regulation by PspH. PspH acts as a sponge of Spf, leading to a decrease in Spf level and to abolishment of the negative regulation of Spf targets. In all northern blot experiments, tmRNA served as a loading control. See also Figure S6.
Figure 7
Figure 7
Substantial Re-wiring of the Posttranscriptional Regulatory Network between Conditions (A) Numbers of unique interactions of known sRNAs with targets detected by RIL-seq under the three tested conditions. 1,813 unique interactions were collectively identified for these 25 sRNAs. (B–D) Re-wiring of the sRNA regulatory network between conditions. RIL-seq interactions are represented on E. coli chromosome. Edges connect between the genomic locations of interacting RNAs, where the thickness of an edge is proportional to the normalized number of chimeras. Interactions involving known sRNAs are marked in black, and all other interactions are in pink. Re-wiring is observed for many sRNAs (note, for example, the increase in RyhB interactions under iron limitation). Network views were drawn by circos software (http://circos.ca/).

Comment in

References

    1. Agarwal V., Bell G.W., Nam J.W., Bartel D.P. Predicting effective microRNA target sites in mammalian mRNAs. eLife. 2015;4:05005. - PMC - PubMed
    1. Argaman L., Hershberg R., Vogel J., Bejerano G., Wagner E.G., Margalit H., Altuvia S. Novel small RNA-encoding genes in the intergenic regions of Escherichia coli. Curr. Biol. 2001;11:941–950. - PubMed
    1. Bailey T.L., Gribskov M. Methods and statistics for combining motif match scores. J. Comput. Biol. 1998;5:211–221. - PubMed
    1. Bailey T.L., Boden M., Buske F.A., Frith M., Grant C.E., Clementi L., Ren J., Li W.W., Noble W.S. MEME SUITE: tools for motif discovery and searching. Nucleic Acids Res. 2009;37:W202–W208. - PMC - PubMed
    1. Beisel C.L., Storz G. The base-pairing RNA spot 42 participates in a multioutput feedforward loop to help enact catabolite repression in Escherichia coli. Mol. Cell. 2011;41:286–297. - PMC - PubMed

MeSH terms

LinkOut - more resources