. 2016 Sep 2;10(5):529-539.
doi: 10.1080/19336918.2016.1221563. Epub 2016 Aug 11.

Spatial and temporal coordination of traction forces in one-dimensional cell migration

Affiliations

Spatial and temporal coordination of traction forces in one-dimensional cell migration

Sangyoon J Han et al. Cell Adh Migr. .

Abstract

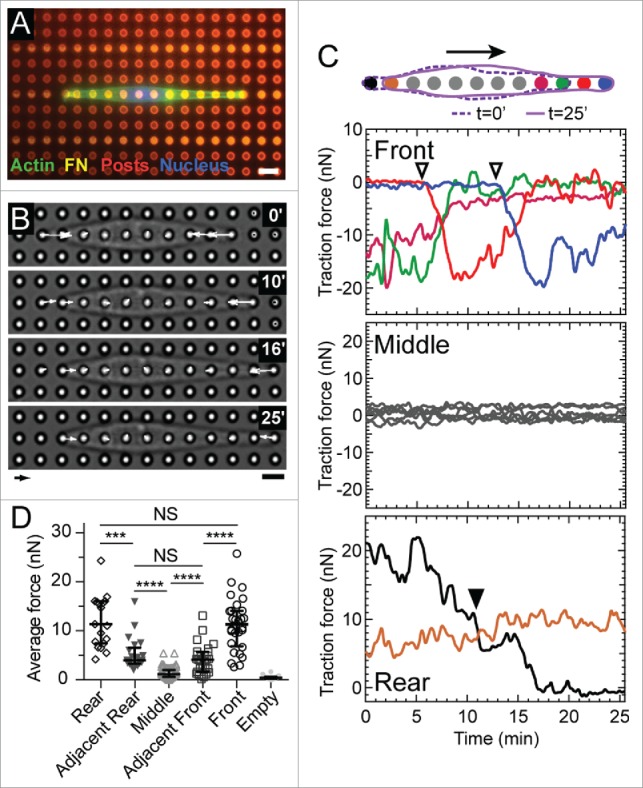
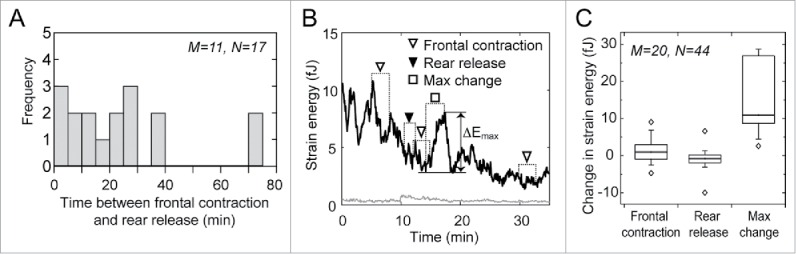
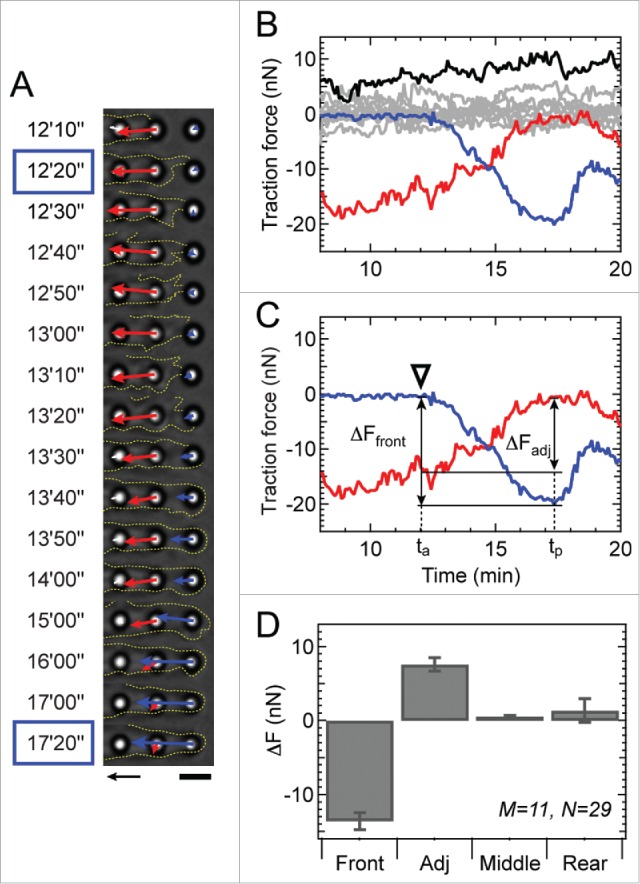
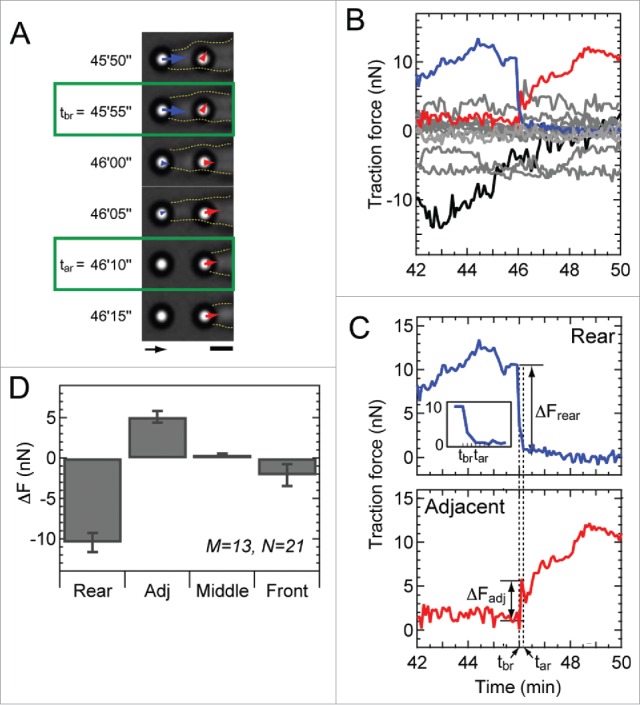
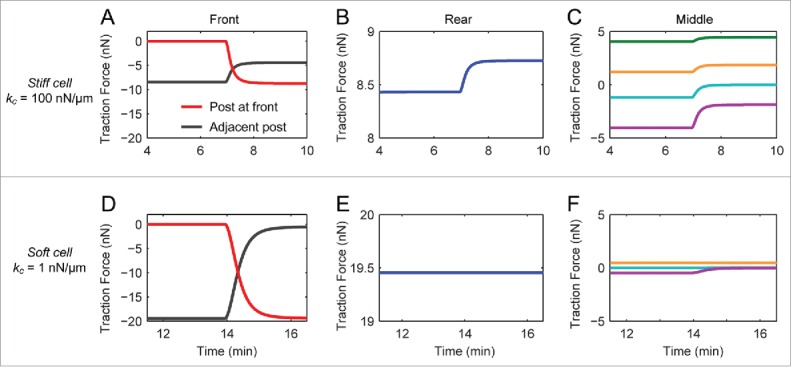
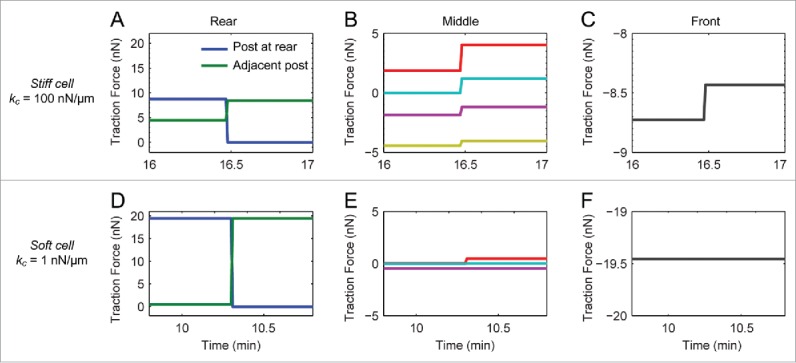
Migration of a fibroblast along a collagen fiber can be regarded as cell locomotion in one-dimension (1D). In this process, a cell protrudes forward, forms a new adhesion, produces traction forces, and releases its rear adhesion in order to advance itself along a path. However, how a cell coordinates its adhesion formation, traction forces, and rear release in 1D migration is unclear. Here, we studied fibroblasts migrating along a line of microposts. We found that when the front of a cell protruded onto a new micropost, the traction force produced at its front increased steadily, but did so without a temporal correlation in the force at its rear. Instead, the force at the front coordinated with a decrease in force at the micropost behind the front. A similar correlation in traction forces also occurred at the rear of a cell, where a decrease in force due to adhesion detachment corresponded to an increase in force at the micropost ahead of the rear. Analysis with a bio-chemo-mechanical model for traction forces and adhesion dynamics indicated that the observed relationship between traction forces at the front and back of a cell is possible only when cellular elasticity is lower than the elasticity of the cellular environment.

Keywords: cell elasticity; cell migration; microposts; migration model; traction forces.


Figures

Figure 1.
Figure 1.
Cell migration on microposts in 1D. (A) Fluorescent image of a representative 3T3 cell stained for actin (green) and its nucleus (blue). The cell is confined to migrate along a row of microposts (red) that have been printed with a line-pattern of fibronectin (magenta). Scale bar: 6 μm. (B) Phase contrast images of a representative migrating cell and its corresponding traction forces. Arrow scale: 10 nN, bar scale: 6 μm. (C) Traces of traction forces over time at each micropost for the representative cell. The color of each trace is illustrated in the accompanying diagram. (Top) Forces at the front of the cell increased when a new adhesion was formed (open inverted triangles). As the force at the front of the cell increases, the force at the micropost adjacent to it decreases. (Middle) Forces at the middle of a cell had an average value of zero within a range of ±5 nN. (Bottom) Force at the rear of the cell decreased steadily over time and did not correlate with the forces at the leading edge. When the cell detached from a rear micropost (▾), the force at its adjacent micropost (brown) increased. (D) Average forces at microposts at the front, adjacent to the front, middle, adjacent to the rear, and rear of migrating cells (M = 15, N = 165 where M indicates the number of experiments and N is the total number of force measurements). The empty posts indicate the posts unoccupied by a cell, the forces of which thus indicate the force resolution of the micropost array. **** p < 0.0001, *** p < 0.001, NS: p > 0.05.
Figure 2.
Figure 2.
Front contraction does not coincide with sudden rear release. (A) Histogram of the time between front contraction and subsequent rear release. (B) Strain energy in the microposts due to the contractile work of the representative cell shown in Fig. 1. Open inverted triangles show the time period (dotted lines) from membrane attachment to the time when force at the front micropost reached its peak. A filled inverted triangle indicates the 2-min period after membrane detachment at the rear. The maximum change in the strain energy (ΔEmax) is indicated by an open square, which does not correspond with a new adhesion or rear release. The changes in strain energy during frontal contractions were negative or negligibly small and were significantly smaller than ΔEmax. (C) Box-plot of the change in strain energy during front contraction and rear release as compared to the maximum change (ΔEmax). The change in strain energy during front contraction was significantly larger than zero (p < 0.05), but also significantly less than the average maximum change in strain energy (p < 0.001). The average change in strain energy during rear release was statistically similar to zero (p = 0.156) and significantly less than the maximum change (p < 0.001). Here, M indicates the number of cells and N shows the number of analyzed events.
Figure 3.
Figure 3.
Frontal contraction coincides with a decrease in force at the adjacent micropost. (A) Phase contrast images showing the movement of the cell membrane (outlined by yellow dotted line) as it attaches to a micropost at 12′20″ and develops maximal force (blue arrow) at 17′20.” Note that the force of the adjacent micropost (red arrow) begins to decrease over time after 12′10.” Arrow scale: 10 nN, Bar scale: 5 μm. (B) Traction forces of all microposts under a cell during frontal contraction at the front micropost (blue). Traction forces measured at the adjacent, middle and rear regions of the cell are shown in red, gray, and black, respectively. (C) The change in force at each micropost (ΔFfront for the front micropost and ΔFadj for the adjacent micropost) was quantified based on 2 time points, ta and tp. Adhesion time ta denotes when the membrane attaches to a micropost and peak time tp denotes when the force at the new micropost reaches its peak value as indicated in panel A with blue boxes. (D) The change in force at the cell's front, adjacent, middle, and rear microposts. The change in force at the adjacent micropost was significantly greater than zero (p < 0.00001), whereas the change in force at the rear was statistically zero (p = 0.865). The change in force at the middle microposts was not statistically larger than zero (p = 0.017), but its mean was very low (<5%) compared to the change in force at the adjacent micropost. Here, M indicates the number of analyzed cells and N shows the number of events.
Figure 4.
Figure 4.
Rear release coincides with a rise in force at the adjacent micropost. (A) Phase contrast images showing the movement of the cell membrane (yellow dotted line) during rear release. Green boxes indicate the time tbr after which the force at the rear micropost (blue arrow) begins to decrease toward zero, as well as the time tar when the membrane visibly detaches from the micropost. Arrow scale: 10 nN, bar scale: 3 μm. (B) Plot of traction forces at the rear (blue), adjacent to the rear (red), middle (gray) and front microposts (black) over time. (C) Plot of traction forces at the rear (top) and adjacent micropost (bottom) as shown in panel B. Changes in force (ΔFrear for the rear micropost and ΔFadj for the adjacent micropost) were measured in reference to the 2 time points: tbr and tar, shown in panel A. (D) Change in force at the rear, adjacent, middle, and front microposts. Although the changes in force at the adjacent, middle, and rear microposts were all significantly larger than zero (p < 0.01), the changes in force within the middle and rear regions of the cell were much smaller than that at the adjacent micropost (p < 0.00001). M represents the number of analyzed cells, whereas N shows the number of events.
Figure 5.
Figure 5.
Simulated traction forces during front contraction using the bio-chemo-mechanical model for cell migration. (A,D) The traction forces for cells with high (kc = 100 nN/μm, A) and low cellular elasticity (kc = 1 nN/μm, D), at the front (red) and adjacent microposts (black). (B,E) Traction forces at the rear for cells with high (B) and low (D) elasticity. (C,F) Traction forces at the middle microposts for cells with high (C) and low (F) elasticity. Note that there is a significant change in force at the middle and rear microposts in the case of high kc, whereas there are negligible changes in force for microposts at the middle and rear in the case of low kc.
Figure 6.
Figure 6.
Cell elasticity affects the spatiotemporal distribution of traction forces during rear release. (A,D) Traction forces at the rear part for in the cases of high (kc = 100 nN/μm, A) and low (kc = 1 nN/μm, D) cellular elasticity with a force at the rear (blue) and adjacent micropost (green). (B,E) Traction forces at the microposts in the middle for cells with high (C) and low (F) elasticity. (C,F) Traction forces at the microposts at the front for cells with high (C) and low (F) elasticity. Note that there is a significant change in force at the middle and front microposts in the case of high kc, whereas there are negligible changes in the forces at the middle or front in the case of low kc.

References

    1. Vicente-Manzanares M, Horwitz AR. Methods Mol Biol 2011; 769:1-24; PMID:21748665 - PubMed
    1. Abercrombie M. Proc Soc R Ser B-Bio 1980; 207:129; http://dx.doi.org/ 10.1098/rspb.1980.0017 - DOI
    1. Munevar S, Wang YL, Dembo M. Biophys J 2001; 80:1744-57; http://dx.doi.org/ 10.1016/S0006-3495(01)76145-0 - DOI - PMC - PubMed
    1. Iwadate Y, Yumura S. Cell J Sci 2008; 121:1314-24; http://dx.doi.org/ 10.1242/jcs.021576 - DOI - PubMed
    1. Lauffenburger DA, Horwitz AF. Cell 1996; 84:359-69; PMID:8608589; http://dx.doi.org/ 10.1016/S0092-8674(00)81280-5 - DOI - PubMed

Publication types