. 2016 Oct 4;55(39):5635-5646.
doi: 10.1021/acs.biochem.6b00627. Epub 2016 Sep 19.

Substrate Specificity of SAMHD1 Triphosphohydrolase Activity Is Controlled by Deoxyribonucleoside Triphosphates and Phosphorylation at Thr592

Affiliations

Substrate Specificity of SAMHD1 Triphosphohydrolase Activity Is Controlled by Deoxyribonucleoside Triphosphates and Phosphorylation at Thr592

Sunbok Jang et al. Biochemistry. .

Abstract

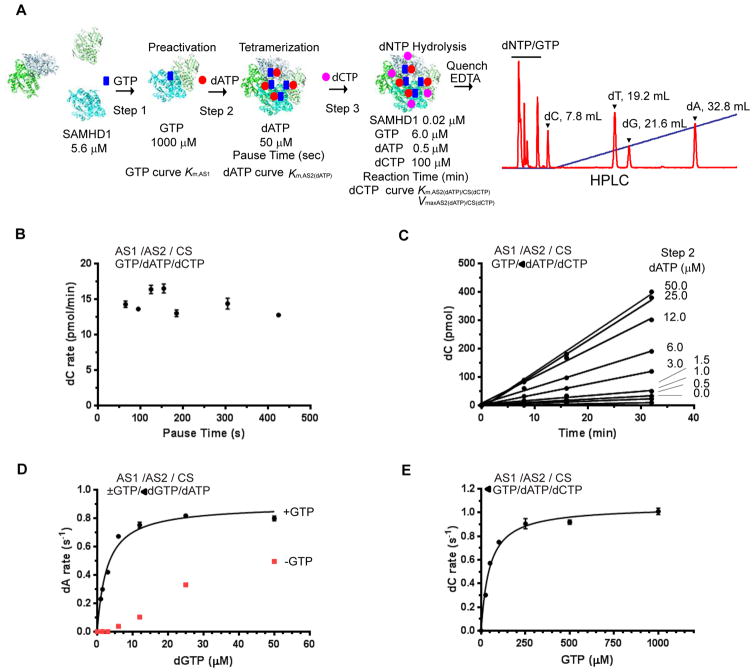
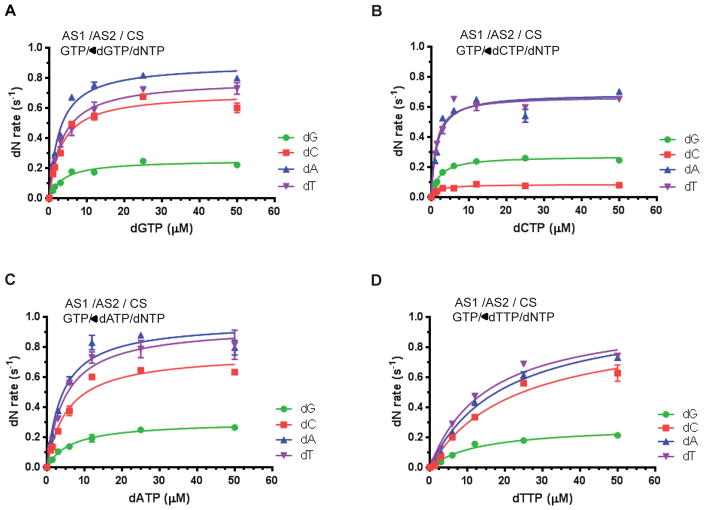
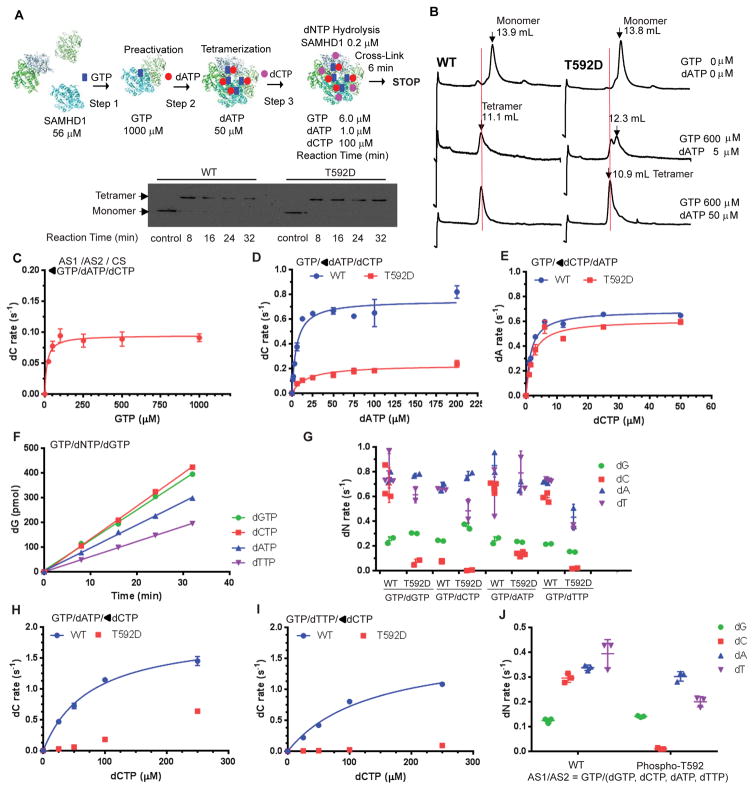
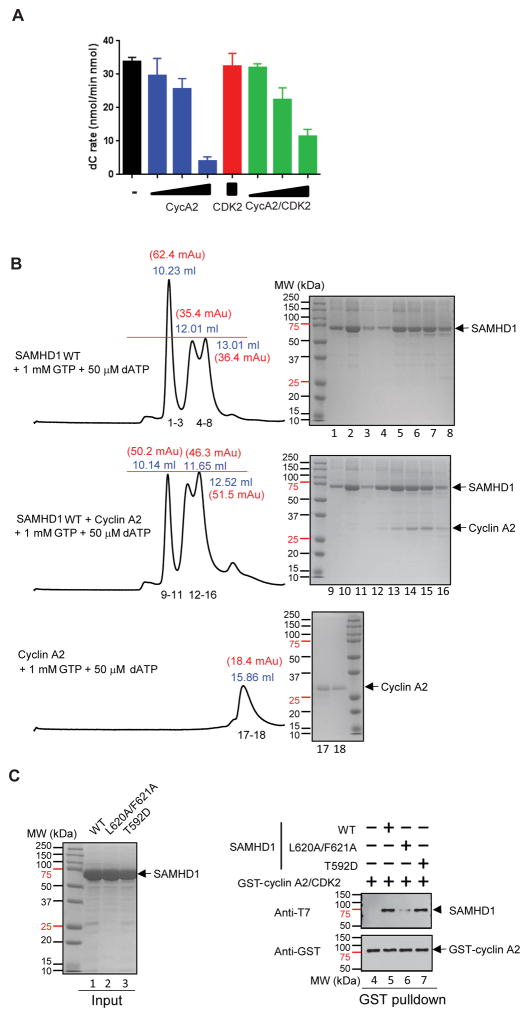
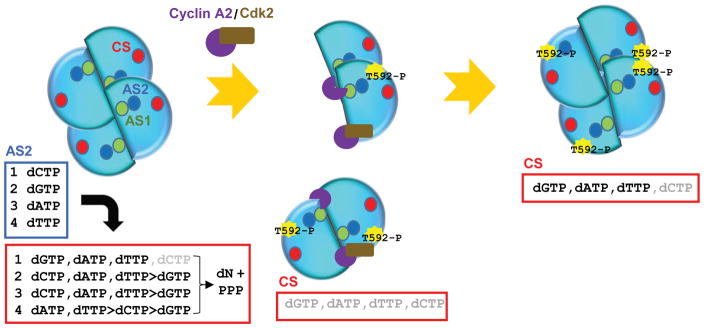
The sterile alpha motif (SAM) and histidine-aspartate (HD) domain containing protein 1 (SAMHD1) constitute a triphosphohydrolase that converts deoxyribonucleoside triphosphates (dNTPs) into deoxyribonucleosides and triphosphates. SAMHD1 exists in multiple states. The monomer and apo- or GTP-bound dimer are catalytically inactive. Binding of dNTP at allosteric site 2 (AS2), adjacent to GTP-binding allosteric site 1 (AS1), induces formation of the tetramer, the catalytically active form. We have developed an enzyme kinetic assay, tailored to control specific dNTP binding at each site, allowing us to determine the kinetic binding parameters of individual dNTPs at both the AS2 and catalytic sites for all possible combinations of dNTP binding at both sites. Here, we show that the apparent Km values of dNTPs at AS2 vary in the order of dCTP < dGTP < dATP < dTTP. Interestingly, dCTP binding at AS2 significantly reduces the dCTP hydrolysis rate, which is restored to a rate comparable to that of other dNTPs upon dGTP, dATP, or dTTP binding at AS2. Strikingly, a phosphomimetic mutant, Thr592Asp SAMHD1 as well as phospho-Thr592, show a significantly altered substrate specificity, with the rate of dCTP hydrolysis being selectively reduced regardless of which dNTP binds at AS2. Furthermore, cyclin A2 binding at the C-terminus of SAMHD1 induces the disassembly of the SAMHD1 tetramer, suggesting an additional layer of SAMHD1 activity modulation by cyclin A2/CDK2 kinase. Together, our results reveal multiple allosteric mechanisms for controlling the rate of dNTP destruction by SAMHD1.


Figures

Figure 1
Figure 1. Sequential activation of SAMHD1 with nucleoside triphosphates
A. Schematic of the enzyme kinetic assay. SAMHD1 monomer and dimers are converted to GTP-bound SAMHD1 dimer (Step 1), upon GTP binding at allosteric site 1 (AS1); subsequent addition of a specific dNTP induces SAMHD1 tetramerization (Step 2), with the dNTP binding at allosteric site 2 (AS2) (dATP is shown in this example scheme); after a short pause (typically 60 s), the mixture is diluted 100-fold, and substrate dNTP is added (Step 3), resulting in hydrolysis of the dNTP as it binds at the catalytic site (CS) (dCTP is shown in this example scheme); a short time after Step 3 (ranging from 8 to 32 minutes), EDTA (20 mM final concentration) is added, and the products are separated by HPLC (red trace on right, this example shows the products from a mixture with all dNTPs added at Step 3, rather than just dCTP as illustrated in the schematic). In this scheme, the concentration of GTP at Step 1, or dNTP at Step 2, can be varied to determine the Km at each allosteric site. The concentration of substrate (Step 3) can also be varied, with fixed concentrations of GTP at Step 1 and dNTP at Step 2, to determine Km and Vmax at the catalytic site for dNTP hydrolysis. The concentrations of SAMHD1, GTP, dATP and dCTP are indicated after initial introduction steps and at the final step. B. The rate of dCTP hydrolysis is independent of pause time after Step 2. Sequential activation of SAMHD1 was performed with GTP at Step 1 and dATP at Step 2, and the rate of dCTP hydrolysis was determined. The final concentrations of SAMHD1, GTP, dATP and dCTP were 0.02 μM, 6.0 μM, 0.5 μM and 100 μM, respectively. The pause time was varied between 60 and 420 sec. The pause time (abscissas) is plotted against the rate of dC formation (ordinate). The averages of two independent experiments are shown. GTP/dATP/dCTP on the upper left corner of the panel indicates that AS1, AS2 and CS are occupied with GTP, dATP and dCTP, respectively. C. The rate of dC formation was determined by plotting dC production against reaction time with various concentrations of dATP present at Step 2 (note GTP/◀dATP/dCTP on the upper left corner of the panel). The final concentrations of SAMHD1, GTP and dCTP were 0.02 μM, 6.0 μM, and 100 μM, respectively. D. The rates of dATP hydrolysis (dA rate, s−1) were determined with GTP present (black circles) or not (red squares) at Step 1 and increasing concentrations of dGTP present at Step 2. The final concentration of dATP substrate was 100 μM. The dA formation rate at a specific dGTP concentration was determined from the slope of a plot similar to that shown in C. E. The rates of dCTP hydrolysis were determined with increasing concentrations of GTP at Step 1. The concentrations of dATP at Step 2 and dCTP at Step 3 were 50 μM and 100 μM, respectively. The data were fitted with Michaelis-Menten kinetics. The value of Km,AS1 was 47 ± 6.3 μM and the maximal rate of dCTP hydrolysis at 100 μM was 1.1 ± 0.1 s−1.
Figure 2
Figure 2. Michaelis-Menten kinetics of dNTPase activity of SAMHD1 with all possible pairs of nucleoside triphosphates bound at the allosteric sites
A–D. The hydrolysis rates of dGTP (green circles), dCTP (red squares), dATP (blue triangles), and dTTP (purple inverted triangles), each at 100 μM final concentration, were determined with increasing concentrations of dGTP (A), dCTP (B), dATP (C) and dTTP (D) at Step 2 with a fixed concentration of GTP (1000 μM) at Step 1. The experiments were performed as described in Figure 1A and 1C. AS1/AS2/CS indicates that the allosteric site 1, allosteric site 2 and catalytic site are occupied with the individual nucleoside triphosphate noted below each. The data were fitted with Michaelis-Menten kinetics as described in the Experimental Procedures. The values of Km,AS2(dGTP), Km,AS2(dCTP), Km,AS2(dATP), and Km,AS2(dTTP) for each dNTP substrate are summarized in Table 1.
Figure 3
Figure 3. The type of deoxyribonucleoside triphosphate bound at the allosteric site 2 determines the substrate specificity of SAMHD1
A. The rates of dGTP (green circles), dCTP (red squares), dATP (blue triangles) and dTTP (purple inverted triangles) hydrolysis were individually determined, with increasing concentrations of each dNTP at Step 3 and fixed concentrations of dGTP (50 μM) at Step 2 and GTP (1000 μM) at Step 1 (GTP/dGTP/◀dNTP). AS1/AS2/CS at the top of each figure indicates the allosteric site 1, allosteric site 2 and catalytic site are occupied with the individual nucleoside triphosphates noted below each. The data were fitted with Michaelis-Menten kinetics. B–D. The rates of dGTP, dCTP, dATP and dTTP hydrolysis were individually determined with a fixed concentration (50 μM) of dCTP (B), dATP (C) or dTTP (D) at Step 2. The values of Km,AS2(dNTP),CS(dNTP) and Vmax,AS2(dNTP),CS(dNTP) for all possible pairs at the allosteric site 2 (AS2) and catalytic site (CS) are summarized in Table 2.
Figure 4
Figure 4. SAMHD1 T592D and phospho-T592 lack dCTPase activity
A. Cross-linking of SAMHD1 tetramers during enzyme catalysis. SAMHD1 WT and T592D proteins were sequentially activated with GTP at Step 1 and dATP at Step 2, in a manner similar to that shown in Figure 1A, with dCTP added at Step 3 as a substrate. The reaction mixtures were subjected to cross-linking for 6 min, after 8, 16, 24 and 32 min of catalysis, then separated over SDS-PAGE, followed by immunoblotting (lower panel). The control is SAMHD1 without cross-linking. B. WT and T592D SAMHD1 proteins alone (0.5 μM, upper panels) or with the mixture of GTP and dATP (lower panels) were separated with analytical size exclusion column chromatography. The elution profile was recorded with an in-line fluorescence detector. The positions of apo-SAMHD1 and GTP/dATP-bound tetramer in the elution profiles are indicated with arrows and elution volumes (19). The column was pre-equilibrated with GTP and dATP when indicated. C. The rates of dCTP hydrolysis were determined for T592D SAMHD1, with increasing concentrations of GTP at Step 1 and a fixed concentration of dATP (50 μM) at Step 2 as shown in Figure 1A (◀GTP/dATP/dCTP). The concentration of dCTP at the Hydrolysis Step was 100 μM. The values of Km,AS1 and the maximal rate of dCTP hydrolysis at 100 μM were 14.6 ± 4.5 μM and 0.10 ± 0.01 s−1, respectively. D. The Km value of dATP at the allosteric site 2 was measured for WT and T592D. The values of Km,AS2(dATP) for WT and T592D were 5.5 ± 1.1 μM, and 17.8 ± 5.0 μM, respectively. The maximal rates of dCTP hydrolysis at 100 μM for WT and T592D were 0.75 ± 0.03, 0.23 ± 0.02 s−1, respectively. E. The Km constant of dCTP at the allosteric site 2 was determined for WT and T592D. The values of Km,AS2(dCTP) for WT and T592D were 1.5 ± 0.4 μM, and 2.0 ± 0.5 μM, respectively. The maximal rates of dATP hydrolysis at 100 μM for WT and T592D were 1.0 ± 0.1, 0.93 ± 0.01 s−1, respectively. F. The hydrolysis of dGTP at 100 μM was measured for T592D SAMHD1 tetramer in complex with GTP/dGTP (green circles), GTP/dCTP (red squares), GTP/dATP (blue triangles), and GTP/dTTP (purple inverted triangles), respectively as shown in Figure 1A. The concentrations of dNTP at Step 2 was 50 μM. G. The rates of hydrolysis for each dNTP (ordinate) were measured for WT or T592D, with the allosteric site 1 and allosteric site 2 occupied by GTP (1000 μM at Step 1) and the indicated dNTP (50 μM at Step 2, abscissas), respectively. For example, GTP/dGTP at the abscissas indicates that the allosteric site 1 and 2 are occupied with GTP and dGTP, respectively. The rates of dGTP (green circles), dCTP (red squares), dATP (blue triangles), and dTTP (purple inverted triangles) at 100 μM were determined individually. Experiments were repeated in two to four replicates, and data are shown with error bars, SD. H. The rate of dCTP hydrolysis was measured with increasing concentrations of dCTP at Step 3 for GTP/dATP-induced WT or T592D tetramer. The concentration of dATP at Step 2 was 100 μM. The Km,AS2(dATP)/CS(dCTP) and Vmax, AS2(dATP)/CS(dCTP) value for WT was 76 ± 9 μM and 1.9 ± 0.1 s−1, respectively. I. The rate of dCTP hydrolysis was measured with increasing concentrations of dCTP at Step 3 for GTP/dTTP-induced WT or T592D tetramer. The concentration of dTTP at Step 2 was 100 μM. The Km,AS2(dTTP)/CS(dCTP) and Vmax, AS2(dTTP)/CS(dCTP) value for WT was 136 ± 36 μM and 1.7 ± 0.2 s−1, respectively. J. The rate of hydrolysis for each individual dNTP, at 100 μM, was determined for mock treated WT or phospho-Thr592 SAMHD1, which was sequentially activated with GTP (1000 μM at Step 1) and a mixture of dNTPs (Step 2; each at 12.5 μM). Experiments were repeated in three replicates, and data are shown with error bars, SD.
Figure 5
Figure 5. Cyclin A2 inhibits SAMHD1 catalysis
A. The rates of dCTP hydrolysis by SAMHD1 were measured with increasing amounts of cyclin A2, CDK2, or cyclin A2/CDK2 added at Step 1 (Figure 1A). Three different molar ratios (0.1X, 0.2X and 1X) of cyclin A2 (blue bars) or cyclin A2/CDK2 (green bars) were used, or an equal molar ratio of CDK2 to SAMHD1 was used (red bar). B. Mixtures of SAMHD1 (14 μM), GTP and dATP, with or without cyclin A2 (14 μM), as indicated, were subjected to analytical size exclusion column chromatography. Elution volume with the UV280 absorbance at the peak are indicated. Numbers below the bottom trace indicate fractions analyzed by SDS-PAGE and Coomassie blue staining, shown on the right. C. Purified SAMHD1 WT, L620A/F621A and T592D proteins were separated by SDS-PAGE and stained with Coomassie Blue (upper panel). GST-cyclin A2/CDK2 complex was incubated with recombinant SAMHD1 proteins and bound fractions were analyzed by Western blotting.
Figure 6
Figure 6. Regulation of SAMHD1 dNTPase activity by deoxyribonucleoside triphosphate and cyclin A2/CDK2
GTP binding at the allosteric site 1 (AS1) is prerequisite for activation of SAMHD1 catalysis. SAMHD1 always likely exists in a GTP-bound form due to high cellular concentration of GTP. Binding of dCTP at the allosteric site 2 (AS2) increases triphosphohydrolase activity for dGTP, dATP and dTTP, not dCTP. Binding of dGTP, dATP and dTTP at AS2 differentially induces dNTPase activity. Binding of cyclin A2 or cyclin A2/CDK2 induces disassembly of SAMHD1 tetramer. Phosphorylation of Thr592 by cyclin A2/CDK2 induces conformational changes, resulting in an overall inhibition of dCTP hydrolase activity.

References

    1. Hakansson P, Dahl L, Chilkova O, Domkin V, Thelander L. The Schizosaccharomyces pombe replication inhibitor Spd1 regulates ribonucleotide reductase activity and dNTPs by binding to the large Cdc22 subunit. J Biol Chem. 2006;281:1778–1783. - PubMed
    1. Hakansson P, Hofer A, Thelander L. Regulation of mammalian ribonucleotide reduction and dNTP pools after DNA damage and in resting cells. J Biol Chem. 2006;281:7834–7841. - PubMed
    1. Bebenek K, Roberts JD, Kunkel TA. The effects of dNTP pool imbalances on frameshift fidelity during DNA replication. J Biol Chem. 1992;267:3589–3596. - PubMed
    1. Chabes A, Georgieva B, Domkin V, Zhao X, Rothstein R, Thelander L. Survival of DNA damage in yeast directly depends on increased dNTP levels allowed by relaxed feedback inhibition of ribonucleotide reductase. Cell. 2003;112:391–401. - PubMed
    1. Gon S, Napolitano R, Rocha W, Coulon S, Fuchs RP. Increase in dNTP pool size during the DNA damage response plays a key role in spontaneous and induced-mutagenesis in Escherichia coli. Proc Natl Acad Sci USA. 2011;108:19311–19316. - PMC - PubMed

MeSH terms

Substances