. 2016 Oct 18;54(4):1521-1538.
doi: 10.3233/JAD-150960.

Halting of Caspase Activity Protects Tau from MC1-Conformational Change and Aggregation

Affiliations
Free PMC article

Halting of Caspase Activity Protects Tau from MC1-Conformational Change and Aggregation

Emma Mead et al. J Alzheimers Dis. .
Free PMC article

Abstract

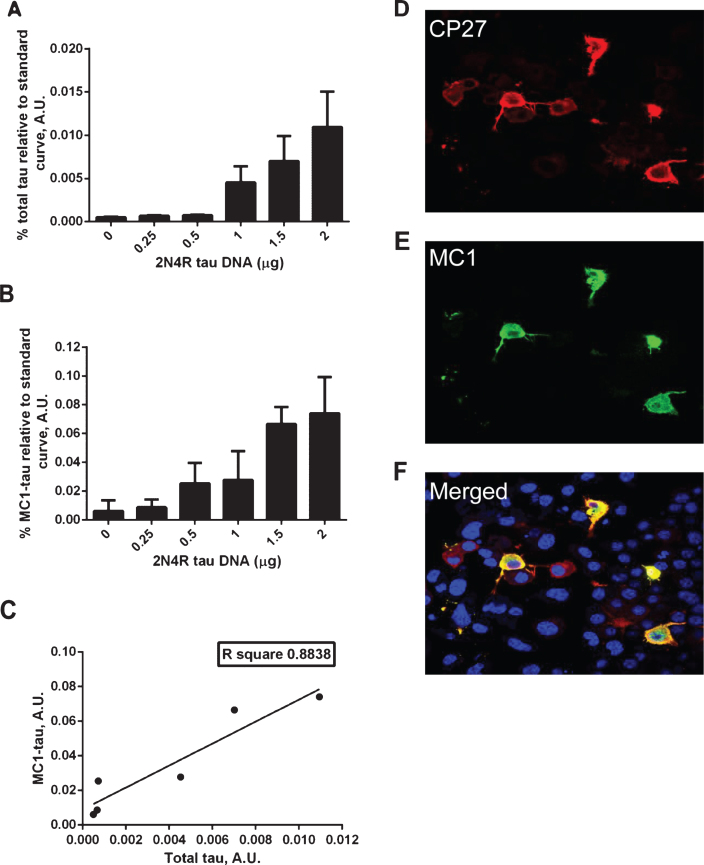
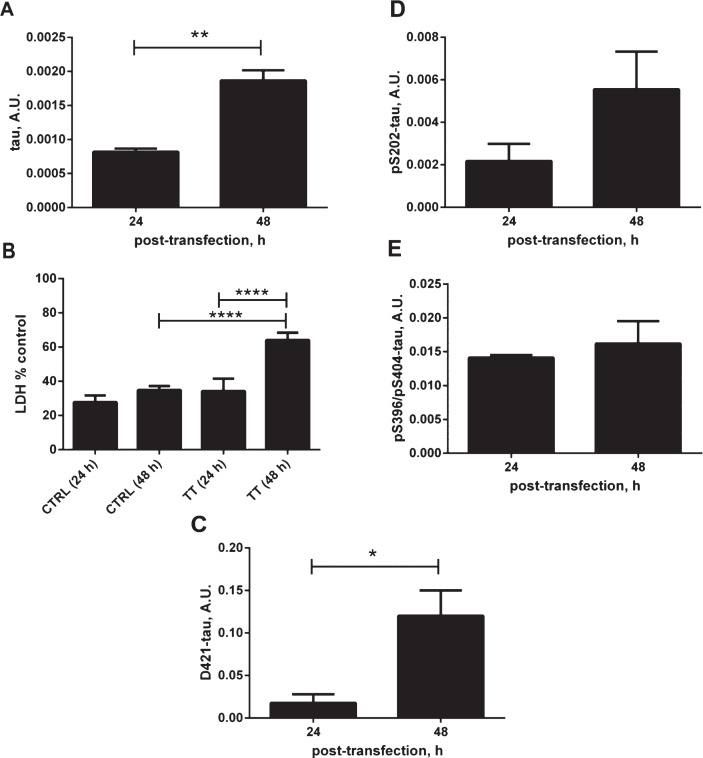
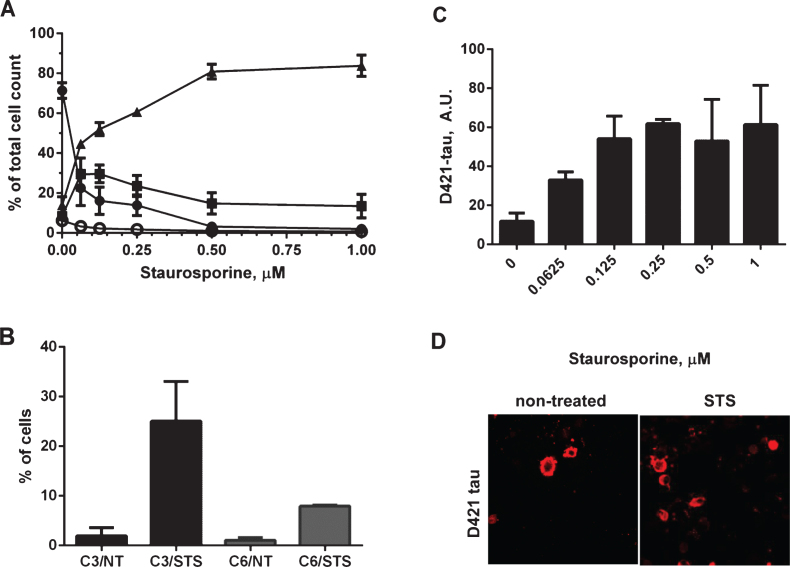
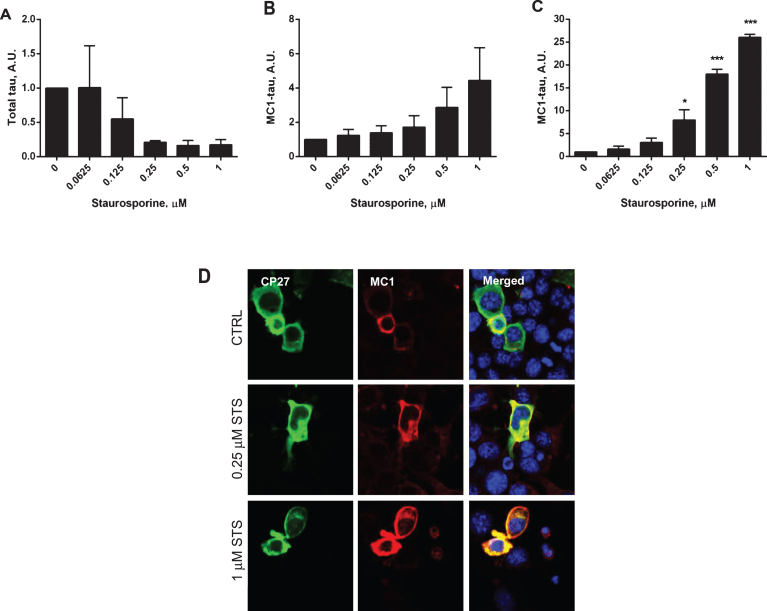
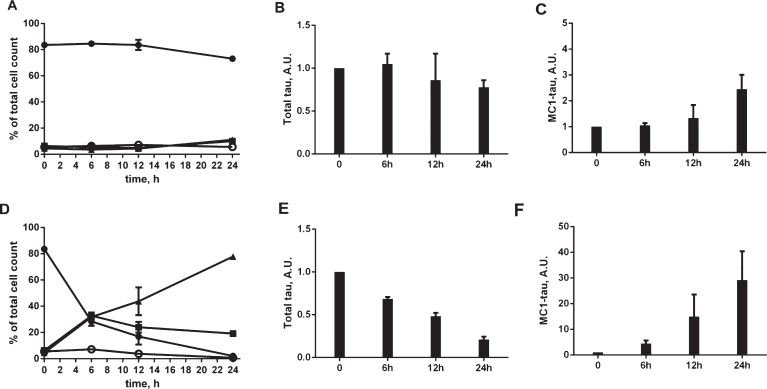
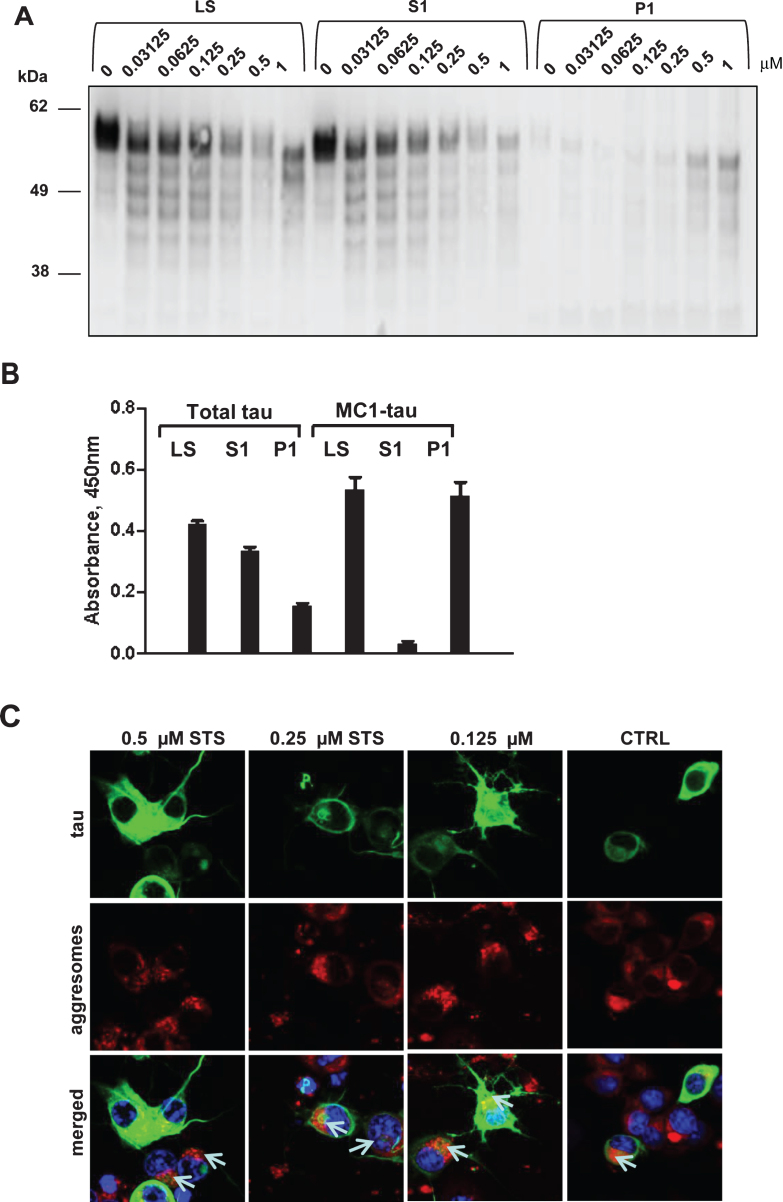
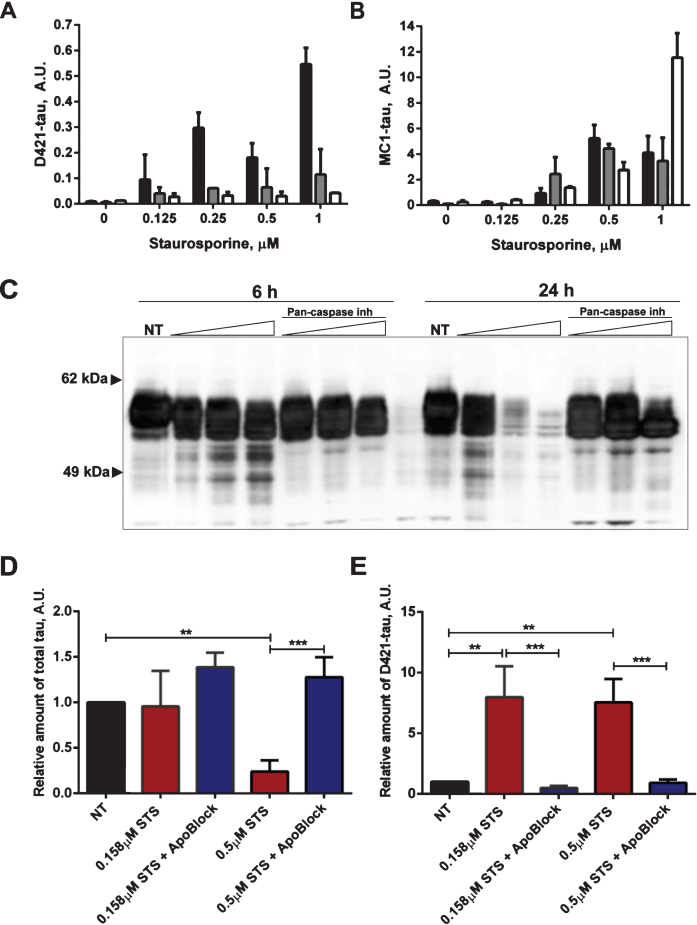
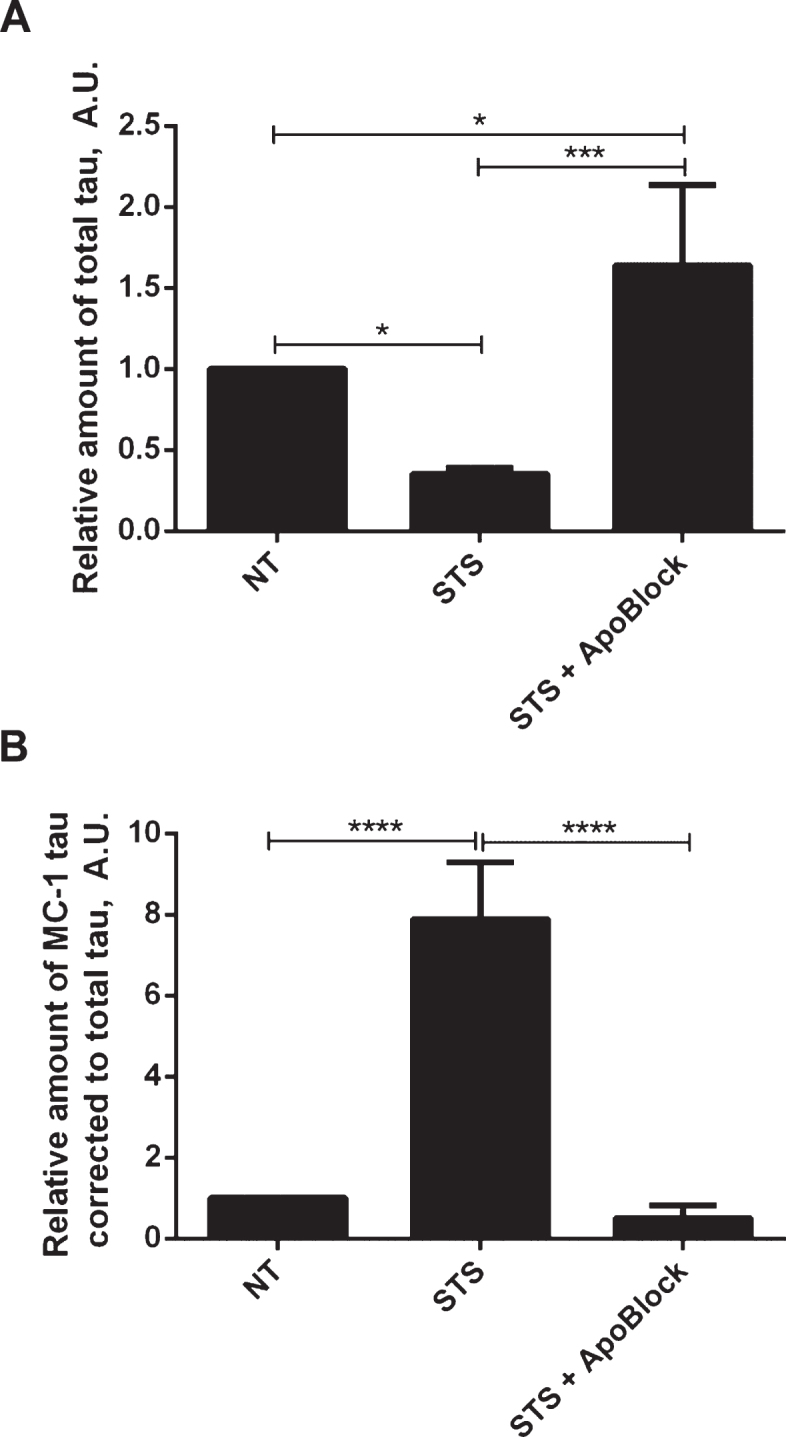
Intracellular neurofibrillary tangles (NFTs) are the hallmark of Alzheimer's disease and other tauopathies in which tau, a microtubule-associated protein, loses its ability to stabilize microtubules. Several post-translational modifications including phosphorylation and truncation increase tau's propensity to aggregate thus forming NFTs; however, the mechanisms underlying tau conformational change and aggregation still remain to be defined. Caspase activation and subsequent proteolytic cleavage of tau is thought to be a potential trigger of this disease-related pathological conformation. The aim of this work was to investigate the link between caspase activation and a disease-related conformational change of tau in a neuroblastoma cell-based model of spontaneous tau aggregation. We demonstrated that caspase induction initiates proteolytic cleavage of tau and generation of conformationally altered and aggregated tau recognized by the MC1 conformational antibody. Most importantly, these events were shown to be attenuated with caspase inhibitors. This implies that therapeutics aimed at inhibiting caspase-mediated tau cleavage may prove beneficial in slowing cleavage and aggregation, thus potentially halting tau pathology and disease progression.

Keywords: Alzheimer’s disease; caspases; neurodegenerative diseases; protein aggregation; tau proteins; tauopathies.


Figures

Fig.1
Fig.1
Correlation between total tau and conformationally-changed MC1-tau levels. A–C) ELISA assay analyses of cell lysates from N2a cells transiently transfected with increasing amounts of 2N4R tau cDNA or mock transfected controls. Relative amounts of total tau measured in DA9/CP27 ELISA (A), conformationally changed tau measured in MC1/CP27 ELISA (B), and correlation of mean values from the two (C). Linear regression with variable slope analyses were used to calculate relative amounts of total tau and conformationally-changed tau from standard curves made of purified PHFs. A 50μg and 0.625μg of cell lysates were loaded per well for detection of MC1-tau and total tau, respectively. Amounts of total tau and conformationally-changed tau are expressed as mean values for six individual data sets. A.U., arbitrary units. D–F) Fluorescence micrographs of N2a cells immunostained for total tau with CP27 antibody (D), conformationally-changed tau with MC1 antibody (E), nuclear staining and merged MC1 and CP27-stained images (F).
Fig.2
Fig.2
Effects of tau expression on stress-related cellular events. A) Relative amounts of total tau in DA9/CP27 ELISA in lysates from N2a cells transiently transfected with 2N4R tau cDNA for 24 and 48 h. B) Lactate dehydrogenase (LDH) release monitored in medium from N2a cells transiently transfected with 2N4R tau cDNA for 24 and 48 h, and mock transfected controls. C) Results of AlphaScreen assays for D421-caspase cleaved tau and (D, E) phospho-tau corrected to total tau levels in N2a cells expressing 2N4R tau for 24 and 48 h. Linear regression with variable slope analyses were used to calculate relative amounts of total tau from standard curves made of purified PHFs. Relative amounts of D421-caspase cleaved tau were calculated from standard curves made of N2a cell lysates transiently expressing 2N4R tau and treated with staurosporine. Amounts of total tau, D421-tau, pS202 and pS396/pS404 are expressed as mean values of six individual datasets from three independent experiments. Statistical analyses were done using one-way ANOVA with Dunnett’s test or unpaired t test. A.U., arbitrary units.
Fig.3
Fig.3
Induction of caspase activation and cleavage of tau at D421 by treatment of N2a cells with staurosporine. A) N2a cells transiently transfected with 2N4R tau cDNA and treated with 0.0625-1μM staurosporine. Caspase activation was detected using a fluorochrome-conjugated pan-caspase inhibitor (SR-VAD-FMK) in a GUAVA PCA96 flow cytometer. Membrane structural integrity was detected by the cell impermeable dye 7-AAD. Cells with low, moderate or high levels of caspase activation are depicted as filled circles, filled squares and filled triangles respectively. Dead cells with no active caspases present and permeable membranes are depicted as open circles. Each point is the mean value of three independent experiments. B) Induction of caspase-3 and caspase-6 was confirmed in two independent experiments in fluorescence activated cell sorting (FACS). N2a cells transiently transfected with 2N4R tau with or without staurosporine treatment and immunolabeled with active caspase-3 or active caspase-6 antibodies in a total population of 100,000 cells for each group. C) Amounts of D421-caspase cleaved tau corrected to total tau levels measured by ELISA in N2a cells transiently transfected with 2N4R tau cDNA and treated with 0.0625–1μM staurosporine. Linear regression with variable slope analyses was used to calculate relative amounts of total tau from standard curves based on purified PHFs. Relative amounts of D421-caspase cleaved tau were calculated from standard curves derived from N2a cell lysates transiently expressing 2N4R tau and treated with staurosporine. Mean values of six individual datasets from three independent experiments are presented. (D) Fluorescence micrographs of N2a cells transiently transfected with 2N4R tau with or without treatment with 0.158μM staurosporine and immunostained for D421 caspase-cleaved tau.
Fig.4
Fig.4
Dose-dependent increase in levels of conformationally-changed tau after treatment with staurosporine. Levels of total tau and conformationally-changed tau were measured in cell lysates of N2a cells transiently transfected with 2N4R tau cDNA and treated with 0.0625–1μM staurosporine. Relative amounts of total tau in DA9/CP27 ELISA (A), relative amounts of conformationally-changed tau levels measured by MC1/CP27 ELISA (B), levels of conformationally-changed tau corrected for total tau levels C). Linear regression with variable slope analyses were used to calculate relative amounts of total tau and conformationally-changed tau from standard curves derived from purified PHFs. Amounts of total tau and conformationally-changed tau are expressed as mean values of six individual data sets relative to non-treated controls set to unity. Statistical analyses for the relative amounts of conformationally-changed tau using one-way ANOVA with Dunnett’s test confirmed significant differences between the values obtained for 0.25 (p < 0.5), 0.5 (p < 0.001), and 1 (p < 0.001) μM staurosporine when compared to untreated controls. A.U., arbitrary units. D) Fluorescence micrographs of N2a cells immunostained for total tau with CP27 antibody, conformationally-changed tau with MC1 antibody, and merged with nuclear stained images.
Fig.5
Fig.5
Time-course of caspase activation and induction of conformationally-changed tau after treatment of N2a cells with staurosporine. Caspase activation in N2a cells transiently transfected with the 2N4R tau cDNA alone (A) and treated with 1μM staurosporine (D). Samples were collected at time zero, 6 h, 12 h, and 24 h. Caspase activation was detected using a fluorochrome-conjugated pan-caspase inhibitor (SR-VAD-FMK) in a GUAVA PCA96 flow cytometer. Membrane structural integrity was detected by the cell impermeable dye 7-AAD. Cells with low, moderate, or high levels of caspase activation correspond to filled circles, filled squares, and filled triangles, respectively. Dead cells with no active caspases present and permeable membranes are marked as open circles (A, D). Relative amounts of total tau in DA9/CP27 ELISA in control lysates (B) and after treatment with 1μM staurosporine (E). Relative amounts of conformationally-changed tau levels measured by MC1/CP27 ELISA in control lysates (C) and after treatment with 1μM staurosporine (F). Linear regression with variable slope analyses was used to calculate relative amounts of total tau and conformationally-changed tau from standard curves obtained from purified PHFs. Each point represents the mean value of six independent samples. A.U., arbitrary units.
Fig.6
Fig.6
Fractionation of tau in N2a cell lysates after treatment with staurosporine. A) Lysates from N2a cells transiently transfected with 2N4R tau cDNA and treated with 0.03125-1μM staurosporine subjected to low speed centrifugation (2600× g) followed by a high speed centrifugation (100,000× g) in the presence of Nonidet P40, as described in Materials and Methods. The low speed (LS), soluble (S1), and pelleted (P1) fractions after the high speed centrifugation step were resolved by SDS-PAGE. Total tau was detected by western blot with DA9 antibody. B) Absorbance signals in DA9/CP27 and MC1/CP27 ELISA formats for total tau and aggregated MC1-tau, respectively, for low-speed (LS), soluble (S1), and pelleted (P1) fractions of N2a cell lysates after treatment with 0.5μM staurosporine. C) Fluorescence micrographs of N2a cells transfected with 2N4R tau cDNA, treated with 0.25–0.5μM staurosporine and immunostained for total tau with CP27 antibody, aggresome detection reagent and merged with nuclear stained images. Accumulation of tau in aggresomes indicated by arrows.
Fig.7
Fig.7
Timing of proteolytic processing of tau and its aggregation, and the effect of caspase inhibitors on tau integrity and D421-cleavage. A, B) Combined time-course and staurosporine dose-response in N2a cells transiently expressing 2N4R tau. The cells were treated with 0-1μM staurosporine for 6, 12, or 24 h marked in black, grey, and white, respectively. Relative levels of D421-tau (A) and MC1-tau (B) corrected to total tau were measured in ELISA assays. C) N2a cells transiently expressing 2N4R tau were treated with staurosporine (0.125, 0.25, and 0.5μM) or staurosporine and pan-caspase inhibitor Z-VAD(Ome)-FMK (50μM) for either 6 or 24 h. Controls with no treatment are shown as NT. Cell lysates were resolved in SDS-PAGE and tau protein was detected by western blot with DA9 antibody. Data represent three independent experiments. Results of AlphaScreen assays for total tau (D) and D421-caspase cleaved tau corrected to total tau levels (E) in N2a cells transiently transfected with 2N4R tau and treated with 0.158μM and 0.5μM staurosporine (STS) or staurosporine and 50μM of pan-caspase inhibitor (ApoBlock) for 24 h. Untreated controls are shown as NT. Linear regression with variable slope analyses were used to calculate relative amounts of total tau and D421-caspase cleaved tau for A, B, D, and E from standard curves based on N2a cell lysates transiently expressing 2N4R tau and treated with STS. Relative amounts of D421-caspase cleaved tau were corrected to total tau. Amounts of total tau and D421-cleaved tau are expressed as mean values for five individual data sets relative to untreated controls set to unity. Statistical analyses for the relative amounts of total tau and Asp421-tau using one-way ANOVA with multiple comparisons. A.U., arbitrary units.
Fig.8
Fig.8
Protective effect of pan-caspase inhibitor on aggregation of tau. N2a cells were transiently transfected with 2N4R tau and treated with 0.5μM staurosporine (STS) or staurosporine and 50μM pan-caspase inhibitor (ApoBlock) for 24 h. Untreated controls are shown as NT. Cell lysates were analyzed in ELISA for total tau (A) and conformationally-changed MC1-tau (B). Linear regression with variable slope analyses were used to calculate relative amounts of total tau and conformationally-changed tau from standard curves based on purified PHFs. Relative amounts of conformationally-changed were corrected for total tau. Amounts of total tau and conformationally-changed tau are expressed as mean values of six individual datasets relative to untreated controls set to unity. Statistical analyses for the relative amounts of total tau and D421-tau using one-way ANOVA with multiple comparisons. A.U. arbitrary units.

References

    1. Selkoe DJ (1986) Altered structural proteins in plaques and tangles: What do they tell us about the biology of Alzheimer’s disease? Neurobiol Aging 7, 4225–4232. - PubMed
    1. Yagishita S, Itoh Y, Nan W, Amano N (1981) Reappraisal of the fine structure of Alzheimer’s neurofibrillary tangles. Acta Neuropathol 54, 239–246. - PubMed
    1. Ihara Y, Nukina N, Miura R, Ogawara M (1986) Phosphorylated tau protein is integrated into paired helical filaments in Alzheimer’s disease. J Biochem 99, 1807–1810. - PubMed
    1. Cleveland DW, Hwo SY, Kirschner MW (1977) Physical and chemical properties of purified tau factor and the role of tau in microtubule assembly. J Mol Biol 116, 227–247. - PubMed
    1. Avila J, Lucas JJ, Perez M, Hernandez F (2004) Role of tau protein in both physiological and pathological conditions. Physiol Rev 84, 361–384. - PubMed

MeSH terms