Comparative Study
. 2017 Jan:35:434-445.
doi: 10.1016/j.media.2016.08.006. Epub 2016 Aug 24.

Optimal slice timing correction and its interaction with fMRI parameters and artifacts

Affiliations
Comparative Study

Optimal slice timing correction and its interaction with fMRI parameters and artifacts

David Parker et al. Med Image Anal. 2017 Jan.

Abstract

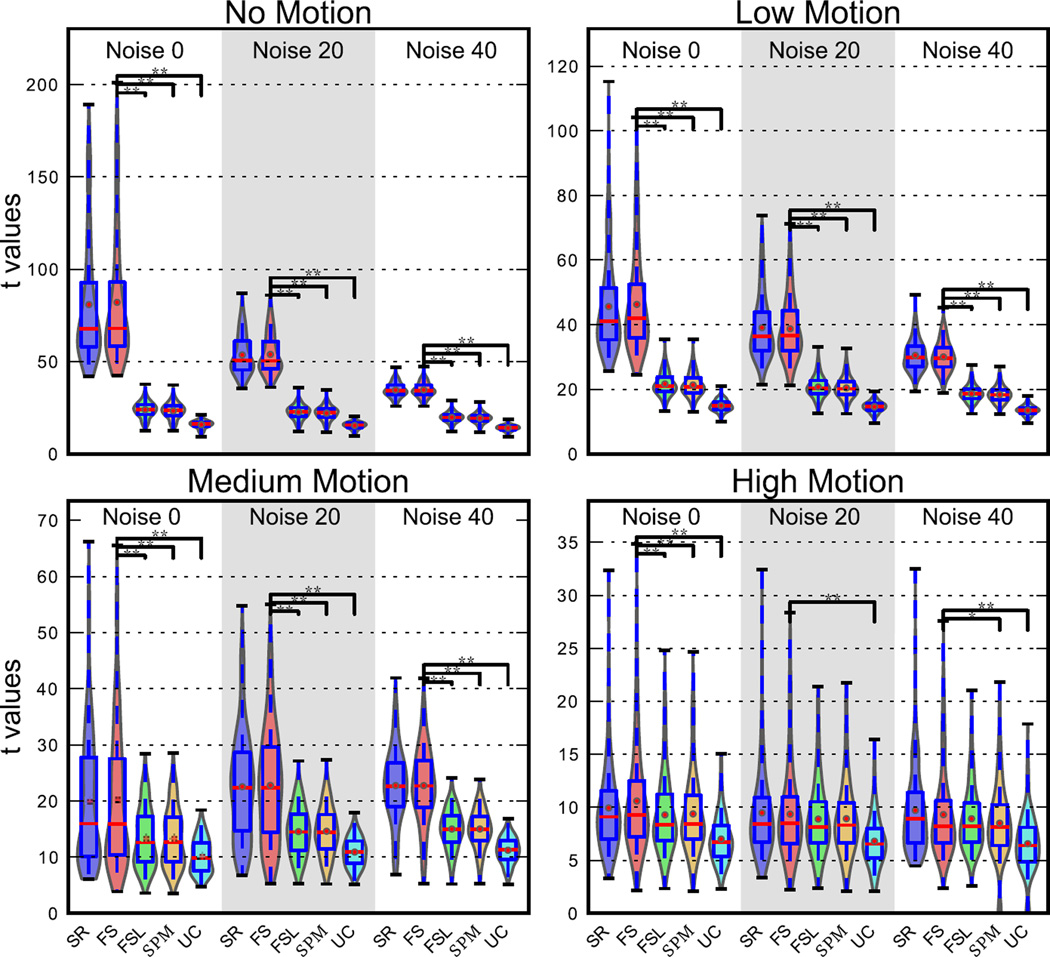
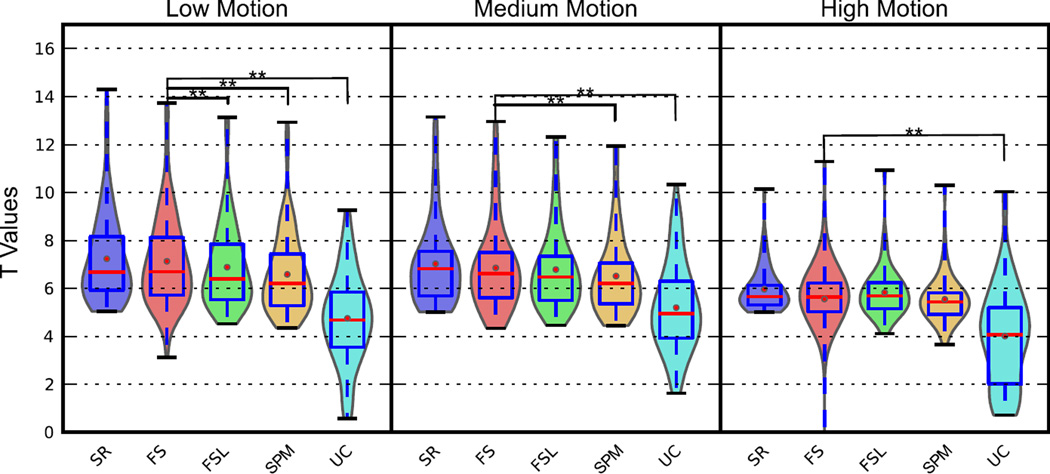
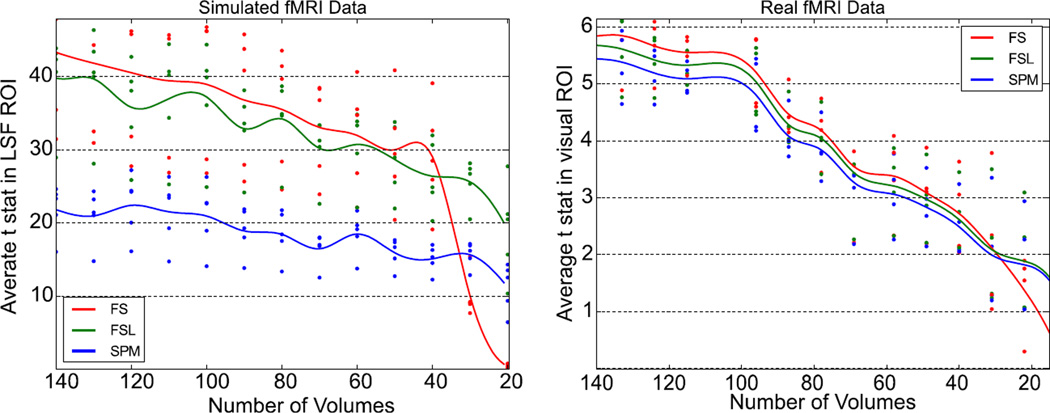
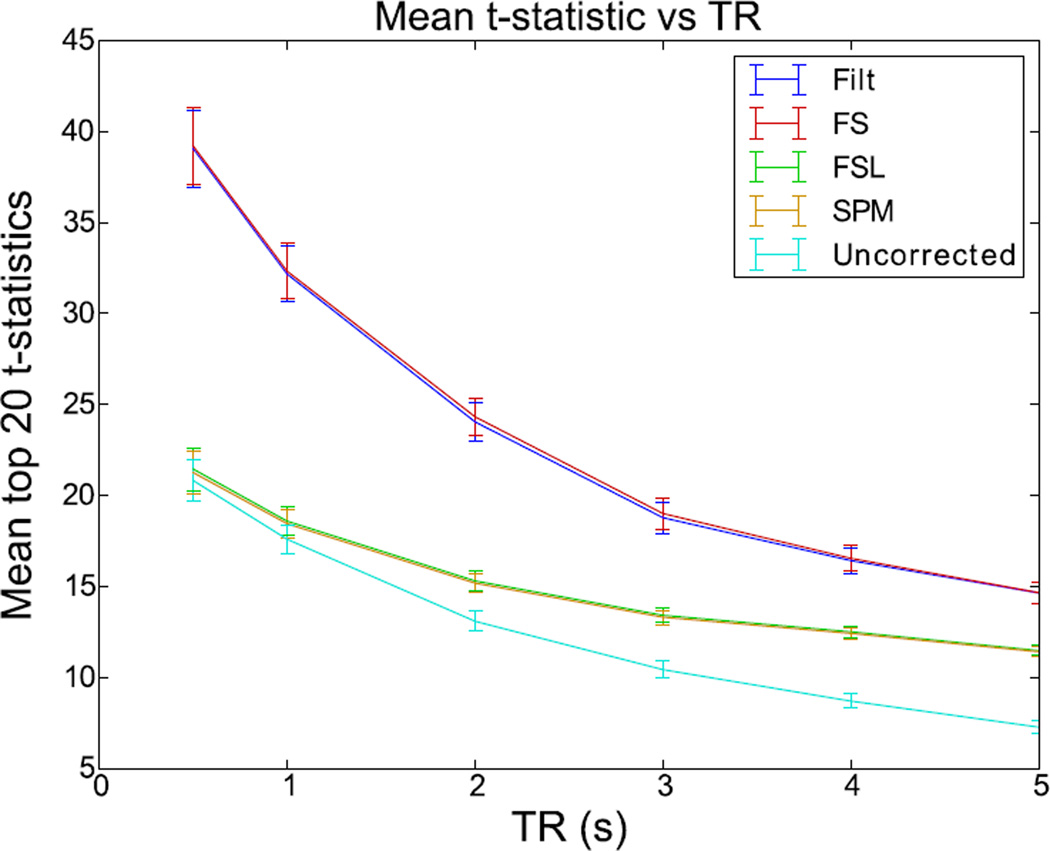
Due to the nature of fMRI acquisition protocols, slices in the plane of acquisition are not acquired simultaneously or sequentially, and therefore are temporally misaligned with each other. Slice timing correction (STC) is a critical preprocessing step that corrects for this temporal misalignment. Interpolation-based STC is implemented in all major fMRI processing software packages. To date, little effort has gone towards assessing the optimal method of STC. Delineating the benefits of STC can be challenging because of its slice-dependent gain as well as its interaction with other fMRI artifacts. In this study, we propose a new optimal method (Filter-Shift) based on the fundamental properties of sampling theory in digital signal processing. We then evaluate our method by comparing it to two other methods of STC from the most popular statistical software packages, SPM and FSL. STC methods were evaluated using 338 simulated and 30 real fMRI data and demonstrate the effectiveness of STC in general as well as the superiority of the proposed method in comparison to existing ones. All methods were evaluated under various scan conditions such as motion level, interleave sequence, scanner sampling rate, and the duration of the scan itself.

Keywords: EPI; Interleaved acquisition; Interpolation; Slice timing correction; fMRI.


Figures

Figure 1
Figure 1. The slice-timing problem: the same signal sampled at different offsets yields signals that do not look the same
(A) Five adjacent slices acquired with interleaved acquisition all sample the same underlying bold signal. (B) Without correction, reconstruction yields five different signals despite having the same underlying shape.
Figure 2
Figure 2. Time and frequency domain plots of kernels for sinc, Hanning window sinc and Kaiser window sinc
A) The time domain representation of various kernels and B) the frequency domain of these kernels. It is easy to see from this the impact various kernel will have on a signal’s frequency spectrum. Inset: An example of using a window function to facilitate a smoothly terminating sinc function. The purple dashed line is a sinc function multiplied with a Kaiser window, which greatly reduces rippling in the both the frequency and time domain. A non-windowed sinc (gold) ends abruptly, which causes rippling in the frequency domain. The green line is truncated at 10s, so it does not exist in the inset window.
Figure 3
Figure 3. A visual description of the Filter Shift STC method showing high frequency simulated data, the effect of down-sampling at various offsets, and how the original signal can be reconstructed with upsampling and low pass filtering regardless of offset
(A) An underlying bold signal is contaminated with physiological noise and sampled at 0.5Hz with different offsets. (B) Each offset yields visually different low-frequency signals. (C & D) These signals are upsampled and LPF to remove noise. The result is a shifted version of the original bold signal. (E) By resampling the high frequency with the same offset results in identical low frequency signals.
Figure 4
Figure 4. Difference in t values between STC and uncorrected data on two adjacent slices with different acquisition delays in real data
The benefit of STC varies from slice to slice, depending on the acquisition delay. A) Two adjacent slices exhibit very different STC results. Slice 18 (1.8s delay) has t values significantly larger than those in uncorrected data with differences as large as 3. Slice 19 (0.15s delay) has very few differences from uncorrected data. Note that because this is a difference map, this simply indicates that all methods, including uncorrected, perform similarly well on low-delay slices. B) A 3D visualization of the difference between t values in the FS STC data and uncorrected data. The stripes along the z axis are present at high acquisition delay slices in data collected with Phillips interleave 6 (top), and even-odd.
Figure 5
Figure 5. voxel-wise t statistic comparison from STC data and uncorrected data in the LSF ROI in simulated data for various noise and motion levels with interleave 6
STC was carried out with three methods: FSL, SPM, and FS. The analysis was carried out for high, medium, and low motion cases, as well as three different SNR conditions (Noise 20 indicates that 20% of the signal’s energy is from white noise, and so on). Each violin plot contains values from 20 scans. Higher values indicate that a STC method had higher z scores than data that was analyzed with no STC. Two stars indicate that these z differences are also significantly different from our method (FS), t<0.001, one star indicates significance p<0.05.
Figure 6
Figure 6. Voxel-wise t statistic from STC data and uncorrected data in the visual ROI in real data for various motion levels with interleave 6
The top 20 voxels from the Shifted-Regressor method were identified from the slice with high delay (Slice 17) that intersected the region of significant activation. The values from these voxels were then extracted from all other STC methods for comparison. (30 subjects’ real data with three levels of motion.) Methods that are significantly different than the proposed method (p < 0.001) are indicated with a star, pair-wise t-test.
Figure 7
Figure 7. Performance of STC methods compared to the length of the initial fMRI time series on simulated and real data
(Left) Simulated data: top 20 t statistics vs length of scan by method for five subjects, extracted from the slice with maximum delay (slice 17) in the region with significant activation. Divergence between our STC method and controls occurs at ~ 38 volumes. (Right) Real data: top 20 t stats vs length of scan by method for five subjects. Divergence occurs at ~ 27 volumes
Figure 8
Figure 8. Effect of increasing TR on the STC gain on simulated data
T values from LSF region in simulated data with TRs varying from 0.5 to 5 seconds extracted from a slice with maximal delay (slice 18). Error bars represent the 95% confidence interval, calculated from the extracted t values for each method across all 13 subjects.

References

    1. Bannister PR, Michael Brady J, Jenkinson M. Integrating temporal information with a non-rigid method of motion correction for functional magnetic resonance images. Image Vis. Comput. 2007;25:311–320.
    1. Beall EB, Lowe MJ. SimPACE: Generating simulated motion corrupted BOLD data with synthetic-navigated acquisition for the development and evaluation of SLOMOCO: A new, highly effective slicewise motion correction. NeuroImage. 2014;101:21–34. - PMC - PubMed
    1. Beckmann CF, Jenkinson M, Smith SM. General multilevel linear modeling for group analysis in FMRI. NeuroImage. 2003;20:1052–1063. - PubMed
    1. Calhoun V, Golay Pearlson G. Improved fMRI slice timing correction: interpolation errors and wrap around effects; Proc. ISMRM 9th Annu. Meet. Denver; 2000. p. 810.
    1. Fischl B, Salat DH, Busa E, Albert M, Dieterich M, Haselgrove C, van der Kouwe A, Killiany R, Kennedy D, Klaveness S, Montillo A, Makris N, Rosen B, Dale AM. Whole Brain Segmentation: Automated Labeling of Neuroanatomical Structures in the Human Brain. Neuron. 2002;33:341–355. - PubMed