Review
. 2016 Oct;39(10):680-693.
doi: 10.1016/j.tins.2016.08.001. Epub 2016 Aug 30.

Thalamic Inhibition: Diverse Sources, Diverse Scales

Affiliations
Review

Thalamic Inhibition: Diverse Sources, Diverse Scales

Michael M Halassa et al. Trends Neurosci. 2016 Oct.

Abstract

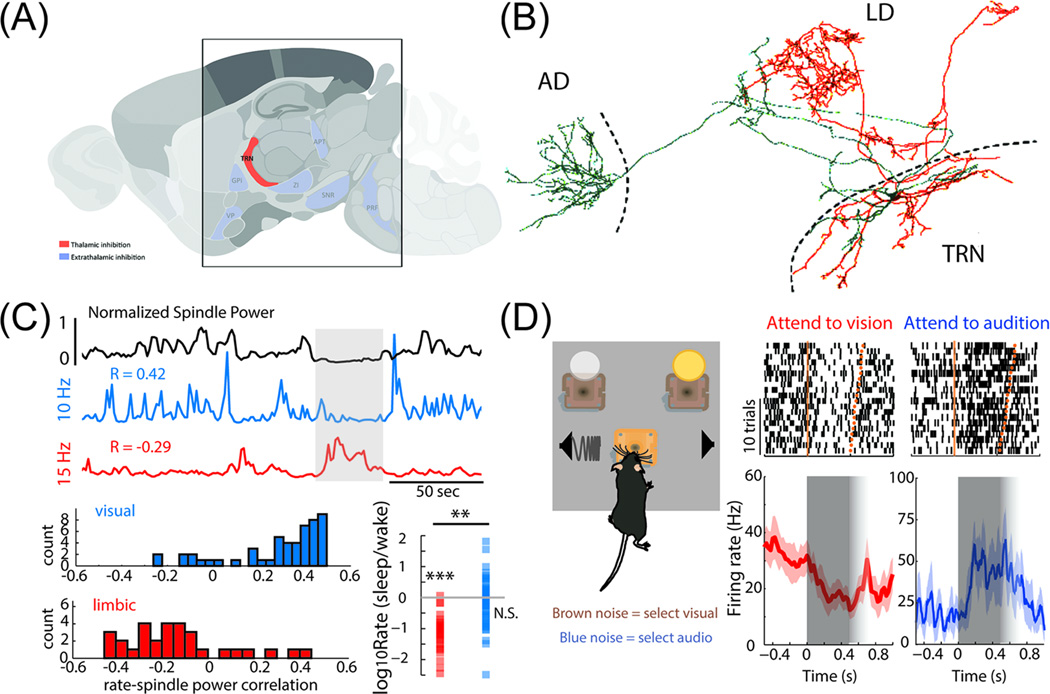
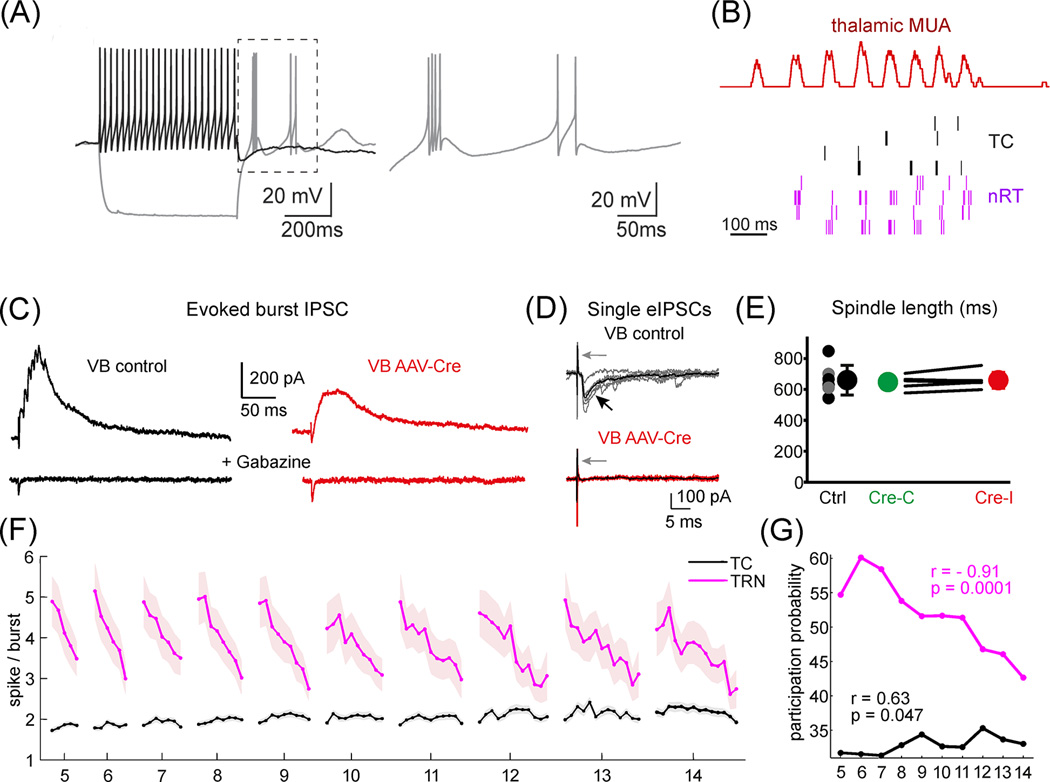
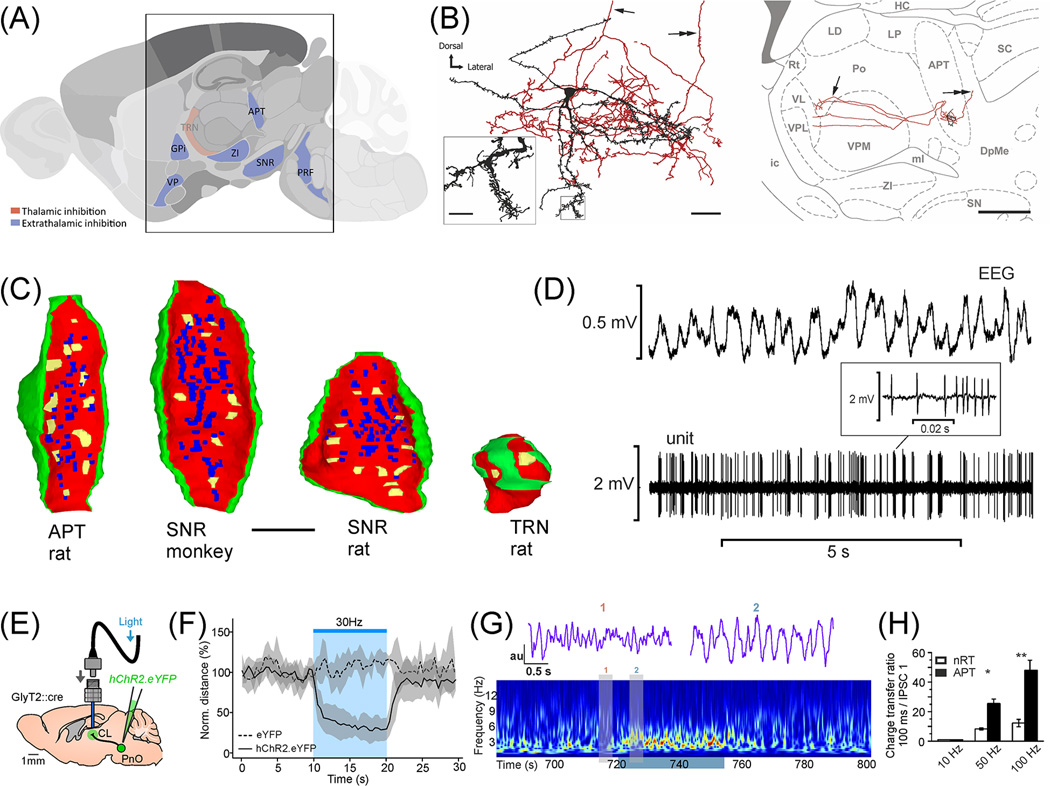
The thalamus is the major source of cortical inputs shaping sensation, action, and cognition. Thalamic circuits are targeted by two major inhibitory systems: the thalamic reticular nucleus (TRN) and extrathalamic inhibitory (ETI) inputs. A unifying framework of how these systems operate is currently lacking. Here, we propose that TRN circuits are specialized to exert thalamic control at different spatiotemporal scales. Local inhibition of thalamic spike rates prevails during attentional selection, whereas global inhibition more likely prevails during sleep. In contrast, the ETI (arising from basal ganglia, zona incerta (ZI), anterior pretectum, and pontine reticular formation) provides temporally precise and focal inhibition, impacting spike timing. Together, these inhibitory systems allow graded control of thalamic output, enabling thalamocortical operations to dynamically match ongoing behavioral demands.

Keywords: GABA; basal ganglia; reticular thalamic nucleus; thalamocortical.


Figures

Figure 1
Figure 1
Heterogeneity, subnetworks and gating by TRN. A. Parasagittal section of the mouse brain, highlighting TRN in blue. B. Juxtacellular filling of two neighboring TRN neurons in the rat (red and green). Although the cell bodies are in close proximity, each neuron projects to a distinct thalamic target (AD; anteriodorsal thalamus associated with mnemonic processing and LD; laterodorsal associated with sensory processing). C. TRN neurons display distinct physiological phenotypes. In relation to spindle power, one TRN neuron (blue trace) shows positive whereas the other (red) negative firing rate correlation. Subsequent optogenetic tagging showed that these physiological phenotypes map onto anatomical projections. Consistent with this notion, several visual TRN neurons show enhanced firing rate in sleep compared to wake, while limbic neurons are exclusively suppressed during sleep (bottom right in C). D. Cross-modal divided attention in the mouse shows TRN recruitment by attentional allocation. Example raster plot and corresponding peristimulus time histograms of two visual TRN neurons when the animal is instructed to attend to vision (red) or audition (blue). Grey shading depicts TRN activity during the stimulus anticipation period following the presentation of the instruction signal. Note that visual TRN activity is reduced during visual trials but augmented during auditory trials, resulting in a corresponding decreased and increased inhibitory output to visual thalamic cells. This is consistent with a gating role of TRN during selective attention to a given modality and focal subnetwork specific TRN action Figure B is based on [24] C on [25], D on [26]
Figure 2
Figure 2
Heterogeneous scales of action by TRN. A) Tonic (black) and burst (gray) response of a TRN neuron to depolarizing and hyperpolarizing current step, respectively. B) Rhythmic burst activity of interconnected TC (black) and TRN (purple) cells during sleep spindles in freely sleeping animals. C) TRN bursts generate large, slow burst IPSC in TC cells in control condition in vitro (VB control, black). Substantial amount of this burst IPSC persists after the total removal synaptic GABA-A receptors (VB AAV-Cre, red) indicating that a significant portion of the inhibitory charge is carried via extrasynaptic receptors. D) However, during single spike TRN activity only synaptic receptors are activated resulting in an order of magnitude faster response. This indicates that changes in firing pattern alter the temporal scale of TRN action D) In the absence of synaptic inhibition, phasic extrasynaptic burst IPSCs is sufficient to pace normal spindle oscillations E) Cycle-by-cycle decrease in the number of spikes/TRN bursts during sleep spindles with variable duration (5–14 cycles). Change from burst to tonic IPSCs alter the temporal scale of action, resulting in a drop in the inhibitory which leads to termination of spindles F) Participation probability of TRN cells (purple) in the first cycle of the sleep spindles display a strong correlation with spindle length. This indicates that the duration of spindles is determined at the onset by the state of the network and this state is coded best by the activity level of TRN cells. Figures B,F,G from [51], C–E from [46]
Figure 3
Figure 3
Extrathalamic inhibition in the thalamus A) Parasagittal section of the brain highlighting the position of ETI nuclei (blue) around the thalamus. B) An ETI neuron in the APT. The cell have spiny dendrites, profuse local axon collaterals (left) and two ascending main axons ramifying in n.posterior of the thalamus (arrow, right). The cell also display a descending main axon (double arrow). C) Comparison of ETI and TRN terminals on the same scale. 3D reconstructions from serial electron microscopic sections. Yellow, active zones; blue, puncta adhaerentia; red, membrane of the terminal; green, glia. All active zones of ETI terminals converge on the same TC cell. Almost all TRN terminals have a single active zone per target. If they form two (arrows on the right) synapses they are separated by glia and innervate different dendrites. Note the similarity of ETI terminals among structures and taxa D) Firing activity of an APT cell in vivo with concurrent EEG recording. Note high frequency action potential clusters (inset). E–G) Activation of ETI terminals originating from PRF in the intralaminar nucleus leads to the disruption of all ongoing behavior and global alteration of the EEG activity. E) Experimental arrangement. F) Normalized travelled distance, before, during and after the stimulation. G) Wavelet spectrum of the cortical LFP. Warm color depicts higher power. Grey bars indicate the time of raw cortical LFP shown above. H) Difference in charge transfer during high frequency stimulation between ETI (APT) and TRN terminals. ETI transmission is stable at high presynaptic firing rates as well. Figures B, D from [13], C from [15,14], E–G from [16] and H from [15].

References

    1. Goldberg JH, et al. Basal ganglia output to the thalamus: still a paradox. Trends Neurosci. 2013;36:695–705. - PMC - PubMed
    1. Ketz NA, et al. Thalamic pathways underlying prefrontal cortex-medial temporal lobe oscillatory interactions. Trends Neurosci. 2015;38:3–12. - PubMed
    1. Schiff ND, et al. Behavioural improvements with thalamic stimulation after severe traumatic brain injury. Nature. 2007;448:600–603. - PubMed
    1. Hirsch JA, et al. How inhibitory circuits in the thalamus serve vision. Annu. Rev. Neurosci. 2015;38:309–329. - PubMed
    1. Lorincz ML, et al. Temporal framing of thalamic relay-mode firing by phasic inhibition during the alpha rhythm. Neuron. 2009;63:683–696. - PMC - PubMed