. 2016 Sep 20;45(3):641-655.
doi: 10.1016/j.immuni.2016.08.008. Epub 2016 Aug 30.

Normalizing Microbiota-Induced Retinoic Acid Deficiency Stimulates Protective CD8(+) T Cell-Mediated Immunity in Colorectal Cancer

Affiliations

Normalizing Microbiota-Induced Retinoic Acid Deficiency Stimulates Protective CD8(+) T Cell-Mediated Immunity in Colorectal Cancer

Nupur Bhattacharya et al. Immunity. .

Abstract

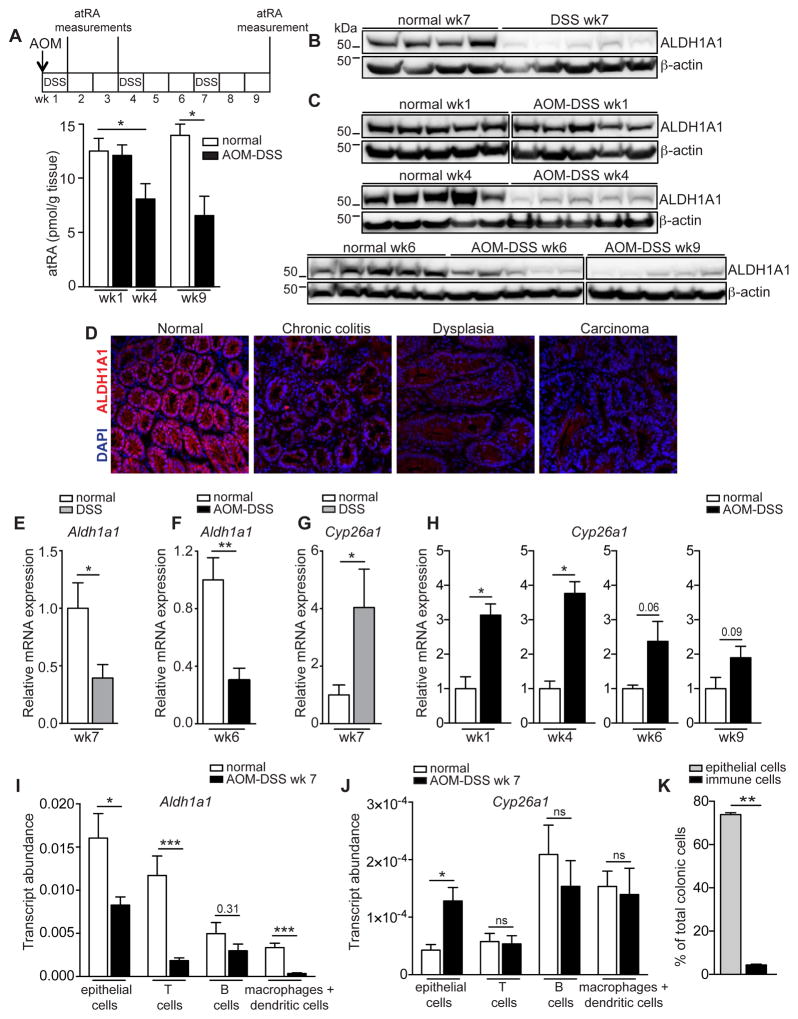
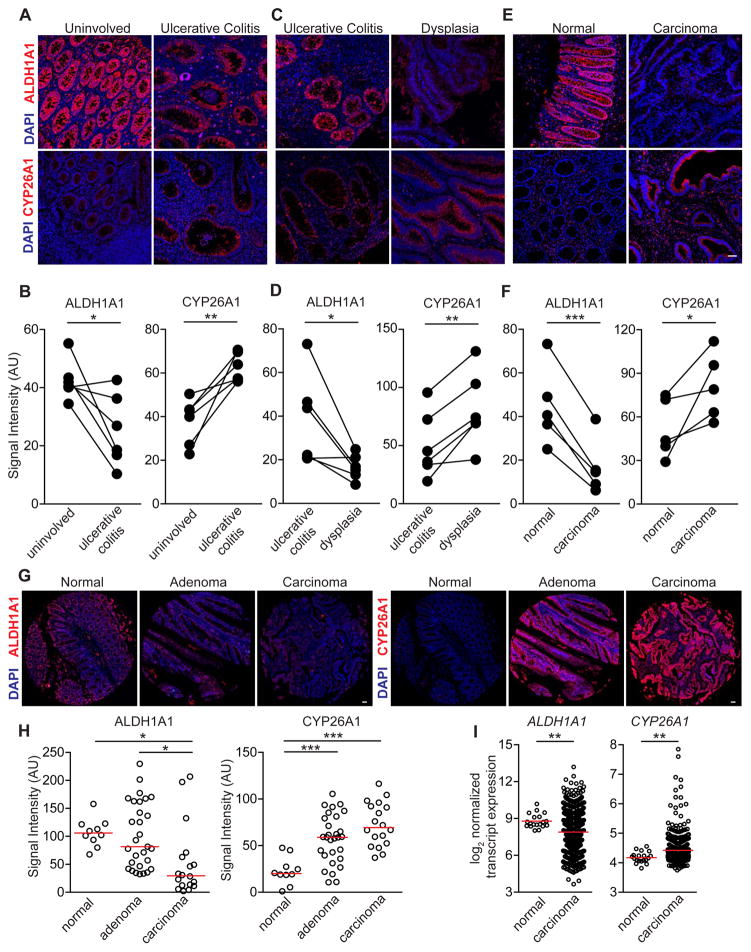
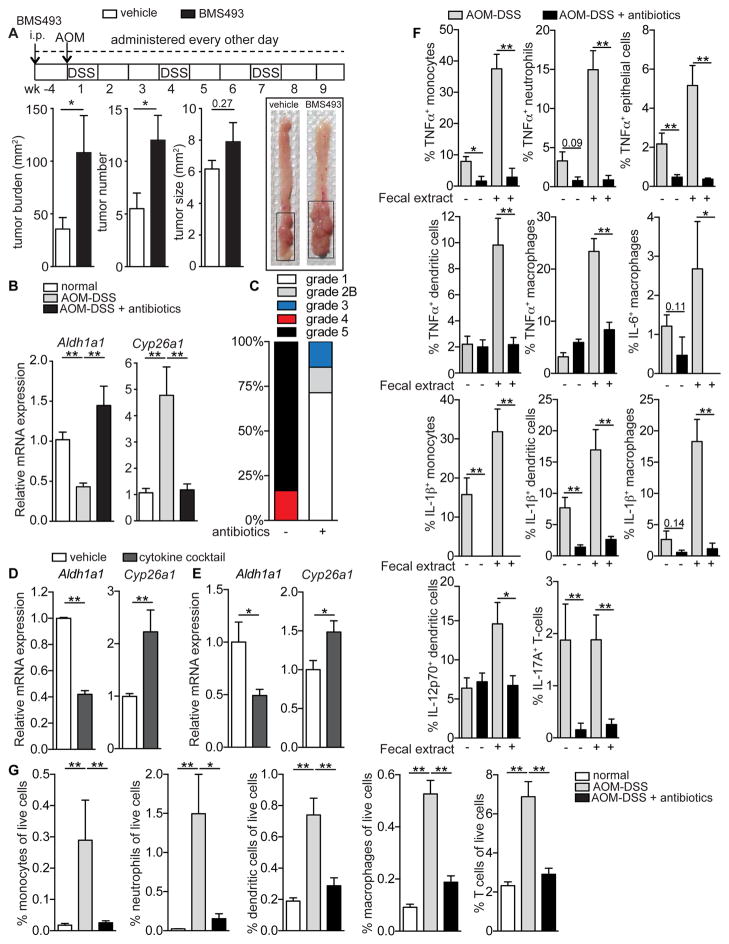
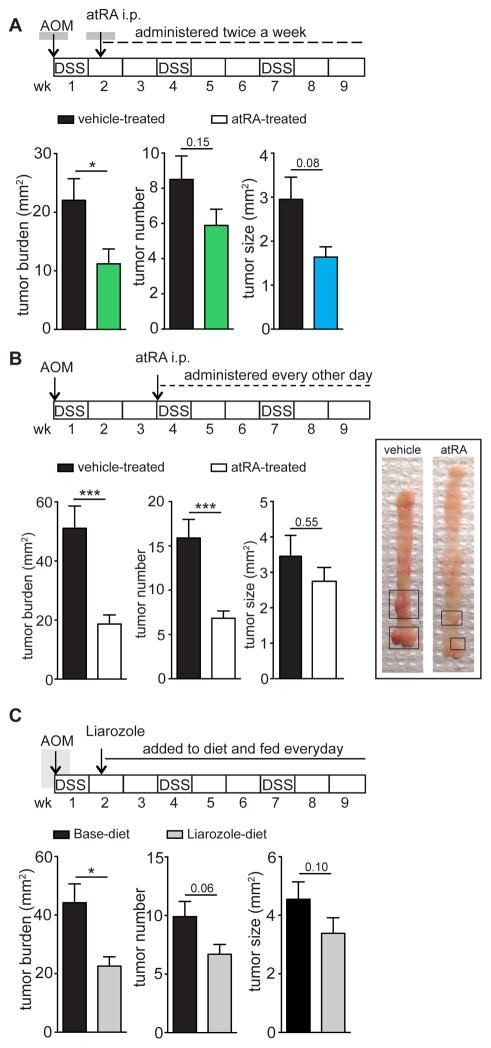
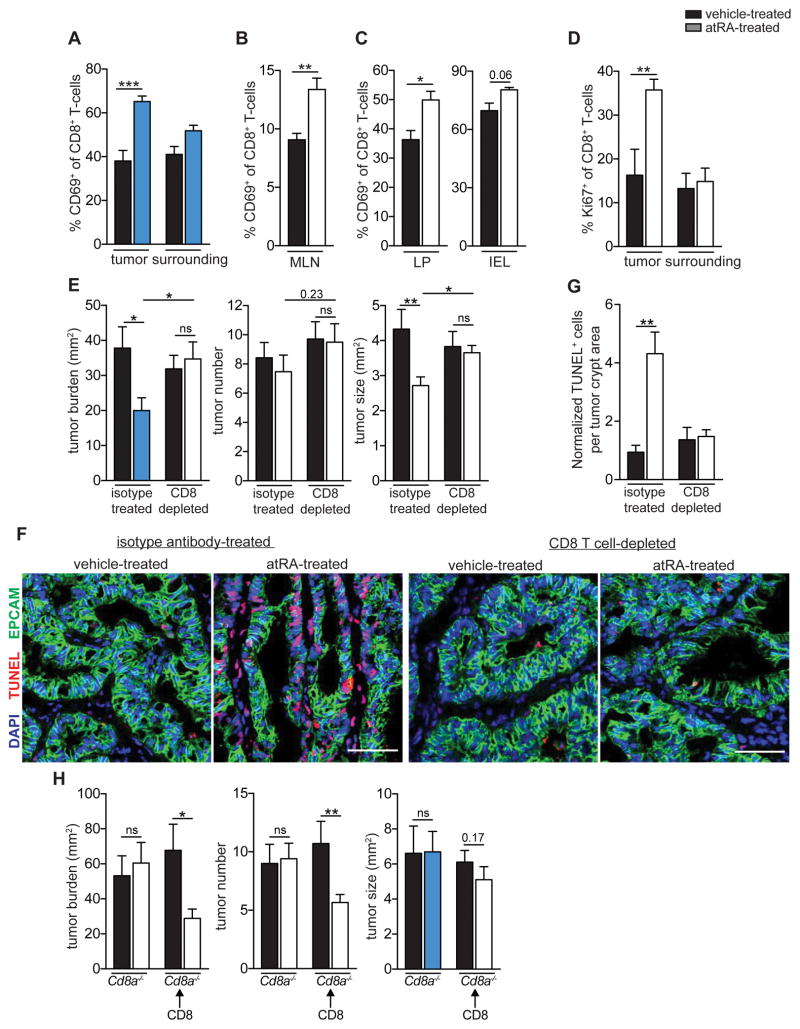
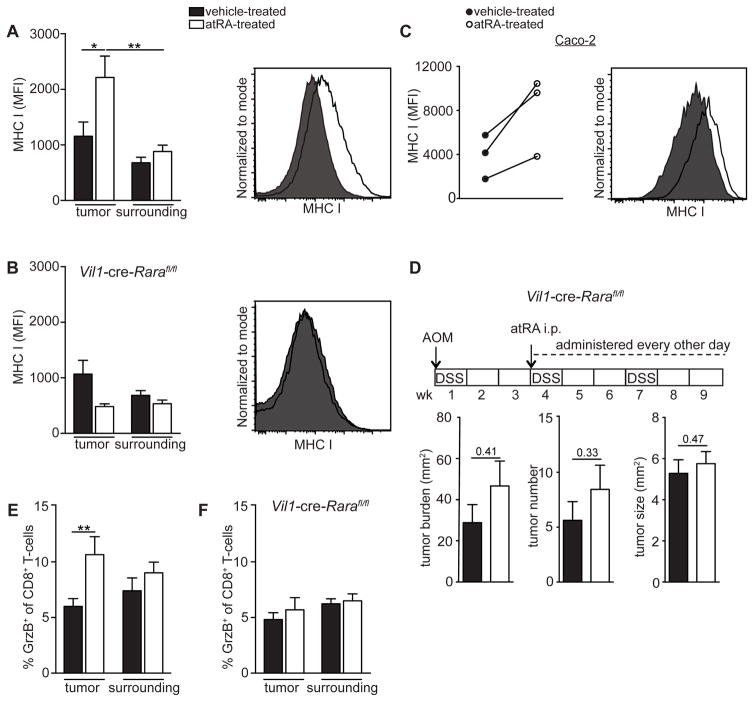
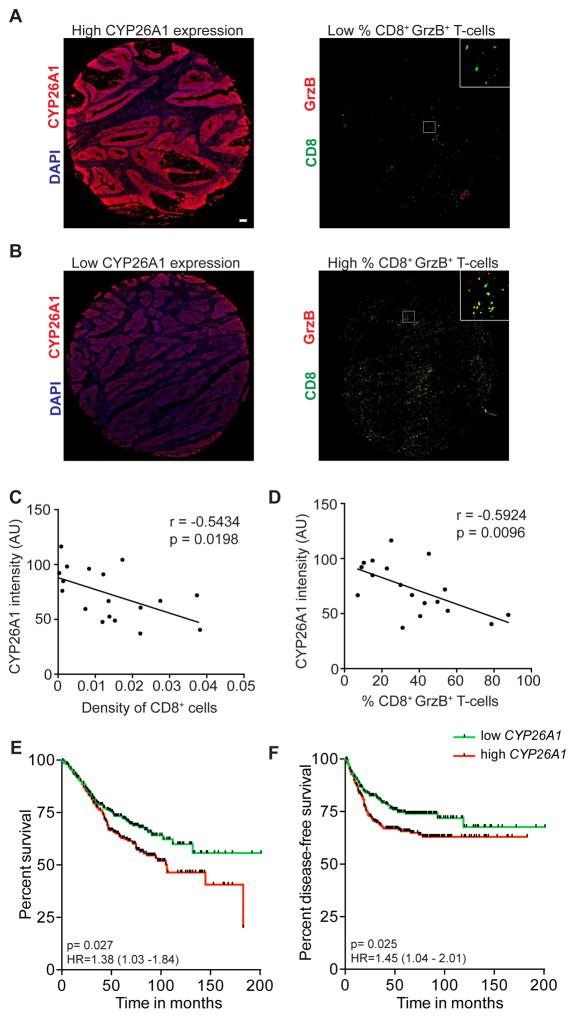
Although all-trans-retinoic acid (atRA) is a key regulator of intestinal immunity, its role in colorectal cancer (CRC) is unknown. We found that mice with colitis-associated CRC had a marked deficiency in colonic atRA due to alterations in atRA metabolism mediated by microbiota-induced intestinal inflammation. Human ulcerative colitis (UC), UC-associated CRC, and sporadic CRC specimens have similar alterations in atRA metabolic enzymes, consistent with reduced colonic atRA. Inhibition of atRA signaling promoted tumorigenesis, whereas atRA supplementation reduced tumor burden. The benefit of atRA treatment was mediated by cytotoxic CD8(+) T cells, which were activated due to MHCI upregulation on tumor cells. Consistent with these findings, increased colonic expression of the atRA-catabolizing enzyme, CYP26A1, correlated with reduced frequencies of tumoral cytotoxic CD8(+) T cells and with worse disease prognosis in human CRC. These results reveal a mechanism by which microbiota drive colon carcinogenesis and highlight atRA metabolism as a therapeutic target for CRC.


Figures

Figure 1
Figure 1. AOM-DSS mice have a deficiency in colonic atRA that can be attributed to alterations in atRA metabolism
(A) Mass spectrometry measurements of colonic atRA concentrations in AOM-DSS mice throughout disease progression compared to normal age-matched mice (n=3–5 mice per group). (B,C) Immunoblots for ALDH1A1 in distal colonic lysates of mice with chronic colitis (DSS wk7) (B), and of AOM-DSS mice at different time points throughout disease progression (C), compared to normal age-matched mice (n=5 mice per group). Representative of 2 independent experiments. Cropped immunoblots were taken from different parts of the same gel and are indicated by demarcation lines. (D) Immunofluorescence staining of ALDH1A1 (red) in colonic tissue sections throughout disease progression, from steady state to colitis (DSS-treated), dysplasia and carcinoma. Scale bar=50 μm. (n=5 mice per group). (E–H) qRT-PCR measurements of Aldh1a1 (E,F) and Cyp26a1 (G,H), relative to Gapdh, in distal colons of mice treated with DSS (E,G) or AOM-DSS (F,H) compared to normal age-matched mice (n=4–5 mice per group). Representative of 3 independent experiments. (I, J) qRT-PCR measurements of Aldh1a1 (I) and Cyp26a1 (J), relative to Gapdh, in different cell types sorted from AOM-DSS and normal age-matched mice (n=5 mice per group). (K) Flow cytometry data showing the frequencies of different cell types in distal colons of AOM-DSS mice (n=5 mice per group). Results are represented as mean ± SEM. p<0.05=*; p<0.01=**; p<0.001=***, Mann Whitney U-test. See also Figure S1.
Figure 2
Figure 2. Human UC, UC-associated dysplasia and sporadic colon adenocarcinoma exhibit abnormal expression of colonic atRA metabolizing enzymes
(A,C,E,G) Representative immunofluorescence images of ALDH1A1 and CYP26A1 (red) on matched human UC and uninvolved colonic resections (n=6 samples) (A), matched human UC and dysplastic colonic resections (n=6 samples) (C), matched adenocarcinoma and normal colonic resections (n=5 samples) (Scale bar=50 μm) (E), and on a sporadic adenoma and carcinoma tissue microarray (G) (Scale bar=1 mm). (B,D,F,H) Average staining intensity values (in arbitrary units (AU)) of ALDH1A1 and CYP26A1 in the colonic epithelium, acquired from a minimum of 3 image fields, of all samples in (A,C,E,G). (I) Transcript expression of ALDH1A1 and CYP26A1 from the gene expression microarray dataset GSE39582. Paired-t-test (B,D,F) and one-way ANOVA test (H), p<0.05=*; p<0.01=**; p<0.001=***.
Figure 3
Figure 3. Inflammation triggered by intestinal microbiota induces atRA enzyme alteration in AOM-DSS mice
(A) Tumor analyses in AOM-DSS mice treated with the pan-retinoic acid receptor inhibitor (BMS493) compared to vehicle-treated mice. Also shown are representative images of the colons. Data are pooled from 2 independent experiments (n=7–8 mice). (B) qRT-PCR measurements of Aldh1a1 and Cyp26a1, normalized to Gapdh, in the distal colons of normal age-matched mice and untreated or antibiotic-treated AOM-DSS mice (n=5–6 mice per group). Representative of 2 independent experiments. (C) Colitis score grading of antibiotic-treated or untreated AOM-DSS mice (n=5 mice per group). (D) qRT-PCR measurements of Aldh1a1 and Cyp26a1 from intestinal organoids cultured in vitro with a proinflammatory cytokine mixture compared to vehicle. Data are pooled from 3 independent experiments. (E) qRT-PCR measurements of Aldh1a1 and Cyp26a1 from distal colons of antibiotic-treated mice injected intramucosally with a proinflammatory cytokine mixture or vehicle (n=8–10 mice per group). (F) Flow cytometry data showing the percentage of specific cell populations from the distal colons of untreated or antibiotic-treated AOM-DSS mice expressing different cytokines induced via stimulation with fecal extract (n=5 mice per group). (G) Quantitation of the frequency of different immune cells in the distal colons of normal age-matched mice and untreated or antibiotic-treated AOM-DSS mice (n=5 mice per group). Results are represented as mean ± SEM. p<0.05=*; p<0.01=**; p<0.001=***, Mann Whitney U-test. See also Figure S2.
Figure 4
Figure 4. atRA supplementation decreases tumor burden in AOM-DSS mice
(A,B) Graphs represent tumor analyses in AOM-DSS mice treated with 200μg atRA twice a week starting from day 10 (A) or every other day from week 4 (B) after disease induction compared to vehicle-treated mice. Representative image of mouse colons from (B). Data represent pooled data from 2 independent experiments with n=10 mice per group in (A) and n=9–13 mice in (B). (C) Tumor analyses in AOM-DSS mice fed with a diet containing Liarozole compared to a control base diet from day 10 after disease induction. Representative of 3 independent experiments (n=10 mice per group). Results are represented as mean ± SEM with p<0.05=*; p<0.01=**; p<0.001=***, Mann Whitney U-test. See also Figure S3.
Figure 5
Figure 5. atRA reduces tumor burden in AOM-DSS mice through a CD8+ T-cell-dependent mechanism
(A–D) Flow cytometry data of percentages of CD69+ CD8+ T-cells (A,B,C) and Ki67+ CD8+ T-cells (D) in tumors (A,D), surrounding distal colonic tissue (A,D), IEL and LP layers of the tumors (C) and MLNs (B) of vehicle-or atRA-treated AOM-DSS mice. Data were pooled from 3 independent experiments with n=14 mice per group (A) and n=8 mice per group (B), and from 2 independent experiments with n=6–10 mice per group (C) and n=6 mice per group (D). (E) Tumor analyses of vehicle- or atRA-treated AOM-DSS mice injected from week 4 to week 9 with isotype control or anti-CD8α depleting antibody. Data were pooled from 2 independent experiments with n=6 mice in the isotype-treated group and n=8 mice in the CD8-depleted group. (F) Immunofluorescence images showing EpCAM (green), DAPI (blue) and TUNEL (red) in colonic tumor sections from atRA- or vehicle-treated isotype-injected and CD8-depleted AOM-DSS mice. Representative image from n=6 per group in the isotype-treated group and n=4 mice in the CD8-depleted group. Scale bar=50 μm. (G) Relative number of TUNEL+ cells quantified by normalizing to tumor crypt area in (F). (H) Tumor analyses in Cd8a−/− mice induced with AOM-DSS, and Cd8a−/− mice adoptively transferred with CD8+ T-cells, treated from week 3 to week 9 with atRA (n=6–9 mice per group). Results are represented as mean ± SEM. p<0.05=*; p<0.01=**; p<0.001=***, Mann Whitney U-test. See also Figure S4 and S5.
Figure 6
Figure 6. atRA upregulates MHCI expression on tumor epithelial cells, leading to increased cytotoxic T lymphocytes
(A,B) Flow cytometry plots of geometric mean intensity (MFI) of MHCI expression on tumor and surrounding epithelial cells (EpCAM+) from atRA- or vehicle-treated normal age-matched (A) or Vil1-cre-Rarafl/fl (B) AOM-DSS mice. Also shown are representative histograms of MHCI from the tumor epithelial cells. Data were pooled from 2 independent experiments with n=8–9 mice per group. (C) MHCI MFI on Caco-2 cells 72 hrs after in vitro treatment with 1 μM atRA compared to vehicle (DMSO). Shown are 3 independent experiments and a representative histogram. (D) Tumor analyses of vehicle- or atRA-treated Vil1-cre-Rarafl/fl mice induced with AOM-DSS. Data were pooled from 2 independent experiments with n=8–9 mice per group. (E,F) Flow cytometry data of percentage of granzyme B+ CD8+ T-cells in the tumors and surrounding distal colonic tissue from atRA- versus vehicle-treated normal age-matched (E) or Vil1-cre-Rarafl/fl (F) AOM-DSS mice. Data were pooled from 2 independent experiments with n=6 mice per group. Results are represented as mean ± SEM p<0.05=*; p<0.01=**; p<0.001=***, Mann Whitney U-test. See also Figure S6 and S7.
Figure 7
Figure 7. CYP26A1 in colon carcinoma correlates with reduced CD8+ T-cell cytotoxicity as well as with worse disease prognosis
(A,B) Representative images of core biopsies of adenocarcinomas showing high and low CYP26A1 staining (red) and corresponding serial sections showing CD8+ T-cell staining (green) and granzyme B staining (red). Scale bar=50 μm. (C,D) Correlation between CYP26A1 staining intensity (in arbitrary units (AU)) and CD8+ T-cell density normalized to tumor area (C) and percentage of CD8+ T-cells expressing granzyme B (D) in sporadic adenocarcinoma specimens, using Pearson’s correlation analyses. (E,F) Kaplan-Meier curves showing the correlation of CYP26A1 transcript expression, partitioned around the median, with overall survival (E) and disease-free survival (F) in colon cancer patients. p<0.05=*; p<0.01=**; p<0.001=***.

References

    1. Allie SR, Zhang W, Tsai CY, Noelle RJ, Usherwood EJ. Critical role for all-trans retinoic acid for optimal effector and effector memory CD8 T cell differentiation. Journal of immunology. 2013;190:2178–2187. - PMC - PubMed
    1. Arthur JC, Perez-Chanona E, Muhlbauer M, Tomkovich S, Uronis JM, Fan TJ, Campbell BJ, Abujamel T, Dogan B, Rogers AB, et al. Intestinal inflammation targets cancer-inducing activity of the microbiota. Science. 2012;338:120–123. - PMC - PubMed
    1. Balmer JE, Blomhoff R. Gene expression regulation by retinoic acid. Journal of lipid research. 2002;43:1773–1808. - PubMed
    1. Belcheva A, Irrazabal T, Robertson SJ, Streutker C, Maughan H, Rubino S, Moriyama EH, Copeland JK, Kumar S, Green B, et al. Gut microbial metabolism drives transformation of MSH2-deficient colon epithelial cells. Cell. 2014;158:288–299. - PubMed
    1. Bengtsson AM, Jonsson G, Magnusson C, Salim T, Axelsson C, Sjolander A. The cysteinyl leukotriene 2 receptor contributes to all-trans retinoic acid-induced differentiation of colon cancer cells. BMC cancer. 2013;13:336. - PMC - PubMed

Publication types