. 2016 Sep 20;45(3):597-609.
doi: 10.1016/j.immuni.2016.08.007. Epub 2016 Aug 30.

Hematopoietic Stem Cells Are the Major Source of Multilineage Hematopoiesis in Adult Animals

Affiliations

Hematopoietic Stem Cells Are the Major Source of Multilineage Hematopoiesis in Adult Animals

Catherine M Sawai et al. Immunity. .

Abstract

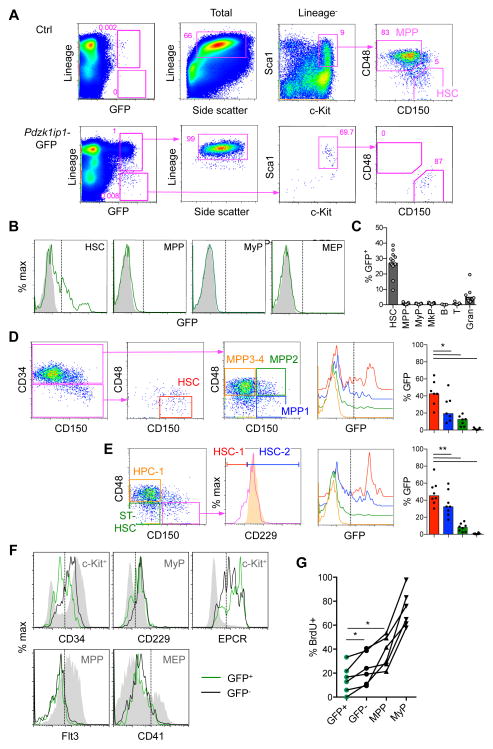
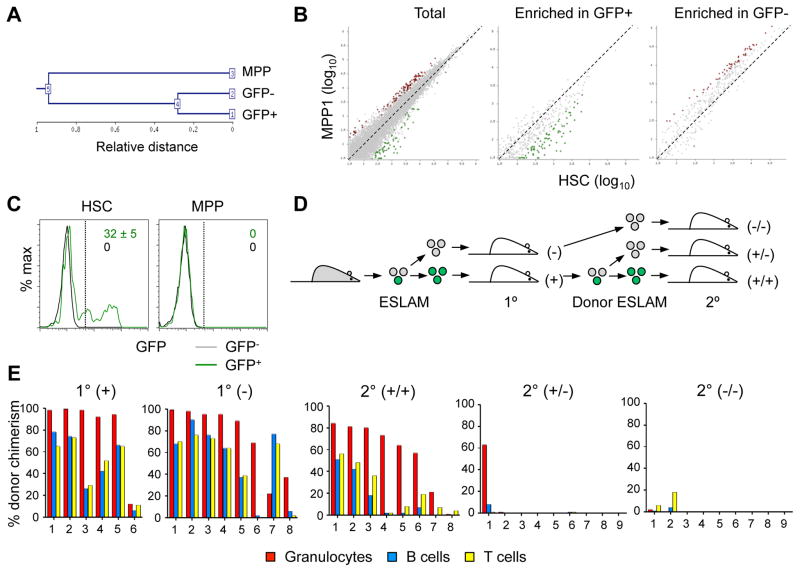
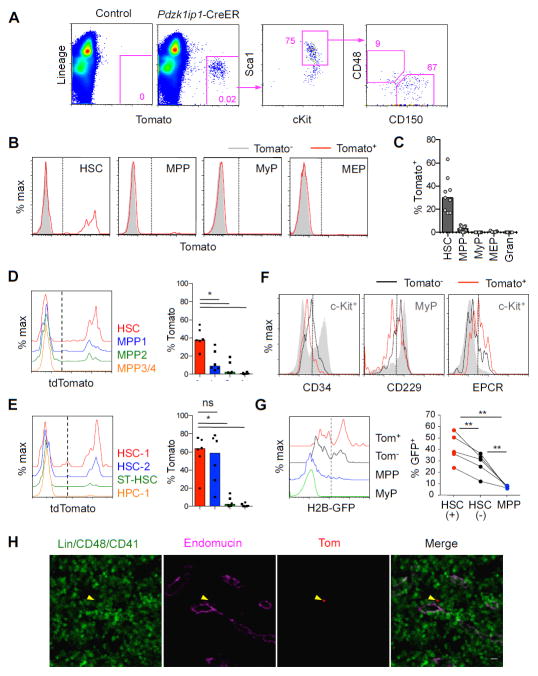
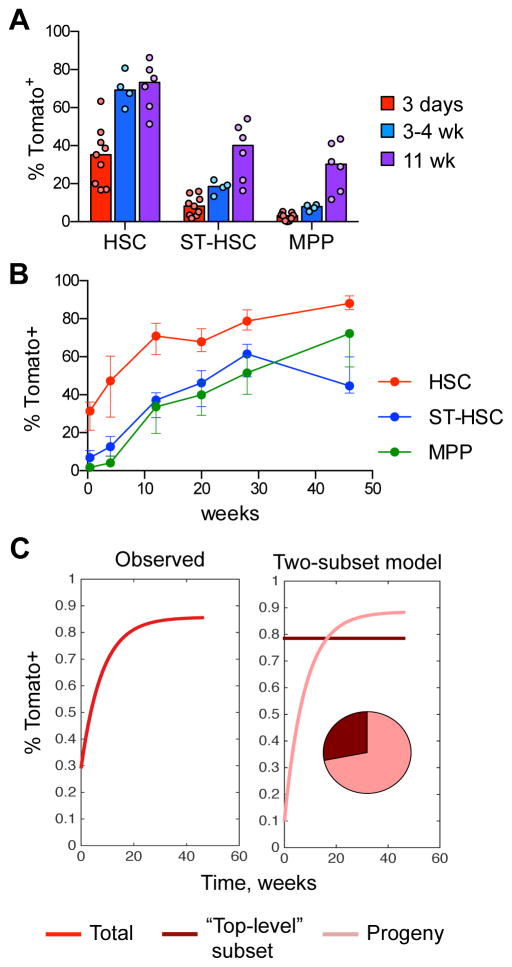
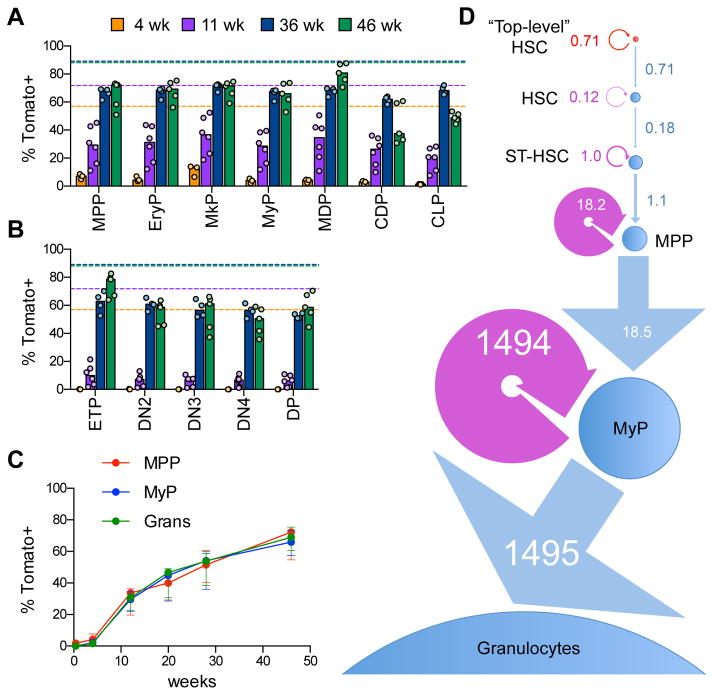
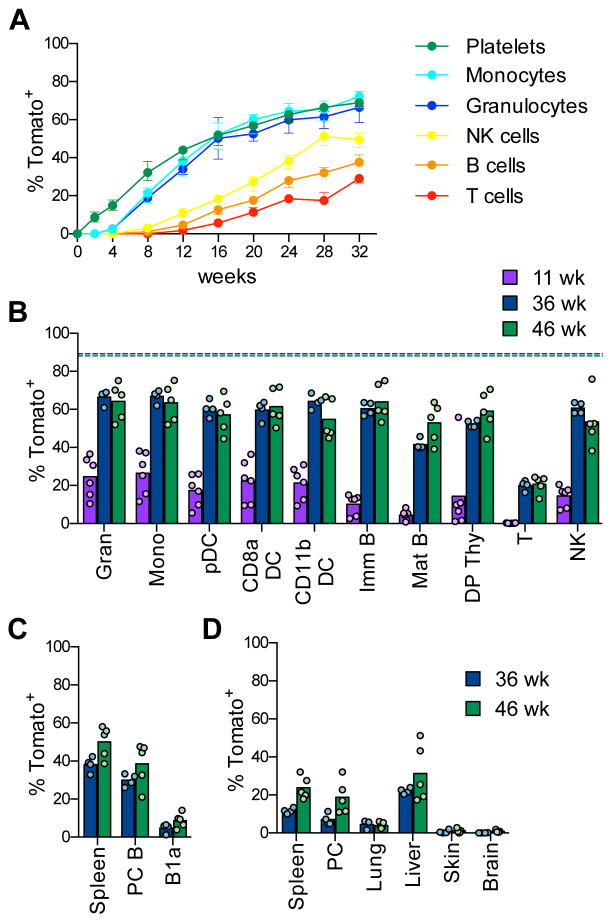
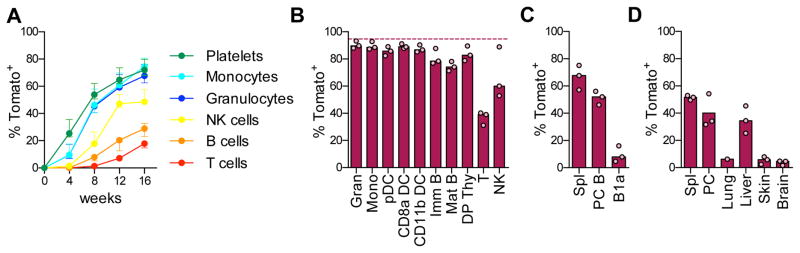
Hematopoietic stem cells (HSCs) sustain long-term reconstitution of hematopoiesis in transplantation recipients, yet their role in the endogenous steady-state hematopoiesis remains unclear. In particular, recent studies suggested that HSCs provide a relatively minor contribution to immune cell development in adults. We directed transgene expression in a fraction of HSCs that maintained reconstituting activity during serial transplantations. Inducible genetic labeling showed that transgene-expressing HSCs gave rise to other phenotypic HSCs, confirming their top position in the differentiation hierarchy. The labeled HSCs rapidly contributed to committed progenitors of all lineages and to mature myeloid cells and lymphocytes, but not to B-1a cells or tissue macrophages. Importantly, labeled HSCs gave rise to more than two-thirds of all myeloid cells and platelets in adult mice, and this contribution could be accelerated by an induced interferon response. Thus, classically defined HSCs maintain immune cell development in the steady state and during systemic cytokine responses.


Figures

Fig. 1
Fig. 1. Pdzk1ip1-GFP is expressed in a fraction of adult bone marrow HSCs
A. The expression of GFP within the total BM cells of adult Pdzk1ip1-GFP mice and the phenotype of gated GFP+ cells. The phenotypes of total or Lin cells from control non-transgenic BM are shown for comparison. Note that GFP+ Lin+ cells correspond to SSChi granulocytes and GFP+ Lin cells correspond to HSCs. B. Representative histograms of GFP expression in HSCs (LSK CD48 CD150+), MPPs (LSK CD48+ CD150), MyPs (Lin Sca1 cKit+ CD150), and MEPs (Lin Sca1 cKit+ CD150+) from Pdzk1ip1-GFP and control non-transgenic animals. C. The fraction of GFP+ cells within the indicated BM populations (MkP defined as Lin Sca1 cKit+ CD150+ CD41+; B, B220+; T, TCRβ+; Gran, Gr1+ CD11b+ SSChi). Bars represent medians of individual animals shown (n=13 for all cells except lymphocytes, for which n=5). D. The expression of GFP in the HSC and progenitor (MPP1–4) populations defined according to (Cabezas-Wallscheid et al., 2014; Wilson et al., 2008) and the fraction of GFP+ cells within each population (bars represent medians of individual animals shown, n=7). E. The expression of GFP in the HSC (HSC-1 and HSC-2) and progenitor (MPP and HPC-1) populations defined according to (Oguro et al., 2013). The expression of CD229 in the HPC-1 population is shown as a control (orange shadow histogram). Bars represent medians of individual animals shown (n=8). F. Expression of surface markers in GFP+ and GFP HSCs. Control populations showing the expression range of each marker are shown as grey shadow histograms. Representative of 3 individual animals. G. The fraction of GFP+ and GFP HSCs and progenitors (MPPs and MyPs) that incorporated BrdU after a 3-day pulse. Shown are values from 6 individual animals. Statistical significance: *p ≤ 0.05; **p ≤ 0.01. See also Fig. S1.
Fig. 2
Fig. 2. Pdzk1ip1-GFP+ HSCs have an undifferentiated expression profile and serial reconstitution capacity
A–B. RNA-Seq analysis of GFP+ and GFP HSCs and MPPs from Pdzk1ip1-GFP mice. A. Unsupervised clustering dendrogram of the three samples. B. Comparison with RNA-Seq profiles of wild-type HSCs and their immediate progeny (MPP1) (Cabezas-Wallscheid et al., 2014). Shown is pairwise comparison of transcript frequencies in HSCs and MPP1 for all genes (total) or for genes enriched in the GFP+ or GFP HSCs from Pdzk1ip1-GFP mice (Dataset S1). Genes increased >2-fold in HSCs or MPP1 are highlighted in green or red, respectively. C. The fraction of GFP+ cells in donor-derived HSCs and MPPs of primary recipients reconstituted with either GFP+ or GFP HSCs six months post-transplant (mean ± S.D. of 5 recipients). D. The design of experiment to assess the ability of 20 sorted GFP+ (green) or GFP (grey) CD45+ EPCR+ CD150+ CD48 (ESLAM) HSCs to reconstitute hematopoiesis in the primary (1°) and secondary (2°) recipients. E. The fraction of donor-derived cells among different blood cell lineages in recipients assessed at least 16 weeks post-transplant in primary and secondary recipients of 20 ESLAM HSCs. Shown are values for individual recipient mice pooled from two independent experiments. See also Fig. S2 and Dataset S1.
Fig. 3
Fig. 3. Pdzk1ip1-CreER transgene inducibly labels undifferentiated HSCs
A. The expression of tdTomato (Tom) in Pdzk1ip1-CreER R26Tom/Tom mice or Cre-negative R26Tom/Tom controls three days after a single tamoxifen administration. Shown is representative expression of Tom within the total BM cells and the phenotype of gated Tom+ cells. B,C. Representative histograms of Tom expression in the indicated cell populations (panel B) and the fraction of Tom+ cells within each population defined as in Fig. 1B,C (panel C, bars indicate median of individual animals, n=6). D–E. Histograms and fractions of Tom expression in HSC/progenitor populations defined as in Fig. 1D and E, respectively (bars represent medians of individual animals shown, n=6). F. Expression of surface markers in the Tom+ and Tom subsets of HSCs. Indicated control populations showing the expression range of each marker are shown as grey shadow histograms. Representative of 3 individual animals. G. The retention of H2B-GFP marker protein in the HSC/progenitor subsets. Pdzk1ip1-CreER R26Tom R26rtTA Col1a1tetO-H2BGFP mice were pulsed for 6 weeks to express H2B-GFP, chased for 14 weeks, induced with tamoxifen and analyzed 3 days later. Shown are representative histograms of H2B-GFP expression in Tom+ (+) or Tom (−) HSCs, MPPs and MyPs, and the fractions of GFP+ cells in these populations from individual animals. H. Labeled HSCs in the BM sections of Pdzk1ip1-CreER R26Tom/Tom mice 3 days post-tamoxifen were detected by endogenous tdTomato fluorescence (arrowhead). Shown is representative localization of Tom+ HSCs in sections stained for the sinusoid endothelial marker endomucin. Statistical significance: *p ≤ 0.05; **p ≤ 0.01; ns, not significant. See also Fig. S3.
Fig. 4
Fig. 4. Labeled HSCs give rise to other cells within the HSC population
A. The fraction of labeled Tom+ cells in the HSC/progenitor compartment of Pdzk1ip1-CreER R26Tom/Tom reporter mice. The HSC and progenitor subsets within the LSK population were defined on the basis of CD150/CD48 expression as shown in Fig. S4A. Shown are the median (bars) and individual values (circles) for animals sacrificed at 3 days, 3–4 weeks or 11 weeks after tamoxifen treatment. B. Continuous analysis of Tom+ cells in the HSC/progenitor compartment of tamoxifen-treated reporter mice by serial BM biopsy. Shown is the fraction of Tom+ cells in HSC/progenitor subsets in the same animals over time (median ± interquartile range, n= 5). C. The dynamics of Tom+ label accumulation in the HSC compartment (left) and its decomposition into two-subset model (right). The modeled composition of the HSC compartment is shown as a pie diagram. The labeled fraction of “top-level” HSCs is assumed to be constant since they are fully self-renewing while the labeled fraction of their progeny is steadily growing. See also Fig. S4.
Fig. 5
Fig. 5. Labeled HSCs provide a major contribution to all lineage-committed progenitors
A–B. The fraction of labeled Tom+ cells in lineage-committed progenitors from Pdzk1ip1-CreER R26Tom/Tom reporter mice. Cell populations in the BM and thymus were defined as shown in Fig. S5A. Shown are the median (bars) and values from individual animals (circles) at the indicated time points after tamoxifen treatment in the BM (panel A) and thymus (panel B). The median fractions of Tom+ HSCs at the respective time points are indicated by dashed lines. C. The fraction of labeled Tom+ cells in myeloid progenitors and granulocytes (Grans) from Pdzk1ip1-CreER R26Tom/Tom reporter mice analyzed by serial BM biopsy. Shown is the fraction of Tom+ cells in the same animals over time (median ± interquartile range, n= 5). D. A linear model of granulopoiesis based on serial BM biopsy data. Estimated values of differentiation and regeneration for each population are shown in the units of cells per week. Each population is shown by a circle with an area proportional to the number of cells, the width of each differentiation arrow (linear, blue) is proportional to the differentiation rate, the width of the regeneration arrow (circular, purple) is proportional to the regeneration rate, except the rates for MyPs that are ~100 times fold higher that for other populations. See also Fig. S5.
Fig. 6
Fig. 6. Labeled HSCs provide a major contribution to mature hematopoietic cells
A. The fraction of labeled Tom+ cells in peripheral blood cells of Pdzk1ip1-CreER R26Tom/Tom reporter mice at the indicated time points after tamoxifen administration. (median ± range of 4 animals, representative of two experiments). B–D. The fraction of labeled Tom+ cells in mature cell types of reporter mice. Shown are the median (bars) and values from individual animals (circles) at the indicated time points after tamoxifen treatment. B. Major immune cell types in the spleen or thymus. The median fractions of Tom+ HSCs at the respective time points are indicated by dashed lines. C. Conventional B cells in the spleen or peritoneal cavity (PC) and B-1a cells in PC. D. Resident macrophages from the indicated tissues. See also Fig. S6.
Fig. 7
Fig. 7. Interferon response accelerates HSC differentiation
Pdzk1ip1-CreER R26Tom/Tom reporter mice were induced with tamoxifen and then treated with poly-I:C on days 6, 8 and 10. A. The fraction of Tom+ cells in the peripheral blood (presented as in Fig. 6A; median ± range of 4 animals). B–D. The fraction of Tom+ cells at the 40 week endpoint; shown are the median (bars) and values from individual animals (circles). B. Major immune cell types in the spleen or thymus. The median fraction of Tom+ HSCs at this time point is indicated for comparison (dashed line). C. Conventional B cells in the spleen or PC and B-1a cells in PC. D. Resident macrophages from the indicated tissues.

Comment in

References

    1. Acar M, Kocherlakota KS, Murphy MM, Peyer JG, Oguro H, Inra CN, Jaiyeola C, Zhao Z, Luby-Phelps K, Morrison SJ. Deep imaging of bone marrow shows non-dividing stem cells are mainly perisinusoidal. Nature. 2015;526:126–130. - PMC - PubMed
    1. Adams PD, Jasper H, Rudolph KL. Aging-Induced Stem Cell Mutations as Drivers for Disease and Cancer. Cell Stem Cell. 2015;16:601–612. - PMC - PubMed
    1. Bagger FO, Sasivarevic D, Sohi SH, Laursen LG, Pundhir S, Sonderby CK, Winther O, Rapin N, Porse BT. BloodSpot: a database of gene expression profiles and transcriptional programs for healthy and malignant haematopoiesis. Nucleic Acids Res. 2016;44:D917–924. - PMC - PubMed
    1. Balazs AB, Fabian AJ, Esmon CT, Mulligan RC. Endothelial protein C receptor (CD201) explicitly identifies hematopoietic stem cells in murine bone marrow. Blood. 2006;107:2317–2321. - PMC - PubMed
    1. Benz C, Copley MR, Kent DG, Wohrer S, Cortes A, Aghaeepour N, Ma E, Mader H, Rowe K, Day C, et al. Hematopoietic stem cell subtypes expand differentially during development and display distinct lymphopoietic programs. Cell Stem Cell. 2012;10:273–283. - PubMed

Publication types

MeSH terms