. 2017 Oct 1;27(10):4719-4732.
doi: 10.1093/cercor/bhw265.

On the Stability of BOLD fMRI Correlations

Affiliations

On the Stability of BOLD fMRI Correlations

Timothy O Laumann et al. Cereb Cortex. .

Abstract

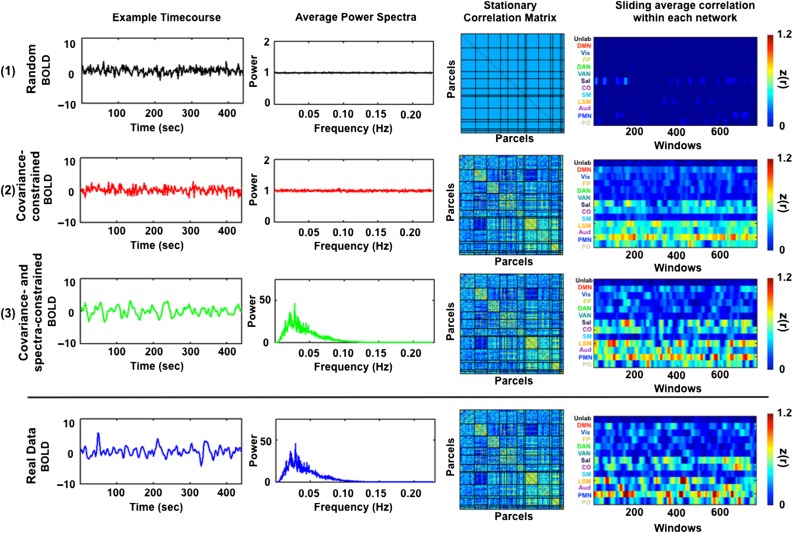
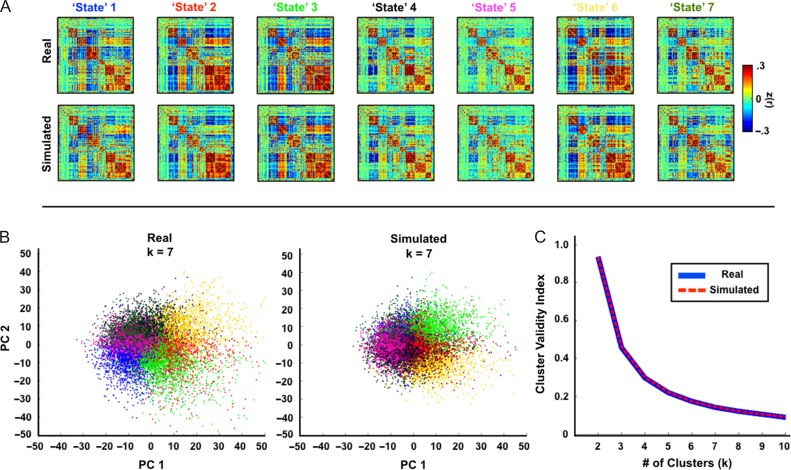
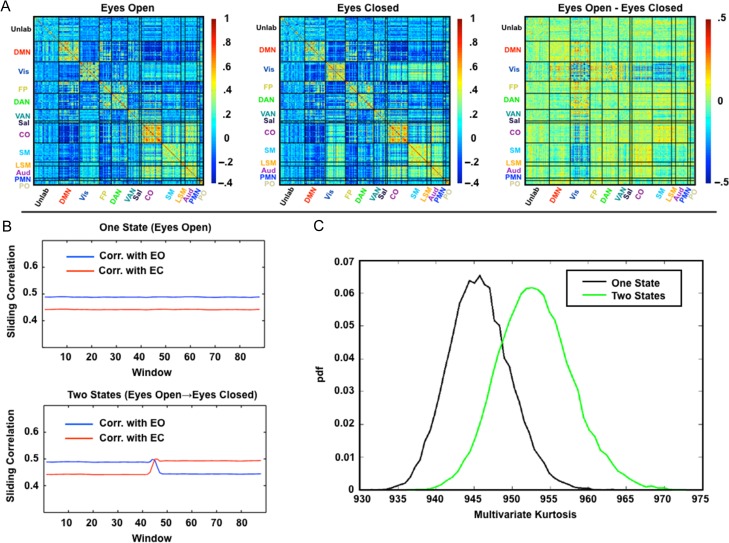
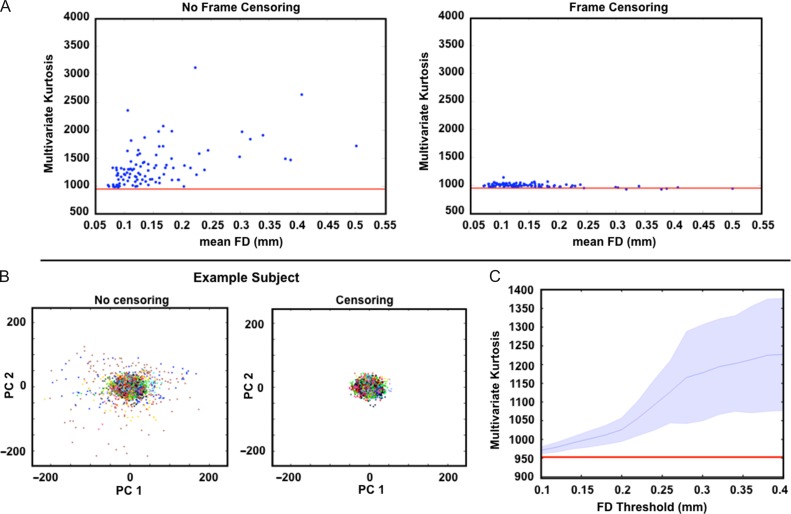
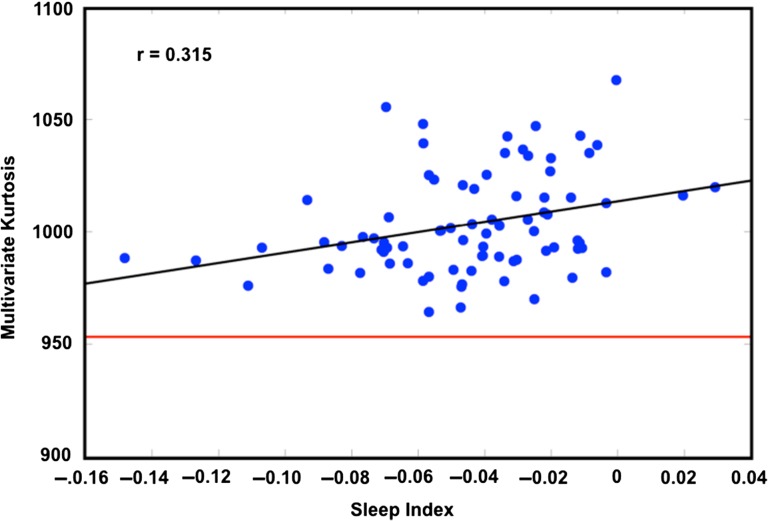
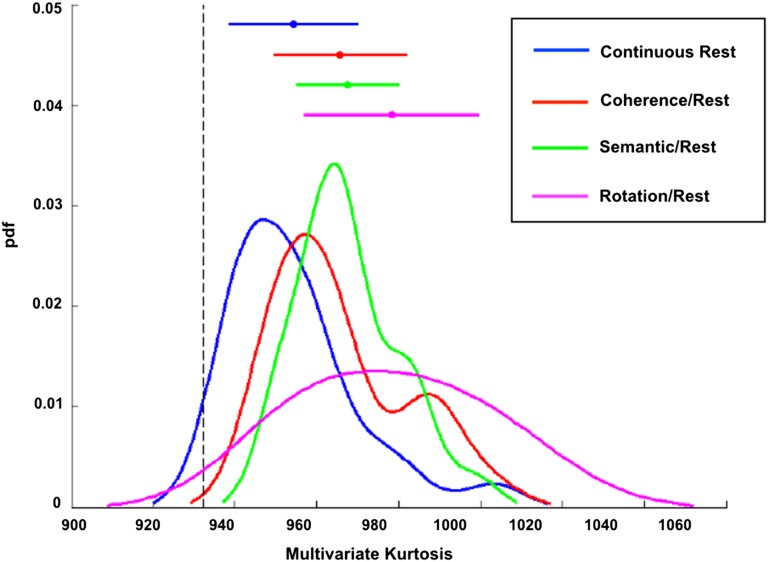
Measurement of correlations between brain regions (functional connectivity) using blood oxygen level dependent (BOLD) fMRI has proven to be a powerful tool for studying the functional organization of the brain. Recently, dynamic functional connectivity has emerged as a major topic in the resting-state BOLD fMRI literature. Here, using simulations and multiple sets of empirical observations, we confirm that imposed task states can alter the correlation structure of BOLD activity. However, we find that observations of "dynamic" BOLD correlations during the resting state are largely explained by sampling variability. Beyond sampling variability, the largest part of observed "dynamics" during rest is attributable to head motion. An additional component of dynamic variability during rest is attributable to fluctuating sleep state. Thus, aside from the preceding explanatory factors, a single correlation structure-as opposed to a sequence of distinct correlation structures-may adequately describe the resting state as measured by BOLD fMRI. These results suggest that resting-state BOLD correlations do not primarily reflect moment-to-moment changes in cognitive content. Rather, resting-state BOLD correlations may predominantly reflect processes concerned with the maintenance of the long-term stability of the brain's functional organization.

Keywords: BOLD fMRI; dynamics; functional connectivity; nonstationarity; resting state.


Figures

Figure 1.
Figure 1.
Generation of simulated data. (1) BOLD fMRI time series are simulated by first sampling random normal deviates. (2) These time series are projected onto the eigenvectors of the covariance matrix of real data averaged over ten 30-min sessions from each subject. (3) The projected time series then are matched to the average parcel-wise power spectrum of the real data by multiplication in the spectral domain. The final simulated data share the covariance and spectral features of real data (compare with bottom row) and are stationary by construction.
Figure 2.
Figure 2.
Real and simulated data have the same “states.” (A) Average correlation matrices corresponding to clusters (k = 7) derived by analysis of correlation matrices over sliding windows. Real and simulated data produce very similar “state” patterns. (B) Sliding window correlation matrices projected onto the first two principal components. Colors correspond to “state” identity in (A). (C) Similarly, the cluster validity index by number of clusters is nearly identical in the real and simulated data. To specifically illustrate sampling variability masquerading as “nonstationarity,” the impact of artifactual nonstationarity was minimized by excluding data corrupted by head motion. Thus, sessions with fewer than 50% of frames retained by scrubbing criteria were excluded entirely.
Figure 3.
Figure 3.
Multivariate kurtosis is sensitive to state changes in simulated multivariate data. (A) Average correlation matrices from real data acquired in eyes-open (EO; ten 10-min sessions) and eyes-closed (EC; ten 10-min sessions) conditions. The primary differences are in visual and somatomotor cortex. (B) Sliding window correlation results averaged over 10 000 simulations. The plotted values are the mean (over all simulations) Pearson correlation between the windowed correlation matrices and the “true” correlation matrices shown in panel A (blue = eyes-open, red = eyes-closed). The first simulation models the eyes-open condition throughout. The second simulation models the eyes closing halfway through the session. The plotted correlation values are substantially <1, even for windows matched to the reference state, because of sampling variability (Laumann et al. 2015). (C) Distribution of computed multivariate kurtosis values over the 10 000 simulations. pdf, probability density function. Multivariate kurtosis is systematically greater for the two-state simulation relative to the one-state simulation. Time series of finite duration yield kurtosis values that are systematically lower than expected in the limit of infinite sample size (see Supplementary Fig. S2). Thus, if d = 30, the expected kurtosis is d (d + 2) = 960 for data of infinite length, whereas the mean value in the perfectly stationary simulation here is 945.
Figure 4.
Figure 4.
Multivariate kurtosis is related to head motion. (A) Multivariate kurtosis plotted against mean framewise displacement (FD). Each blue dot represents one session. All 10 sessions from each of 10 subjects are represented. Kurtosis is computed on the first 30 principal components derived from each session (see “Materials and Methods” section). The average kurtosis of simulated stationary data is indicated by the red line (~952). The top and bottom plots were generated without and with frame censoring, respectively. (B) BOLD fMRI data from all 10 sessions of one example subject projected onto the first two principal components. Each dot represents one frame. Colors correspond to session; note no systematic effect of session. Results obtained without and with frame censoring are shown on the left and right, respectively. Frame censoring (FD > 0.2 mm) markedly reduces outlier data. (C) Multivariate kurtosis as a function of frame censoring FD threshold across all sessions and subjects. Shading indicates the standard deviation. The red line indicates the average multivariate kurtosis of simulated data.
Figure 5.
Figure 5.
Multivariate kurtosis correlates with SI. Kurtosis is computed on the first 30 principal components derived from each session. Sessions have been frame censored. Any session with fewer than 50% frames retained has been removed. One session with a kurtosis measure 4.7 SD from the mean was excluded. The average kurtosis corresponding to simulated stationary data is indicated by the red line (~952).
Figure 6.
Figure 6.
Alternating blocks of task/rest give rise to greater multivariate kurtosis than continuous resting state. Kurtosis values from task/rest runs (3 duplicate runs per paradigm) were averaged and compared with kurtosis values from continuous resting state runs of the same length (470 s) in the same subjects (N = 24). Three different task paradigms were used: Glass pattern coherence discrimination (red), noun versus verb semantic judgment (green), and mental rotation (purple). Plots represent smoothed histograms of the kurtosis values. Bars above indicate the mean and standard deviation for each condition. The dotted black line represents the mean kurtosis (932) of simulated stationary data of the same length as the task runs. Nonsmoothed histograms are reported in Supplementary Figure S5.

References

    1. Al-Aidroos N, Said CP, Turk-Browne NB. 2012. Top-down attention switches coupling between low-level and high-level areas of human visual cortex. Proc Natl Acad Sci USA. 109 (36):14675–14680. - PMC - PubMed
    1. Allen EA, Damaraju E, Plis SM, Erhardt EB, Eichele T, Calhoun VD. 2014. Tracking whole-brain connectivity dynamics in the resting state. Cereb Cortex. 24(3):663–676. - PMC - PubMed
    1. Barttfeld P, Uhrig L, Sitt JD, Sigman M, Jarraya B, Dehaene S. 2015. Signature of consciousness in the dynamics of resting-state brain activity. Proc Natl Acad Sci USA. 112(3):887–892. - PMC - PubMed
    1. Bianciardi M, Fukunaga M, van Gelderen P, Horovitz SG, de Zwart JA, Duyn JH. 2009. Modulation of spontaneous fMRI activity in human visual cortex by behavioral state. Neuroimage. 45(1):160–168. - PMC - PubMed
    1. Bishop GH. 1932. Cyclic changes in excitability of the optic pathway of the rabbit. Am J Physiol. 103:213–224.

Publication types