. 2016 Oct;9(5):395-407.
doi: 10.1161/CIRCGENETICS.115.001363. Epub 2016 Sep 2.

Decoding the Long Noncoding RNA During Cardiac Maturation: A Roadmap for Functional Discovery

Affiliations

Decoding the Long Noncoding RNA During Cardiac Maturation: A Roadmap for Functional Discovery

Marlin Touma et al. Circ Cardiovasc Genet. 2016 Oct.

Abstract

Background: Cardiac maturation during perinatal transition of heart is critical for functional adaptation to hemodynamic load and nutrient environment. Perturbation in this process has major implications in congenital heart defects. Transcriptome programming during perinatal stages is an important information but incomplete in current literature, particularly, the expression profiles of the long noncoding RNAs (lncRNAs) are not fully elucidated.

Methods and results: From comprehensive analysis of transcriptomes derived from neonatal mouse heart left and right ventricles, a total of 45 167 unique transcripts were identified, including 21 916 known and 2033 novel lncRNAs. Among these lncRNAs, 196 exhibited significant dynamic regulation along maturation process. By implementing parallel weighted gene co-expression network analysis of mRNA and lncRNA data sets, several lncRNA modules coordinately expressed in a developmental manner similar to protein coding genes, while few lncRNAs revealed chamber-specific patterns. Out of 2262 lncRNAs located within 50 kb of protein coding genes, 5% significantly correlate with the expression of their neighboring genes. The impact of Ppp1r1b-lncRNA on the corresponding partner gene Tcap was validated in cultured myoblasts. This concordant regulation was also conserved in human infantile hearts. Furthermore, the Ppp1r1b-lncRNA/Tcap expression ratio was identified as a molecular signature that differentiated congenital heart defect phenotypes.

Conclusions: The study provides the first high-resolution landscape on neonatal cardiac lncRNAs and reveals their potential interaction with mRNA transcriptome during cardiac maturation. Ppp1r1b-lncRNA was identified as a regulator of Tcap expression, with dynamic interaction in postnatal cardiac development and congenital heart defects.

Keywords: congenital cardiac defect; gene regulation; lncRNA; neonatal heart maturation; neonatal mouse cardiomyocyte; transcriptome.


Figures

Figure 1
Figure 1
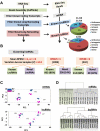
Transcriptome Landscape in Neonatal Mouse Heart Chambers. A. Schematic representation of bioinformatics pipeline and expression statistics of mapped RNA transcripts (absolute numbers of detected genes and lncRNAs are shown). Pie charts represent percentage of neonatal heart lncRNA sub-classes. B. Schematic representation of lncRNA clustering analysis algorithm. Numbers of known versus novel lncRNAs using different expression cutoff values are shown. C. Principal component analysis (PCA) of top 500 varying mRNAs (upper panel) and lncRNAs (lower panel) across maturation stages. D. Unsupervised hierarchical clustering of mRNAs (upper panel) and lncRNAs (lower panel) derived from 17 RNA-Seq samples.
Figure 2
Figure 2
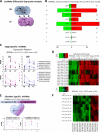
LncRNAs are Dynamically Regulated in Neonatal Heart along Maturation Stages. A. Schematic representation of pair wise comparative (differential expression) analysis along 2 schemes: stage specific and chamber specific. B. Numbers of significantly differentially expressed lncRNAs (cutoff values: RPKM>=1, V>=0.2, FDR P<= 0.05, FC >=2) in stage specific and chamber specific comparisons. (Red: Upregulated, Green: Downregulated) C. Expression time course and patterns of representative stage specific lncRNAs in LV (left ventricle/pink) and RV (right ventricle/blue). D. Expression heat maps (Z score) of stage specific differentially expressed lncRNAs in LV and RV. Columns represent lncRNAs and rows represent expression ratio between developmental stages being compared. (Red: Upregulated, Green: Downregulated) E. Chamber specific lncRNAs and representative expression time courses showing chamber specific divergence (cutoff values RPKM>=1, V>=0.2, FDR P<=0.01). F. Expression heat maps (Z score) of chamber specific differentially expressed lncRNAs in LV in contrast to RV overall. Columns represent lncRNAs and rows represent expression ratio of each LV sample in contrast to RV. (Red: Upregulated, Green: Downregulated).
Figure 3
Figure 3
Weighted Gene Co-expression Network Analysis (WGCNA) Revealed Stage Specific mRNA and lncRNA Module Gene Network in Neonatal Heart. A. D. WGCNA dendrograms of protein coding mRNAs (A) and lncRNAs (D) expression reveal different expression modules. Branches in the hierarchical clustering dendrograms correspond to modules. Color-coded module membership is displayed in the color bars below the dendrograms. Y axes (height) represent module significance (correlation with external trait). B. Heat map depicting expression profiles of stage specific mRNA modules member genes. Eight stage specific modules overlapping in LV and RV and numbers of genes corresponding to each module are shown (color-bars). Eigengene expression of a given module is presented (bar graphs) along with representative top two correlated hub genes for each module. The expression profiles are standardized. Red and green correspond to high and low expression values, respectively. Intramodular gene connectivity measure (kME) >0.9 and P<10−10 are required to identify hub genes. Module-stage correlation cutoff values r≥0.7 and P≤0.005 are required. (r. Pearson's correlation coefficient; P. P value). Color code of the modules is preserved. C. Top Gene Ontology (GO) terms enriched in corresponding stage specific modules are listed with their P values. E. Heat map depicting expression profiles of stage specific lncRNA module members. Six stage specific modules overlapping in LV and RV and numbers of corresponding lncRNA members are shown (color-bars). Eigengene expression of a given module is presented (bar graphs). Correlated hub-lncRNAs for each stage specific module are also presented. Color code of the modules is preserved. F. Correlation plots depicting lncRNA modules correlation with LV trait (X Axis) and RV trait (Y Axis) at P0, P3, and P7.
Figure 4
Figure 4
LncRNAs Correlation with Neighboring Genes. A. Pie chart showing the numbers of collocated lncRNA/mRNA pairs with significant expression correlation in at least one developmental stage (r≥0.9, B-H adjusted Pearson's P value≤0.05). B. Correlation plot of representative significantly correlated lncRNA/mRNA pairs depicting positive and negative expression correlation relationship. C. List of the correlated lncRNA/gene pairs. Novel lncRNAs are labeled in orange. (A complete list of significantly correlated lncRNA/mRNA pairs is presented in Supplemental Table 5) (BH: Benjamini-Hochberg; r: Pearson's correlation coefficient; P: P value).
Figure 5
Figure 5
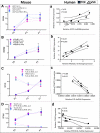
Conserved Expression Correlation Relationship Between lncRNA/mRNA Partners in Human Infantile Heart. A. B. C. D. Expression time courses (RNA-seq) of lncRNAs (Ucp2-lncRNA, n420212, FUS-lncRNA and Ppp1r1b-lncRNA) in LV (light pink) and RV (light blue) and partner mRNAs (Ucp3, Kcnb1, Trim72 and Tcap, respectively) in LV (dark pink) and RV (dark blue). a,b,c,d. Correlation graphs depicting expression correlation relationship between lncRNAs (UCP2, NONMMUT041263, FUS-lncRNA and PPP1R1B-lncRNA) (X Axis) and partner mRNAs (UCP3, KCNB1, TRIM72 and TCAP, respectively) (Y Axis) in human congenital heart defect (CHD) samples. (TOF: Tetralogy of Fallot; VSD: Ventricular Septal Defect; r: Pearson's correlation coefficient; P: P value). The dotted lines represent the 25% confidence intervals. Age of the patients ranged between 2-24 m/o for TOF cases (n=4), and between 2-5 y/o for VSD cases (n=3).
Figure 6
Figure 6
Ppp1r1b-lncRNA (NONMMUT011874) and Tcap are Inversely Regulated in Neonatal Mouse Heart and in C2C12 Cell Line. A. Genomic position of mouse Ppp1r1b-lncRNA in relation to Tcap on mouse Chromosome 11 and schematic representation of GapmeR (antisense Oligo) targeting site. B. Quantitative validation (qRT-PCR) of Ppp1r1b-lncRNA, Tcap, and Ppp1r1b-mRNA expression time course in neonatal mouse heart (I. RNA-seq data, II. qRT-PCR data). C. Quantitative validation of Ppp1r1b-lncRNA, Tcap, and Ppp1r1b-mRNA expression time course during myoblast differentiation. I: Confocal images depicting differentiation time course of cultured mouse myoblast cell line (C2C12). Yellow arrows indicate myosin positive multinucleated myotubes. II: Expression time course (qRT-PCR) of Ppp1r1b-lncRNA, Tcap, and Ppp1r1b-mRNA during C2C12 differentiation (n= 3 replicates).
Figure 7
Figure 7
Ppp1r1b-lncRNA (NONMMUT011874) Regulates Tcap Expression and Myogenesis in Cultured C2C12 Myoblast Cell Line. A. Light microscopy (upper) and confocal images of cultured C2C12 cells in response to GapmeR compared to scrambled control. B. Semi-quantitative analysis of myogenic differentiation using fusion index. C, E. Quantitative expression of Ppp1r1b-lncRNA, Tcap, Myoz2, Myom2, Ppp1r1b and Stard3 in C2C12 cells in response to GapmeR compared to scrambled control 48 hours post treatment. D. Increased Tcap protein abundance in response to Ppp1r1b-lncRNA knockdown. F. Quantitative expression of Ppp1r1b-lncRNA, Tcap, and Ppp1r1b-mRNA in neonatal rat ventricular myocytes (NRVMs) in response to GapmeR compared to scrambled control. (n=3 replicates per condition).
Figure 8
Figure 8
PPP1R1B-lncRNA/TCAP Expression Ratio Segregates Human Congenital Heart Defect Phenotypes. A. Genomic position of human PPP1R1B-lncRNA ortholog (annotated as NONHSAT053465) on chromosome 17. B. Expression time course of PPP1R1B-lncRNA and TCAP in human infantile hearts with TOF (n= 5). C. PPP1R1B-lncRNA and TCAP are inversely regulated in TOF vs VSD patients. D. PPP1R1B-lncRNA/TCAP ratio significantly segregates with disease phenotype (TOF vs VSD). (TOF: n=8, age range: 2-24 m/o; VSD: n=6, age range: 2-5y/o.), PPP1R1B-lncRNA didn't amplify in one VSD sample, and TCAP didn't amplify in one TOF sample. Those two samples were therefore excluded. The remaining samples were used for PPP1R1B-lncRNA/TCAP ratio.

Comment in

References

    1. Finnemore A, Groves A. Physiology of the fetal and transitional circulation. Semin Fetal Neonatal Med. 2015;20:210–216. - PubMed
    1. Donn MS. Fetal-to-neonatal maladaptation. Semin Fetal Neonatal Med. 2006;11:166–173. - PubMed
    1. Porrello ER, Mohmoud AI, Simpson E, Hill JA, Richardson JA, Olson EN, et al. Transient regenerative potential of the neonatal mouse heart. Science. 2011;331:1078–1080. - PMC - PubMed
    1. Harvey RP. Patterning the vertebrate heart. Nat Rev Genet. 2002;3:544–556. - PubMed
    1. Srivastava D. Making or breaking the heart: from lineage determination to morphogenesis. Cell. 2006b;126:1037–1048. - PubMed

MeSH terms