. 2016 Oct;172(2):802-818.
doi: 10.1104/pp.16.00753. Epub 2016 Sep 2.

Elevated Temperature and CO2 Stimulate Late-Season Photosynthesis But Impair Cold Hardening in Pine

Affiliations

Elevated Temperature and CO2 Stimulate Late-Season Photosynthesis But Impair Cold Hardening in Pine

Christine Y Chang et al. Plant Physiol. 2016 Oct.

Abstract

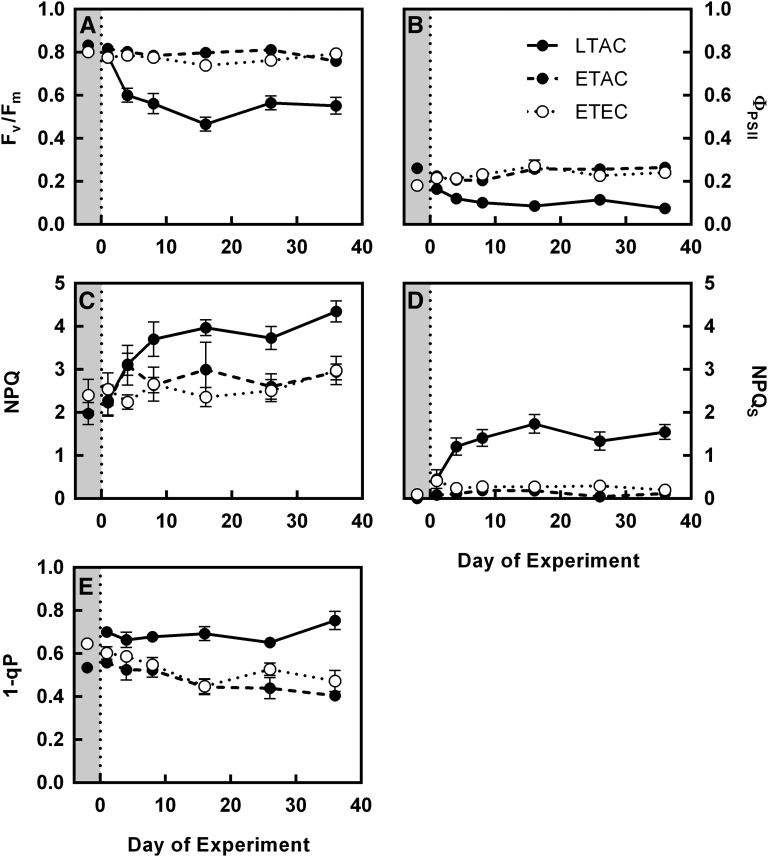
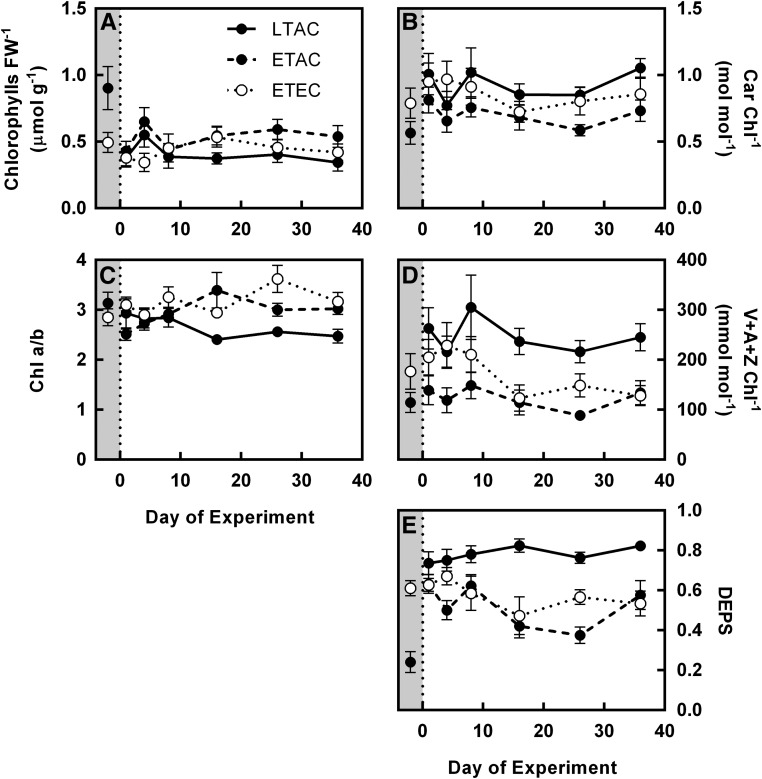
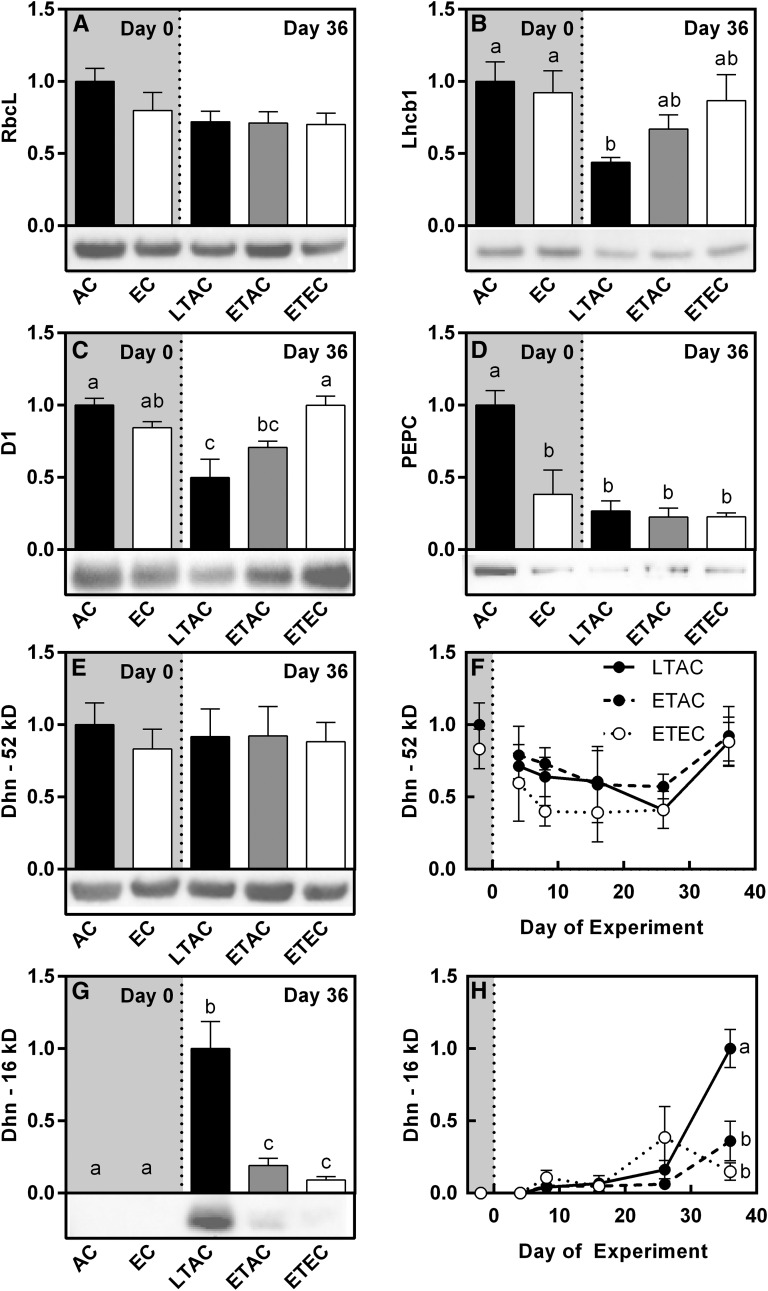
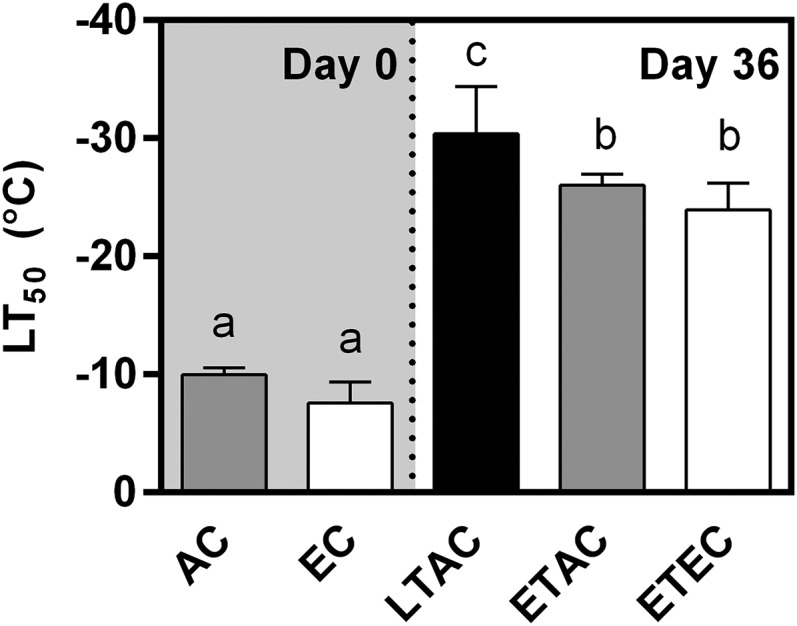
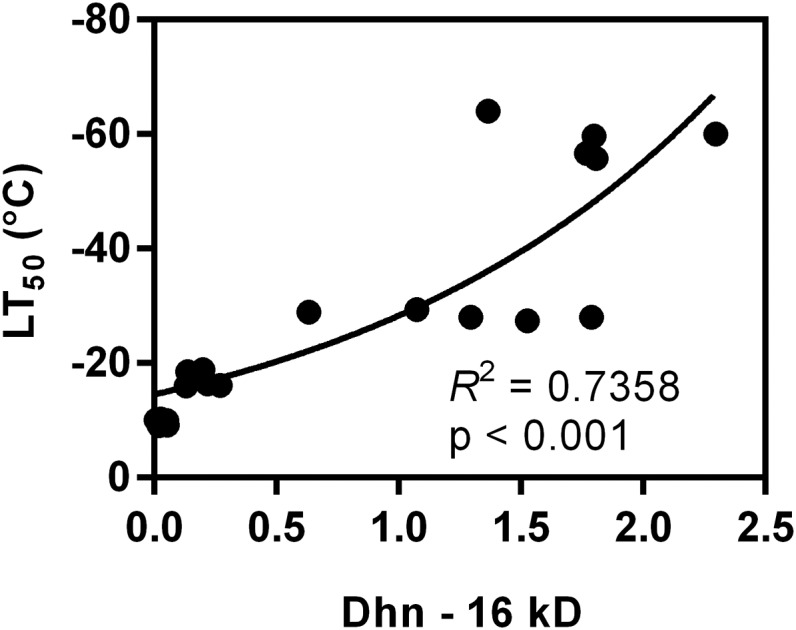
Rising global temperature and CO2 levels may sustain late-season net photosynthesis of evergreen conifers but could also impair the development of cold hardiness. Our study investigated how elevated temperature, and the combination of elevated temperature with elevated CO2, affected photosynthetic rates, leaf carbohydrates, freezing tolerance, and proteins involved in photosynthesis and cold hardening in Eastern white pine (Pinus strobus). We designed an experiment where control seedlings were acclimated to long photoperiod (day/night 14/10 h), warm temperature (22°C/15°C), and either ambient (400 μL L-1) or elevated (800 μmol mol-1) CO2, and then shifted seedlings to growth conditions with short photoperiod (8/16 h) and low temperature/ambient CO2 (LTAC), elevated temperature/ambient CO2 (ETAC), or elevated temperature/elevated CO2 (ETEC). Exposure to LTAC induced down-regulation of photosynthesis, development of sustained nonphotochemical quenching, accumulation of soluble carbohydrates, expression of a 16-kD dehydrin absent under long photoperiod, and increased freezing tolerance. In ETAC seedlings, photosynthesis was not down-regulated, while accumulation of soluble carbohydrates, dehydrin expression, and freezing tolerance were impaired. ETEC seedlings revealed increased photosynthesis and improved water use efficiency but impaired dehydrin expression and freezing tolerance similar to ETAC seedlings. Sixteen-kilodalton dehydrin expression strongly correlated with increases in freezing tolerance, suggesting its involvement in the development of cold hardiness in P. strobus Our findings suggest that exposure to elevated temperature and CO2 during autumn can delay down-regulation of photosynthesis and stimulate late-season net photosynthesis in P. strobus seedlings. However, this comes at the cost of impaired freezing tolerance. Elevated temperature and CO2 also impaired freezing tolerance. However, unless the frequency and timing of extreme low-temperature events changes, this is unlikely to increase risk of freezing damage in P. strobus seedlings.


Figures

Figure 1.
Figure 1.
Response of photosynthetic gas exchange to LTAC, ETAC, and ETEC. A, Anet, net photosynthetic CO2 assimilation; B, gs, stomatal conductance; C, Rd, dark respiration; D, IWUE; E, Vcmax, maximum rate of Rubisco carboxylation. Gray background indicates long photoperiod controls; white background indicates short photoperiod treatments. Measurements for Anet, gs, Rd, and IWUE were taken at 1400 µmol quanta m−2 s−1 and growth conditions; A/Ci curves used to calculate Vcmax were taken at 1400 µmol quanta m−2 s−1, 400 μmol mol−1 CO2, and 25°C. Points represent the average of n = 8 to 10 ± se biological replicates. Letters in E indicate significantly different groups determined by one-way ANOVA (P < 0.05).
Figure 2.
Figure 2.
Response of chlorophyll fluorescence to LTAC, ETAC, and ETEC. A, Fv/Fm, maximum quantum efficiency of photosystem II; B, ΦPSII, effective quantum yield of photosystem II; C, NPQ; D, NPQS; E, 1 − qP, excitation pressure at photosystem II. Gray background indicates long photoperiod controls; white background indicates short photoperiod treatments. Measurements were taken at growth conditions; light-adapted measurements were taken at 1400 µmol quanta m−2 s−1. Points represent the average of n = 8 to 10 ± se biological replicates.
Figure 3.
Figure 3.
Changes in photosynthetic leaf pigments in response to LTAC, ETAC, and ETEC. A, Tot Chl, total chlorophylls expressed per gram fresh weight; B, Tot Car, total carotenoids expressed per mol chlorophyll; C, Chl a/b, ratio of chlorophyll a to chlorophyll b; D, V+A+Z, total xanthophyll cycle pool, comprised of violaxanthin, antheraxanthin, and zeaxanthin; E, DEPS. Gray background indicates long photoperiod controls; white background indicates short photoperiod treatments. Points represent the average of n = 8 to 10 ± se biological replicates.
Figure 4.
Figure 4.
Changes in leaf nonstructural carbohydrate content in response to LTAC, ETAC, and ETEC. A, Starch content, expressed as percent dry weight; B, total soluble sugars, composed of the sum of C to F; C, Sucrose content; D, hexose content (Glc + Fru); E, pinitol content; F, raffinose content, expressed per unit dry weight. Gray background indicates long photoperiod controls; white background indicates short photoperiod treatments. Points represent the average of n = 8 to 10 ± se biological replicates. Letters indicated on the insets for D and F indicate significantly different treatments determined by two-way ANOVA (P < 0.05).
Figure 5.
Figure 5.
Changes in expression of leaf proteins in response to LTAC, ETAC, and ETEC. A, RbcL, Rubisco large subunit; B, Lhcb1, light harvesting complex protein of photosystem II; C, D1, reaction center core protein of photosystem II; D, PEPC; E to H, Dhn, dehydrin. The average optical density of the day 0 AC control was arbitrarily scaled to 1 for RbcL, Lhcb1, D1, PEPC, and 52-kD dehydrin (A–F); the average optical density of day 36 LTAC treatment was scaled to 1 for 16-kD dehydrin (G–H). Bars represent the average of n = 8 to 10 ± se biological replicates. Letters, where present, indicate significantly different groups determined by one-way ANOVA (P < 0.05). Representative blots shown were loaded with 5 µg total protein per lane.
Figure 6.
Figure 6.
Shoot freezing tolerance at the beginning (day 0) and end (day 36) of the experiment in response to LTAC, ETAC, and ETEC. Gray background indicates long photoperiod controls; white background indicates short photoperiod treatments. Bars represent average LT50 of n = 10 seedlings, estimated using sigmoidal curves fit to the data (Supplemental Fig. S3); error bars represent 95% confidence intervals. Letters, where present, indicate significantly different groups determined by extra sum-of-squares F test.
Figure 7.
Figure 7.
Changes in dehydrin protein expression and development of freezing tolerance during cold hardening in needles of field grown P. strobus seedlings. A, Photoperiod (Phot), mean (Tmean), and minimum (Tmin) ambient air temperature measured at field site; dotted vertical lines indicate sampling dates. B, Constitutively expressed 52-kD and C, autumn-induced 16-kD dehydrin levels. The average optical density of day 36 LTAC, used as a reference, was arbitrarily scaled to 1. Representative blots shown were loaded on an equal protein basis. Bars represent the average of n = 5 ± se plot replicates. D, Shoot freezing tolerance. Bars represent the average of n = 5 ± 95% confidence interval. Letters, where present, indicate statistically different groups determined by one-way ANOVA (P < 0.05).
Figure 8.
Figure 8.
Correlation between relative leaf protein content of 16-kD dehydrin (Dhn) and freezing tolerance (LT50). Each point indicates plot average of three individuals. R2 value indicates goodness-of-fit for an exponential relationship. P value indicates whether log-transformed slope differs significantly from zero.

References

    1. Adams WW III, Zarter CR, Ebbert V, Demmig-Adams B (2004) Photoprotective strategies of overwintering evergreens. Bioscience 54: 41–49
    1. Ainsworth EA, Long SP (2005) What have we learned from 15 years of free-air CO2 enrichment (FACE)? A meta-analytic review of the responses of photosynthesis, canopy properties and plant production to rising CO2. New Phytol 165: 351–371 - PubMed
    1. Altschul SF, Gish W, Miller W, Myers EW, Lipman DJ (1990) Basic local alignment search tool. J Mol Biol 215: 403–410 - PubMed
    1. Angelcheva L, Mishra Y, Antti H, Kjellsen TD, Funk C, Strimbeck RG, Schröder WP (2014) Metabolomic analysis of extreme freezing tolerance in Siberian spruce (Picea obovata). New Phytol 204: 545–555 - PubMed
    1. Basler D, Körner C (2012) Photoperiod sensitivity of bud burst in 14 temperate forest tree species. Agric For Meteorol 165: 73–81

LinkOut - more resources