

General Methods for Evolutionary Quantitative Genetic Inference from Generalized Mixed Models
- PMID: 27591750
- PMCID: PMC5105857
- DOI: 10.1534/genetics.115.186536
General Methods for Evolutionary Quantitative Genetic Inference from Generalized Mixed Models
Abstract
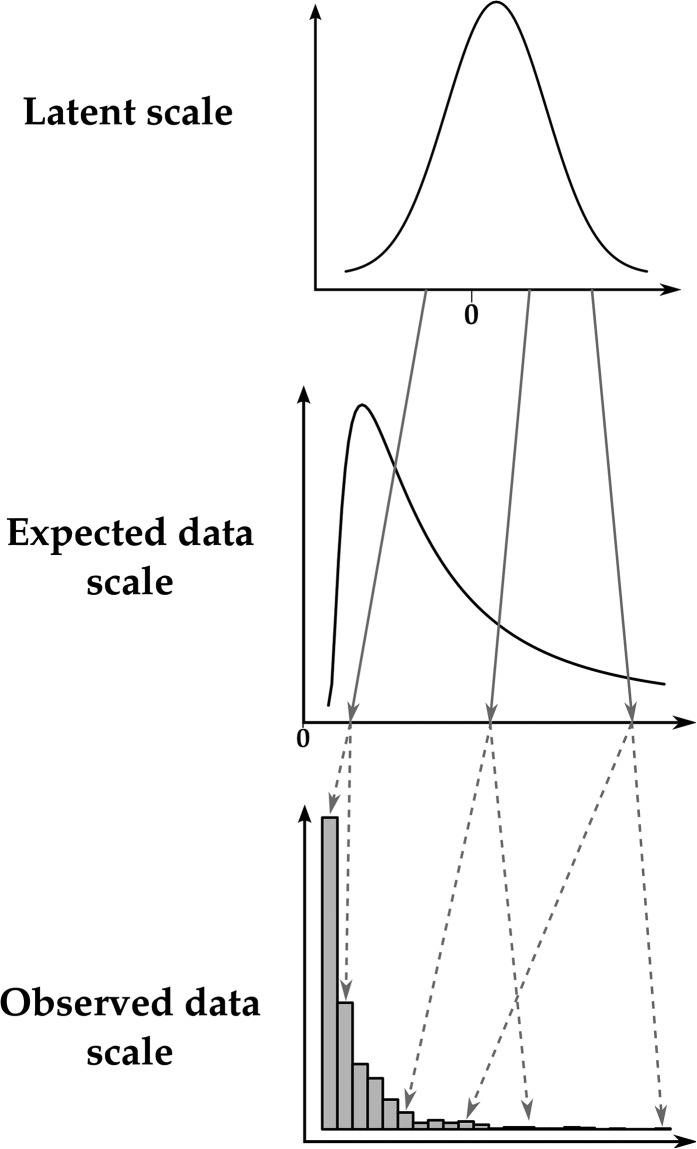
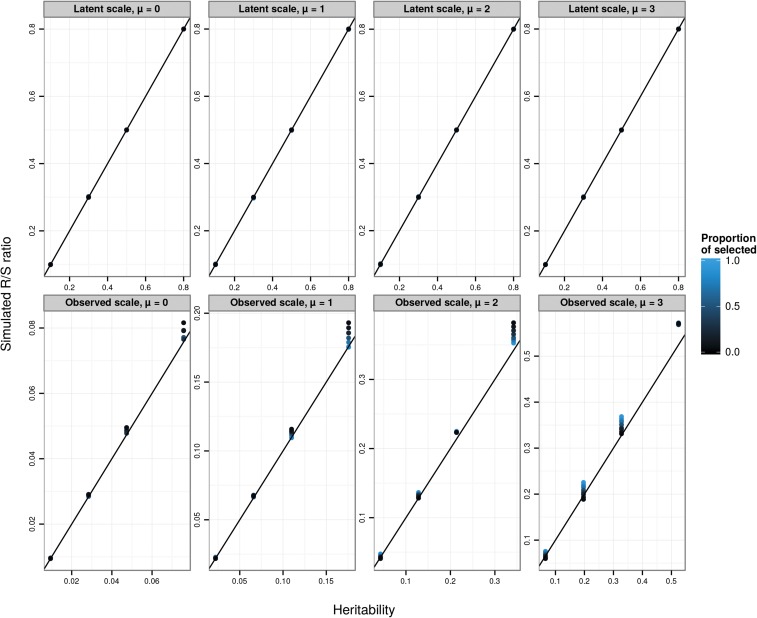
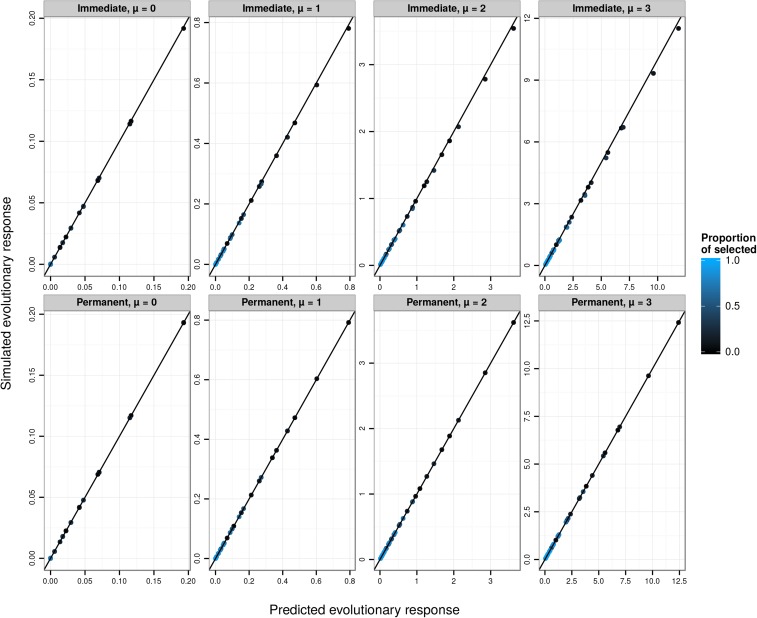
Methods for inference and interpretation of evolutionary quantitative genetic parameters, and for prediction of the response to selection, are best developed for traits with normal distributions. Many traits of evolutionary interest, including many life history and behavioral traits, have inherently nonnormal distributions. The generalized linear mixed model (GLMM) framework has become a widely used tool for estimating quantitative genetic parameters for nonnormal traits. However, whereas GLMMs provide inference on a statistically convenient latent scale, it is often desirable to express quantitative genetic parameters on the scale upon which traits are measured. The parameters of fitted GLMMs, despite being on a latent scale, fully determine all quantities of potential interest on the scale on which traits are expressed. We provide expressions for deriving each of such quantities, including population means, phenotypic (co)variances, variance components including additive genetic (co)variances, and parameters such as heritability. We demonstrate that fixed effects have a strong impact on those parameters and show how to deal with this by averaging or integrating over fixed effects. The expressions require integration of quantities determined by the link function, over distributions of latent values. In general cases, the required integrals must be solved numerically, but efficient methods are available and we provide an implementation in an R package, QGglmm. We show that known formulas for quantities such as heritability of traits with binomial and Poisson distributions are special cases of our expressions. Additionally, we show how fitted GLMM can be incorporated into existing methods for predicting evolutionary trajectories. We demonstrate the accuracy of the resulting method for evolutionary prediction by simulation and apply our approach to data from a wild pedigreed vertebrate population.
Keywords: G matrix; additive genetic variance; evolution; generalized linear model; quantitative genetics; statistics; theory.
Copyright © 2016 de Villemereuil et al.
Figures
Similar articles
-
Analogues of the fundamental and secondary theorems of selection, assuming a log-normal distribution of expected fitness.J Hered. 2019 Jul 1;110(4):396-402. doi: 10.1093/jhered/esz020. J Hered. 2019. PMID: 31259371
-
Fixed-effect variance and the estimation of repeatabilities and heritabilities: issues and solutions.J Evol Biol. 2018 Apr;31(4):621-632. doi: 10.1111/jeb.13232. Epub 2018 Feb 15. J Evol Biol. 2018. PMID: 29285829
-
Variance components analysis for pedigree-based censored survival data using generalized linear mixed models (GLMMs) and Gibbs sampling in BUGS.Genet Epidemiol. 2000 Sep;19(2):127-48. doi: 10.1002/1098-2272(200009)19:2<127::AID-GEPI2>3.0.CO;2-S. Genet Epidemiol. 2000. PMID: 10962474
-
Generalized linear mixed models: a practical guide for ecology and evolution.Trends Ecol Evol. 2009 Mar;24(3):127-35. doi: 10.1016/j.tree.2008.10.008. Trends Ecol Evol. 2009. PMID: 19185386 Review.
-
Quantitative genetic methods depending on the nature of the phenotypic trait.Ann N Y Acad Sci. 2018 Jun;1422(1):29-47. doi: 10.1111/nyas.13571. Epub 2018 Jan 24. Ann N Y Acad Sci. 2018. PMID: 29363777 Review.
Cited by
-
Direct and indirect phenotypic effects on sociability indicate potential to evolve.J Evol Biol. 2023 Jan;36(1):209-220. doi: 10.1111/jeb.14110. Epub 2022 Oct 20. J Evol Biol. 2023. PMID: 36263954 Free PMC article.
-
Genetic, maternal, and environmental influences on sociality in a pedigreed primate population.Heredity (Edinb). 2022 Oct;129(4):203-214. doi: 10.1038/s41437-022-00558-6. Epub 2022 Sep 2. Heredity (Edinb). 2022. PMID: 36056208 Free PMC article.
-
Repeatability and heritability of inhibitory control performance in wild toutouwai (Petroica longipes).R Soc Open Sci. 2023 Nov 15;10(11):231476. doi: 10.1098/rsos.231476. eCollection 2023 Nov. R Soc Open Sci. 2023. PMID: 38026029 Free PMC article.
-
Same-sex sociosexual behaviour is widespread and heritable in male rhesus macaques.Nat Ecol Evol. 2023 Aug;7(8):1287-1301. doi: 10.1038/s41559-023-02111-y. Epub 2023 Jul 10. Nat Ecol Evol. 2023. PMID: 37429903
-
Season-specific genetic variation underlies early-life migration in a partially migratory bird.Proc Biol Sci. 2024 Oct;291(2033):20241660. doi: 10.1098/rspb.2024.1660. Epub 2024 Oct 16. Proc Biol Sci. 2024. PMID: 39450599 Free PMC article.
References
-
- Ayers D. R., Pereira R. J., Boligon A. A., Silva F. F., Schenkel F. S., et al. , 2013. Linear and Poisson models for genetic evaluation of tick resistance in cross-bred Hereford x Nellor cattle. J. Anim. Breed. Genet. 130: 417–424. - PubMed
-
- Browne W. J., Subramanian S. V., Jones K., Goldstein H., 2005. Variance partitioning in multilevel logistic models that exhibit overdispersion. J. R. Stat. Soc. Ser. A Stat. Soc. 168: 599–613.
-
- Bulmer M. G., 1971. The effect of selection on genetic variability. Am. Nat. 105: 201–211.
Publication types
MeSH terms
LinkOut - more resources
Full Text Sources
Other Literature Sources
