A highly prevalent equine glycogen storage disease is explained by constitutive activation of a mutant glycogen synthase
- PMID: 27592162
- PMCID: PMC5148651
- DOI: 10.1016/j.bbagen.2016.08.021
A highly prevalent equine glycogen storage disease is explained by constitutive activation of a mutant glycogen synthase
Abstract
Background: Equine type 1 polysaccharide storage myopathy (PSSM1) is associated with a missense mutation (R309H) in the glycogen synthase (GYS1) gene, enhanced glycogen synthase (GS) activity and excessive glycogen and amylopectate inclusions in muscle.
Methods: Equine muscle biochemical and recombinant enzyme kinetic assays in vitro and homology modelling in silico, were used to investigate the hypothesis that higher GS activity in affected horse muscle is caused by higher GS expression, dysregulation, or constitutive activation via a conformational change.
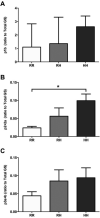
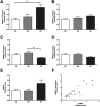
Results: PSSM1-affected horse muscle had significantly higher glycogen content than control horse muscle despite no difference in GS expression. GS activity was significantly higher in muscle from homozygous mutants than from heterozygote and control horses, in the absence and presence of the allosteric regulator, glucose 6 phosphate (G6P). Muscle from homozygous mutant horses also had significantly increased GS phosphorylation at sites 2+2a and significantly higher AMPKα1 (an upstream kinase) expression than controls, likely reflecting a physiological attempt to reduce GS enzyme activity. Recombinant mutant GS was highly active with a considerably lower Km for UDP-glucose, in the presence and absence of G6P, when compared to wild type GS, and despite its phosphorylation.
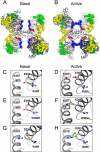
Conclusions: Elevated activity of the mutant enzyme is associated with ineffective regulation via phosphorylation rendering it constitutively active. Modelling suggested that the mutation disrupts a salt bridge that normally stabilises the basal state, shifting the equilibrium to the enzyme's active state.
General significance: This study explains the gain of function pathogenesis in this highly prevalent polyglucosan myopathy.
Keywords: Glycogen; Glycogen storage disease; Glycogen synthase; Muscle; PSSM1; Polyglucosan.
Copyright © 2016 Elsevier B.V. All rights reserved.
Figures


Similar articles
-
Glycogen content and contraction regulate glycogen synthase phosphorylation and affinity for UDP-glucose in rat skeletal muscles.Am J Physiol Endocrinol Metab. 2007 Dec;293(6):E1622-9. doi: 10.1152/ajpendo.00113.2007. Epub 2007 Sep 18. Am J Physiol Endocrinol Metab. 2007. PMID: 17878227
-
Glycogen synthase (GYS1) mutation causes a novel skeletal muscle glycogenosis.Genomics. 2008 May;91(5):458-66. doi: 10.1016/j.ygeno.2008.01.011. Epub 2008 Mar 20. Genomics. 2008. PMID: 18358695 Free PMC article.
-
Allosteric regulation of glycogen synthase controls glycogen synthesis in muscle.Cell Metab. 2010 Nov 3;12(5):456-66. doi: 10.1016/j.cmet.2010.10.006. Cell Metab. 2010. PMID: 21035757
-
Studies of gene expression and activity of hexokinase, phosphofructokinase and glycogen synthase in human skeletal muscle in states of altered insulin-stimulated glucose metabolism.Dan Med Bull. 1999 Feb;46(1):13-34. Dan Med Bull. 1999. PMID: 10081651 Review.
-
Regulation of glycogen synthase in skeletal muscle during exercise.Acta Physiol Scand. 2003 Aug;178(4):309-19. doi: 10.1046/j.1365-201X.2003.01165.x. Acta Physiol Scand. 2003. PMID: 12864735 Review.
Cited by
-
Chronic idiopathic myopathy in Icelandic horses: A case series.Equine Vet J. 2025 Sep;57(5):1341-1346. doi: 10.1111/evj.14519. Epub 2025 Apr 24. Equine Vet J. 2025. PMID: 40275651 Free PMC article.
-
Molecular Diagnosis of Panel-Based Next-Generation Sequencing Approach and Clinical Symptoms in Patients With Glycogen Storage Disease: A Single Center Retrospective Study.Front Pediatr. 2020 Dec 3;8:600446. doi: 10.3389/fped.2020.600446. eCollection 2020. Front Pediatr. 2020. PMID: 33344388 Free PMC article.
-
Muscle glycogen concentrations and response to diet and exercise regimes in Warmblood horses with type 2 Polysaccharide Storage Myopathy.PLoS One. 2018 Sep 5;13(9):e0203467. doi: 10.1371/journal.pone.0203467. eCollection 2018. PLoS One. 2018. PMID: 30183782 Free PMC article.
-
Altered mitochondrial oxidative phosphorylation capacity in horses suffering from polysaccharide storage myopathy.J Bioenerg Biomembr. 2018 Oct;50(5):379-390. doi: 10.1007/s10863-018-9768-6. Epub 2018 Aug 24. J Bioenerg Biomembr. 2018. PMID: 30143916
-
251st ENMC international workshop: Polyglucosan storage myopathies 13-15 December 2019, Hoofddorp, the Netherlands.Neuromuscul Disord. 2021 May;31(5):466-477. doi: 10.1016/j.nmd.2021.01.010. Epub 2021 Jan 23. Neuromuscul Disord. 2021. PMID: 33602551 Free PMC article. No abstract available.
References
-
- Jensen J, Lai YC. Regulation of muscle glycogen synthase phosphorylation and kinetic properties by insulin, exercise, adrenaline and role in insulin resistance. Arch Physiol Biochem. 2009;115(1):13–21. - PubMed
-
- Gregory BL, et al. Glycogen storage disease type IIIa in curly-coated retrievers. J Vet Intern Med. 2007;21(1):40–6. - PubMed
-
- Lohi H, et al. Expanded repeat in canine epilepsy. Science. 2005;307(5706):81. - PubMed
Publication types
MeSH terms
Substances
Grants and funding
LinkOut - more resources
Full Text Sources
Other Literature Sources
Molecular Biology Databases

