. 2016 Dec;44(12):1138-1155.e4.
doi: 10.1016/j.exphem.2016.08.007. Epub 2016 Aug 31.

Preclinical rationale for TGF-β inhibition as a therapeutic target for the treatment of myelofibrosis

Affiliations

Preclinical rationale for TGF-β inhibition as a therapeutic target for the treatment of myelofibrosis

Ilaria Ceglia et al. Exp Hematol. 2016 Dec.

Abstract

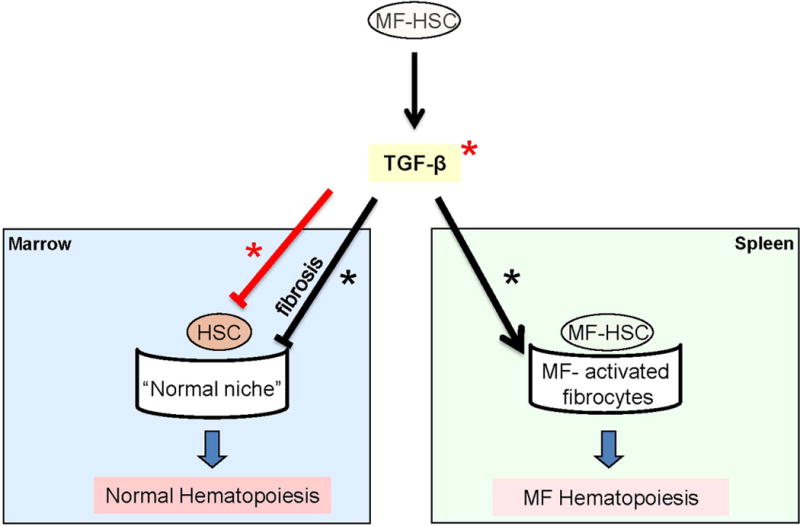
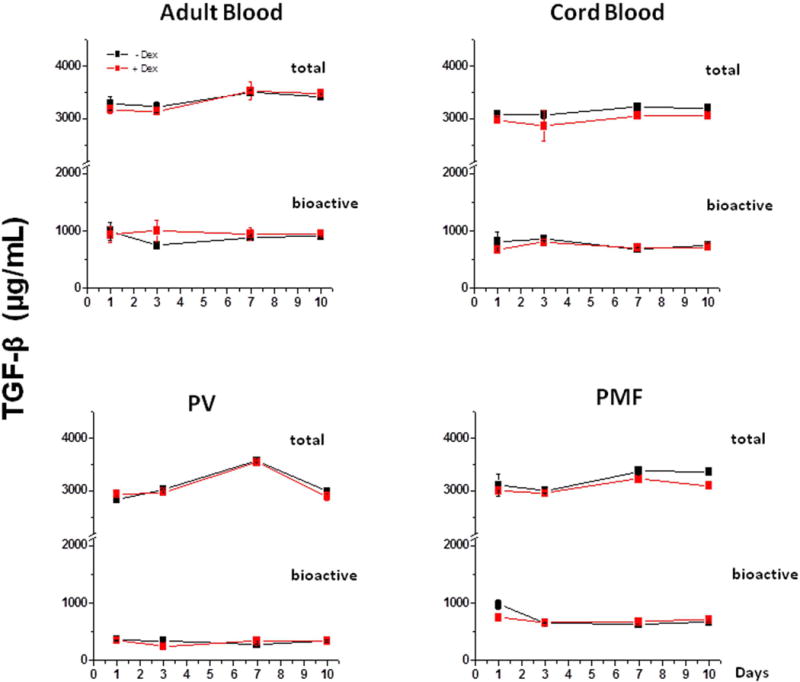
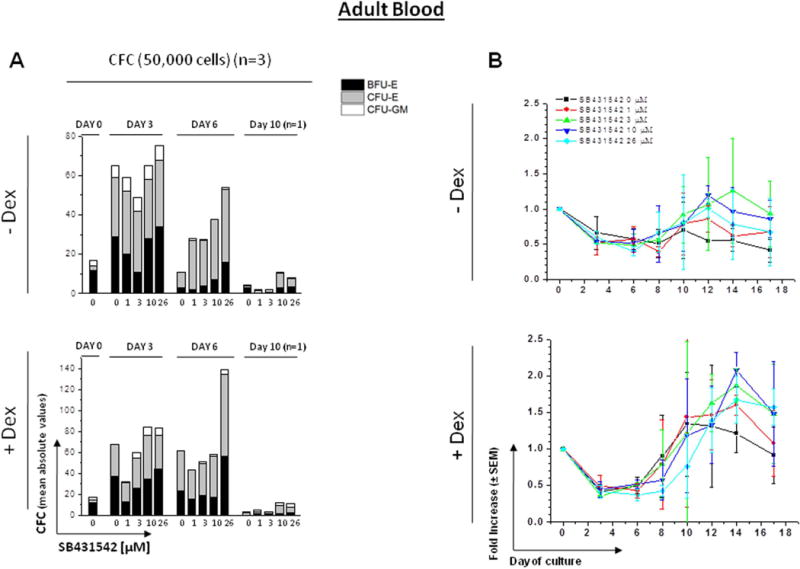
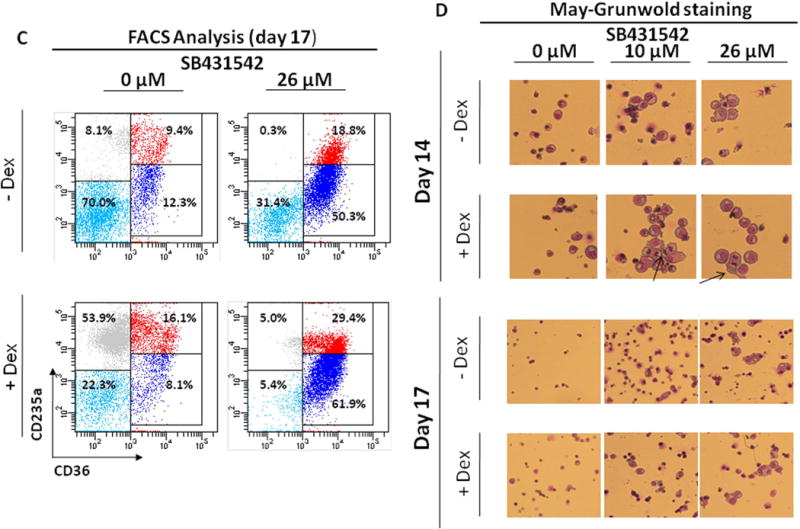
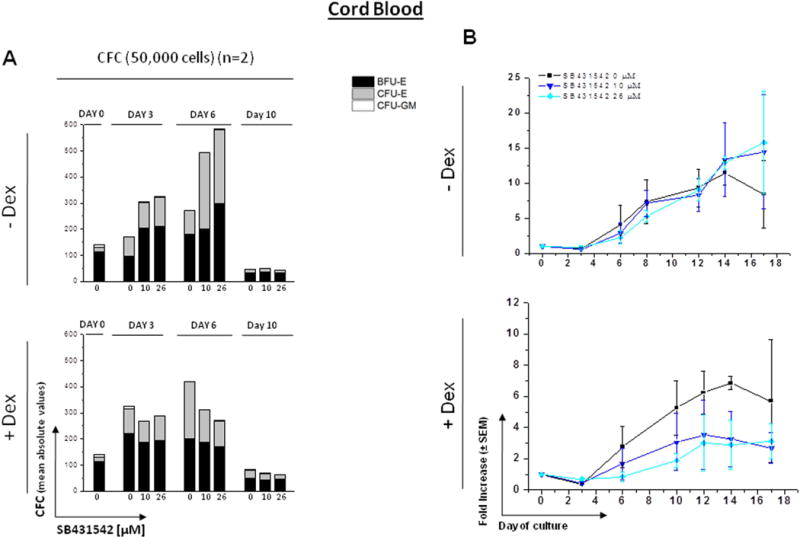
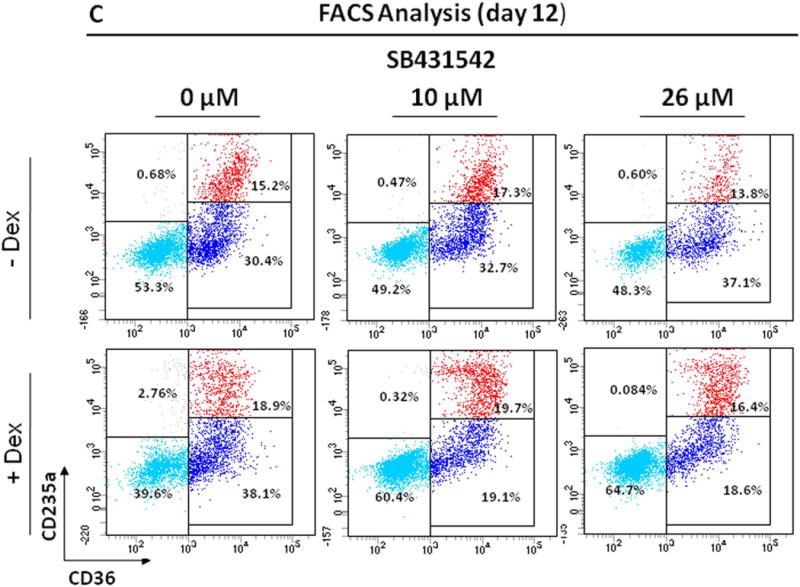
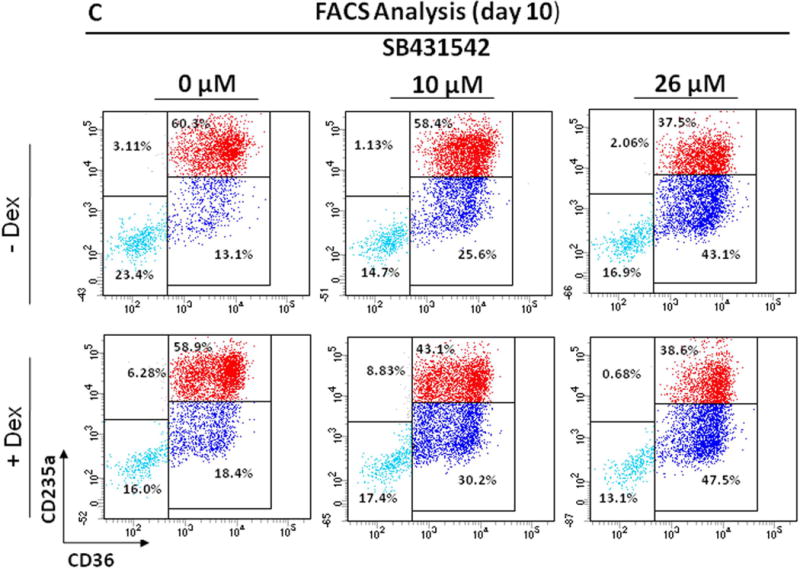
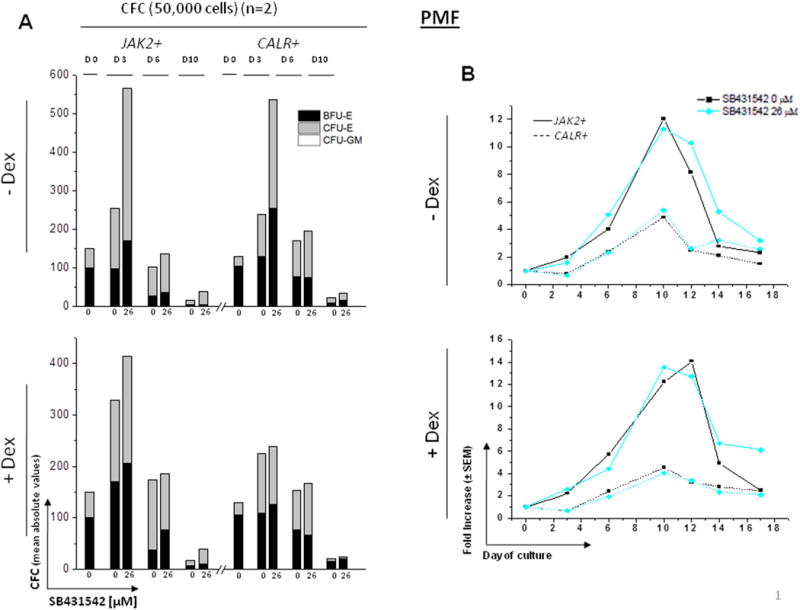
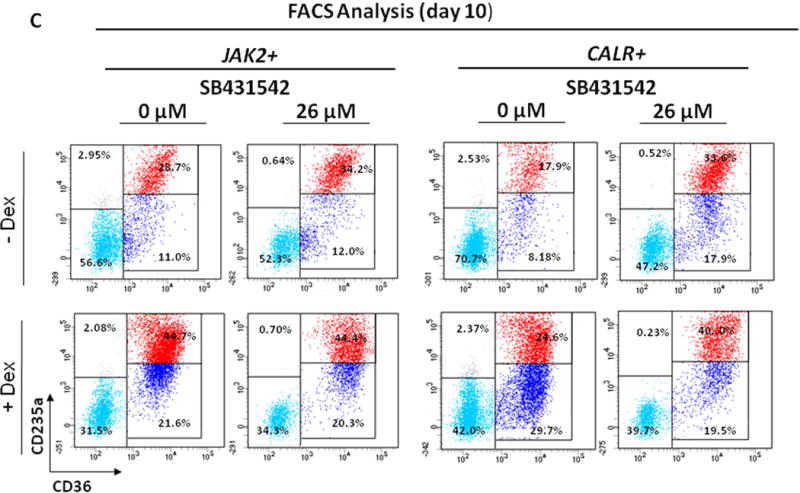
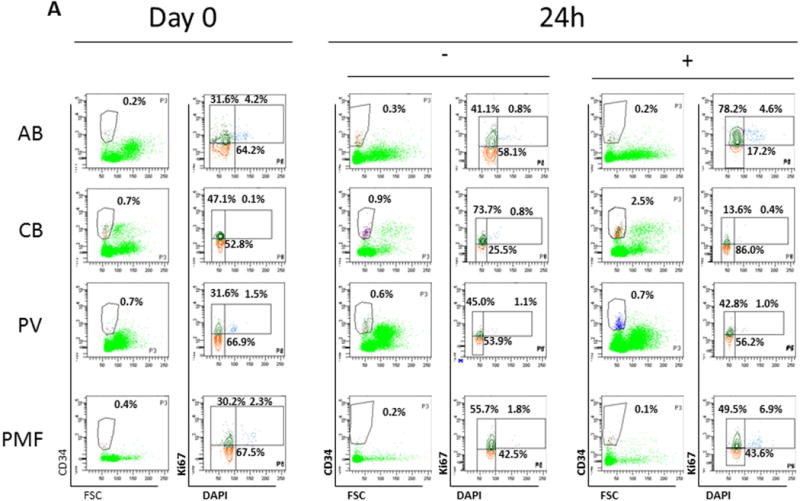
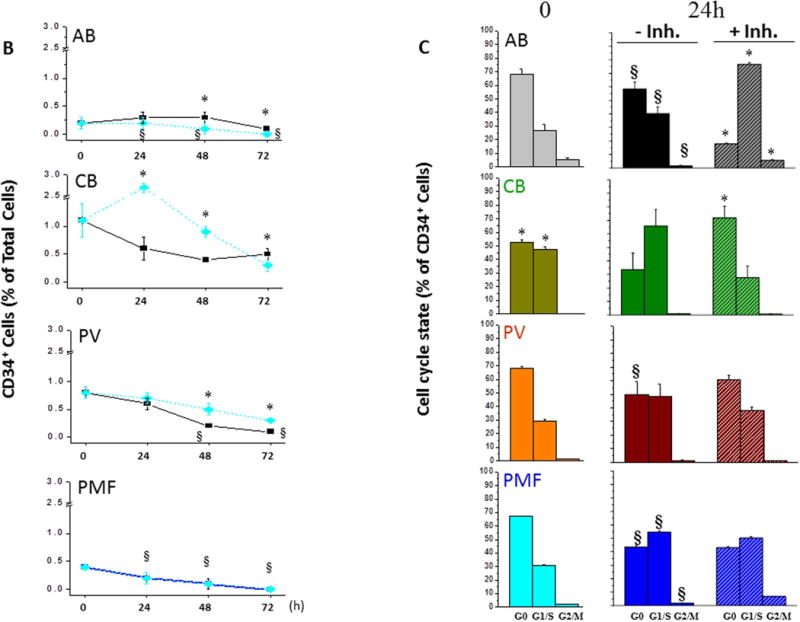
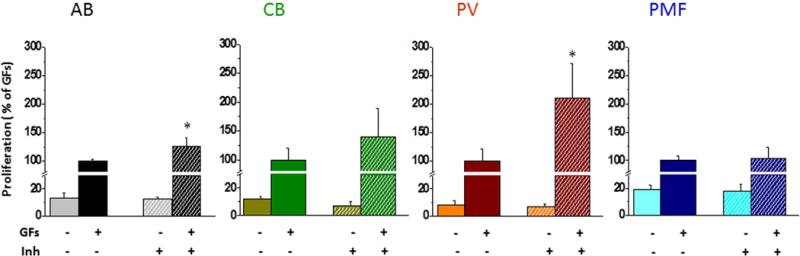
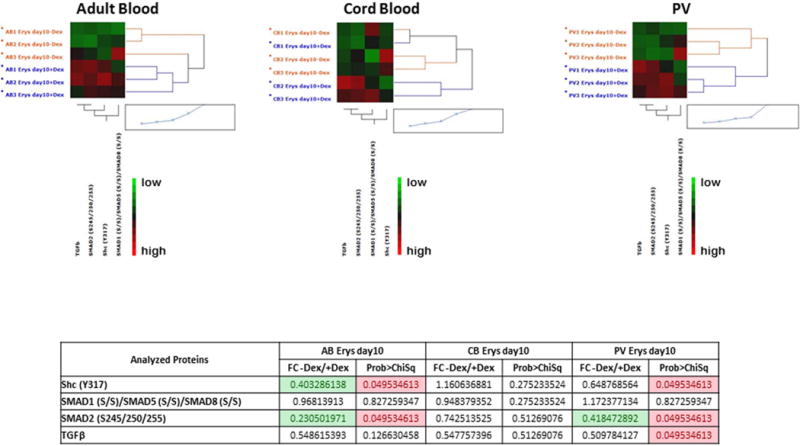
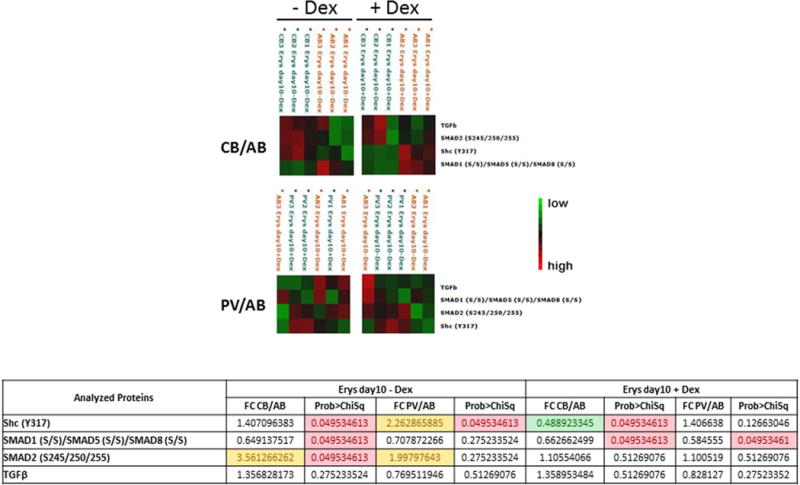
To assess the role of abnormal transforming growth factor-beta (TGF-β) signaling in the pathogenesis of primary myelofibrosis (PMF), the effects of the TGF-β receptor-1 kinase inhibitor SB431542 on ex vivo expansion of hematopoietic cells in cultures from patients with JAK2V617+-polycythemia vera (PV) or PMF (JAK2V617F+, CALRpQ365f+, or unknown) and from normal sources (adult blood, AB, or cord blood, CB) were compared. In cultures of normal sources, SB431542 significantly increased by 2.5-fold the number of progenitor cells generated by days 1-2 (CD34+) and 6 (colony-forming cells) (CB) and that of precursor cells, mostly immature erythroblasts, by days 14-17 (AB and CB). In cultures of JAK2V617F+-PV, SB431542 increased by twofold the numbers of progenitor cells by day 10 and had no effect on that of precursors cells by days 12-17 (∼fourfold increase in all cases). In contrast, SB431542 had no effect on the number of either progenitor or precursor cells in cultures of JAK2V617F+ and CALR pQ365fs+ PMF. These ontogenetic- and disease-specific effects were associated with variegation in the ability of SB431542 to induce CD34+ cells from AB (increased), CB (decreased), or PV and PMF (unaffected) into cycle and erythroblasts in proliferation (increased for AB and PV and unaffected for CB and PMF). Differences in expansion of erythroblasts from AB, CB, and PV were associated with differences in activation of TGF-β signaling (SHCY317, SMAD2S245/250/255, and SMAD1S/S/SMAD5S/S/SMAD8S/S) detectable in these cells by phosphoproteomic profiling. In conclusion, treatment with TGF-β receptor-1 kinase inhibitors may reactivate normal hematopoiesis in PMF patients, providing a proliferative advantage over the unresponsive malignant clone.


Conflict of interest statement

Disclosure of conflict of interest

The authors have no conflict of interest to declare.

Figures

Figure 1
Figure 1. Preclinical rational for TGF-β inhibition as a therapeutic target for the treatment of myelofibrosis
The overarching hypothesis is that increased production of TGF-β by the malignant cells provides a proliferative advantage to PMF HSC by inhibiting proliferation of normal HSC in the bone marrow. This inhibition is exerted both indirectly by inducing fibrosis which compromises the niches supporting normal HSC, and directly inducing normal HSC into quiescence. In addition, TGF-β indirectly supports expansion of the MF-HSC, by supporting the generation of myelofibrosis-specific HSC niches in the spleen. The splenic niches may be represented by the numerous activated fibrocytes observed in this organ from Gata1low mice and PMF patients that are observed, by electron microscopy, establishing physical contacts with hematopoietic cells with the morphology of HSCs (c-Kit+ in mice and CD34+ in human blast-like cells [4, 14]). This hypothesis is consistent with the notion that TGF-β is responsible for inducing the transition of several stromal cells into cancer-supporting activated fibrocytes in numerous experimental models [–19]. This preclinical rationale will be tested in the multi-center, phase II trial with galunisertib in PMF (MPD-RC 118). Events presumably induced through canonical and non-canonical signaling are indicated by red and black lines and events expected to be directly or indirectly inhibited by TGF-β R1 kinase inhibitors are indicated by * and *, respectively.
Figure 2
Figure 2. Levels of total and bioactive TGF-β over time in media from HEMA cultures of MNC from AB, CB, JAK2+-PV (100% allele burden) and JAK2+-PMF stimulated with (red lines) or without (black lines) Dex
Data are presented as Mean (±SEM) and are representative of one experiment performed in triplicate. The levels of TGF-β observed in the different experimental points are not statistically different (by Student’s t-test). Similar results were obtained in one additional experiment with a different AB, JAK2+-PV (allele burden unknown cultured only with Dex) and JAK2+-PMF donor.
Figure 3
Figure 3. Effect of increasing concentrations of SB431542 on the expansion of progenitor (A) and precursor (B-D) cells in HEMA cultures of MNC from Adult Blood with (bottom panel) or without (top panel) Dex
A) Cultured cells were collected at 0, 3, 6 and 10 Days of HEMA cultures of AB containing increasing concentrations of SB431542 (0, 1, 3, 10 and 26 μM) and their progenitor cell content evaluated as colony forming cells (CFC) in semisolid cultures. The columns present the total CFC numbers and the grey area within the columns the numbers of CFU-E-, BFU-E- and CFU-GM-derived colonies. Results are presented as Mean of those obtained in three separate experiments, each one with a different donor, performed in duplicate. SEMs are not indicated for clarity. Statistical analysis was performed by Student’s t-test and the results are summarized in Fig. S1. B) Cells generated by MNC from AB cultured in HEMA in the presence of increasing concentrations of SB431542 (0, 1, 3, 10 and 26 μM) over time (0, 3, 6, 8, 10, 12, 14 and 17 Days). Results are presented as fold increase with respect to Day 0 and are presented as Mean (± SEM) of three experiments each one with a different donor. Statistical analysis was performed by mixed models and Student’s t-tests and the results are summarized in Fig. S1. C) Representative flow cytometric analyses for CD36 and CD235a expression of cells from AB cultured for 17 Days in the absence or presence of Dex and treated with or without SB431542 (26 µM), as indicated. Erys were recognized and divided into distinctive maturation stages on the basis of standard criteria based on the levels of CD36pos/CD235aneg expression indicated by rectangles [32, 33]. Events indicated with light blue, blue, red and grey dots represent non-erythroid cells, proErys, basophilic/polychromatic Erys and orthochromatic Erys, respectively. The numbers near each rectangle indicate the frequency of the different populations within the analyzed population. D) May-Grunwald staining of cytospin preparations of Erys obtained at Day 14 and 17 of HEMA from AB with and without Dex in the presence of SB431542 (0, 10 or 26 μM), as indicated. The arrows in D indicate cells in metaphase. Results are representative of those observed in four experiments, one of which seeded with purified CD34+ cells. Original magnification 200x.
Figure 4
Figure 4. Effect of increasing concentrations of SB431542 on the expansion of progenitor (A) and precursor (B,C) cells in HEMA cultures of MNC from Cord Blood with (bottom panel) or without (top panel) Dex
A) Cultured cells were collected at 0, 3, 6 and 10 Days of HEMA cultures of CB containing increasing concentrations of SB431542 (0, 10 and 26 μM) and their progenitor cell content evaluated as colony forming cells (CFC) in semisolid cultures. Results are presented as Mean of those obtained in two separate experiments, each one with a different donor. Statistical analysis was performed by Student’s t-test and the results are summarized in Fig. S2. See legend to Fig. 3 for further details. B) Cells generated by MNC from CB cultured in HEMA in the presence of indicated concentrations of SB431542 (0, 10 or 26 μM) over time (0, 3, 6, 10, 12, 14 and 17 Days). Results are presented as fold increase with respect to Day 0 and are presented as Mean (± SEM) for two separated experiments each one with a different donor, performed in duplicate. Statistical analysis was performed by mixed models and Student’s t-tests and the results are summarized in Fig. S2. C) Representative flow cytometric analyses for CD36 and CD235a of cells from CB cultured for 12 Days in the absence or presence of Dex and treated with SB431542 (0, 10 or 26 μM), as indicated. Results are representative of those observed in two experiments.
Figure 5
Figure 5. Effect of SB431542 on the expansion of progenitor (A) and precursor (B,C) cells in HEMA cultures of MNC from JAK2+-PV patients with (bottom panel) or without (top panel) Dex
A) Cultured cells were collected at 0, 3, 6 and 10 Days of HEMA cultures of PV containing indicated concentrations of SB431542 (0, 10 and 26 μM) and their progenitor cell content evaluated as colony forming cells (CFC) in semisolid cultures. Results are presented as Mean of those obtained in two separate experiments, each one with a different donor (one with 67% allele burden and the other of allele burden unknown). Statistical analysis was performed by Student’s t-test and the results are summarized in Fig. S3. See legend to Fig. 3 for further details. B) Cells generated by MNC from PV patients cultured in HEMA in the presence of indicated concentrations of SB431542 (0, 10 or 26 µM) over time (0, 3, 6, 8, 12, 14 and 17 Days). Results are presented as fold increase with respect to Day 0 and are presented as Mean (± SEM) for two separated experiments (the same as in A), performed in duplicate. Statistical analysis was performed by mixed models and Student’s t-tests and the results are summarized in Fig. S3. C) Representative flow cytometric analyses for CD36 and CD235a of cells from PV patients cultured for 10 Days in the absence or presence of Dex and treated with SB431542 (0, 10 or 26 µM), as indicated. The numbers near each rectangle indicate the frequency of the different populations. Results are representative of those observed in two experiments.
Figure 6
Figure 6. Effect of SB431542 on the expansion of progenitor (A) and precursor (B,C) cells in HEMA cultures of MNC from PMF patients carrying JAK2V617F or CALRpQ365fs mutations with (bottom panel) or without (top panel) Dex
A) Cultured cells were collected at 0, 3, 6 and 10 Days of HEMA cultures of PMF containing indicated concentrations of SB431542 (0 and 26 μM) and their progenitor cell content evaluated as colony forming cells (CFC) in semisolid cultures. Results are presented as Mean of those obtained in two separate experiments, each one with a different donor. Statistical analysis was performed by Student’s t-test and the results are summarized in Fig. S4. See legend to Fig. 3 for further details. B) Cells generated by MNC from PMF patients carrying JAK2V617F (straight lines) or CALRpQ365fs (dotted lines) mutations cultured in HEMA in the presence of SB431542 (0 or 26 μM) over time (0, 3, 6, 10, 12, 14 and 17 Days). Results are presented as fold increase with respect to Day 0 and are presented as Mean (± SEM) for two separated experiments each one with a different donor. Statistical analysis was performed by mixed models and Student’s t-test and the results are summarized in Fig. S4. Similar results were obtained in two additional experiments with separate JAK2+-PMF. C) Representative flow cytometric analyses for CD36 and CD235a of cells from PMF patients cultured for 10 Days in the absence or presence of Dex and treated with SB431542 (0 or 26 µM), as indicated. Results are representative of those observed in two experiments.
Figure 7
Figure 7. Effect of SB431542 on the frequency and cell cycle state of CD34+ cells from AB, CB, PV and PMF cultured for 0, 24, 48 and 72h in HEMA
A) Representative scatter plots for forward side scatter (FSC)/CD34 staining and DAPI/Ki67 of MNC from AB, CB, PV and PMF. Cells were analysed at day 0 and after 24h of culture with (+Inh) or without (-Inh) SB431542, as indicated. The contour in the FCS/CD34 plot indicates the gating used for the cell cycle analyses by DAPI/Ki67 staining. The DAPI/Ki67 staining used to identify cells in G0 (low/low, red), G1/S (low/high, green) and G2/M (high/high) is also indicated. The numbers within the quadrant indicate the frequency of the cells in the different gating of these representative experiments. The cell cycle state of CD34+ cells at 48–72h are not presented because the data are not interpretable due to low CD34+ cell frequencies (data not shown). Results are representative of those obtained in 5–6 experiments with AB and three experiments each for CB, JAK2+-PV (allele burden unknown) and PMF (two JAK2+ and one JAK2). B) Frequency of CD34+ cells over time (0, 24, 48 and 72h) in culture of MNC from AB, CB, PV and PMF with (black line) or without (blue line) SB431542. Results are presented as Mean (±SD) of 5–6 experiments with AB and three experiments each for CB, PV and PMF. Results obtained without SB431542 are compared with those at 0h (§, p<0.01–0.0001 by paired t-test) while those obtained with SB431542 are compared to the same data-point without SB431542 (*,p<0.01–0.0001 by paired t-test). C) Frequency of CD34+ cells in G0, G1/S, G2/M at time 0 or after 24h of culture with (+inh) and without (-inh) SB431542, as indicated. Results are presented as Mean (±SD) of 5–6 experiments with AB and three experiments each for CB, PV and PMF. At 0h, * indicated values statistically different (p<0.001 by t-test) from those in AB. At 24h, results obtained without SB431542 are compared with those at 0h (§,p<0.001by paired t-test) while those obtained with SB431542 are compared to the same data-sets without SB431542 (*, p<0.001 by paired t-test).
Figure 8
Figure 8. Proliferation of Days 10 Erys from AB, CB, PV and PMF after 24h culture either in absence or in the presence of growth factors (GFs) or in the presence and absence of SB431542 (inh)
Results are expressed in percent of those observed with GFs without inhibitor and are presented as Mean (±SD) of those observed in two experiments performed in triplicate. In the case of AB (p=0.00154) and PV (p=0.00153), results obtained with GFs + SB431542 are statistically different from those observed with GFs alone (by paired t-test), as indicated by *. Proliferation in the presence of GFs alone (100%) was 0.32±0.09 for AB, 0.71±0.16 for CB, 0.30±0.07 for PV and 0.31±0.06 for PMF. The donors are the same as in Fig. 7.
Figure 9
Figure 9. Characterization of TGF-β signaling pathway in Day 10 Erys from AB, CB and JAK2+-PV by Reverse Phase Protein Array
(the complete phosphoproteomic data set is available at http://capmm.gmu.edu/data). A) Hierarchical clustering representing Erys expanded from three separate AB, CB and JAK2+-PV (allele burden 67, 88 and 94%) respectively) in cultures with (blue) or without (red) Dex (horizontal axis) and the analyzed total or phospho-proteins (vertical axis). Specific endpoint relative intensity values have been used to create the heatmap after overall standardization. Within the heatmap, red color represents higher levels of relative activity/expression; black represents intermediate levels, and green represents lower levels of relative activity/expression. The table on the bottom summarizes the results as fold-change (FC) between minus Dex/plus Dex) for each group. Fold-changes <0.5 are highlighted in green. Group mean differences statistically significant (p<0.05) are highlighted in pink. The comparison of data from PV with and without Dex was already reported [34]. B) Hierarchical clustering representing Erys expanded from three separate AB with (left panels) and without (right panel) Dex with respect to the same cells obtained under the same conditions from CB (top panels) or JAK2+-PV (the same donors as in A) (horizontal axis) and the analyzed total or phospho-proteins (vertical axis). See legend to Fig. 9A for further detail. Fold-changes (FC) between CB and AB and PV and AB obtained minus Dex and plus Dex are summarized in the Table on the bottom. Fold-changes <0.5 or <1.5 are highlighted in green and yellow, respectively. Group mean differences statistically significant (p<0.05) are highlighted in pink. The comparison of data obtained from AB and PV with Dex was already reported [34].

References

    1. Schmitt A, Jouault H, Guichard J, Wendling F, Drouin A, Cramer E-M. Pathologic interaction between megakaryocytes and polymorphonuclear leukocytes in myelofibrosis. Blood. 2000;96:1342–1347. - PubMed
    1. Ciurea SO, Merchant D, Mahmud N, et al. Pivotal contributions of megakaryocytes to the biology of idiopathic myelofibrosis. Blood. 2007;110:986–993. - PMC - PubMed
    1. Campanelli R, Rosti V, Villani L, et al. Evaluation of the bioactive and total transforming growth factor β1 levels in primary myelofibrosis. Cytokine. 2011;53:100–106. - PubMed
    1. Zingariello M, Martelli F, Ciaffoni F, et al. Characterization of the TGF-beta1 signaling abnormalities in the Gata1low mouse model of myelofibrosis. Blood. 2013;121:3345–3363. - PMC - PubMed
    1. Chagraoui H, Komura E, Tulliez M, Giraudier S, Vainchenker W, Wendling F. Prominent role of TGF-beta 1 in thrombopoietin-induced myelofibrosis in mice. Blood. 2002;100:3495–3503. - PubMed

MeSH terms