. 2017 Jan;66(1):102-115.
doi: 10.1016/j.jhep.2016.08.012. Epub 2016 Sep 1.

Cholangiocarcinoma stem-like subset shapes tumor-initiating niche by educating associated macrophages

Affiliations

Cholangiocarcinoma stem-like subset shapes tumor-initiating niche by educating associated macrophages

Chiara Raggi et al. J Hepatol. 2017 Jan.

Abstract

Background & aims: A therapeutically challenging subset of cells, termed cancer stem cells (CSCs) are responsible for cholangiocarcinoma (CCA) clinical severity. Presence of tumor-associated macrophages (TAMs) has prognostic significance in CCA and other malignancies. Thus, we hypothesized that CSCs may actively shape their tumor-supportive immune niche.

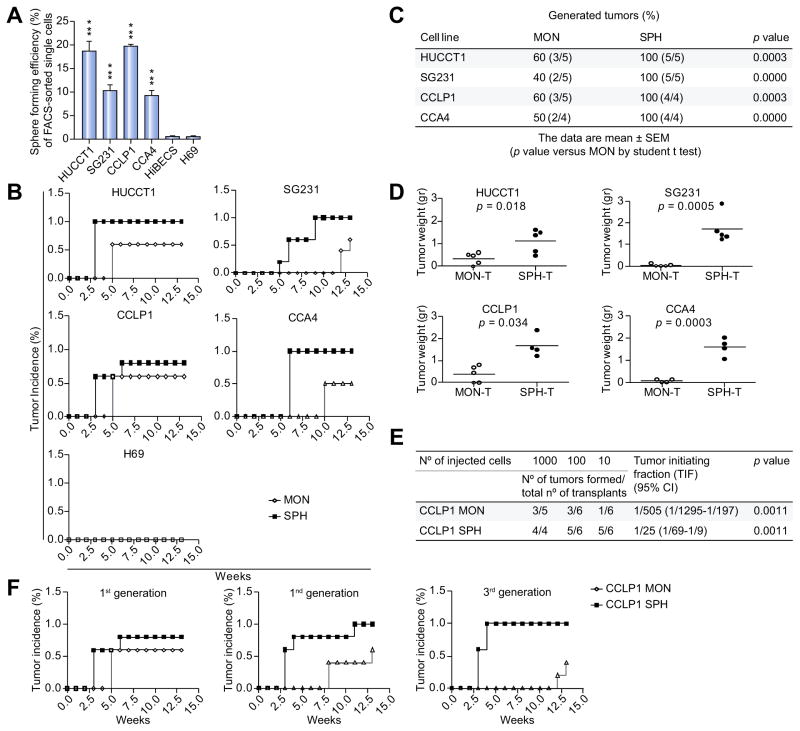
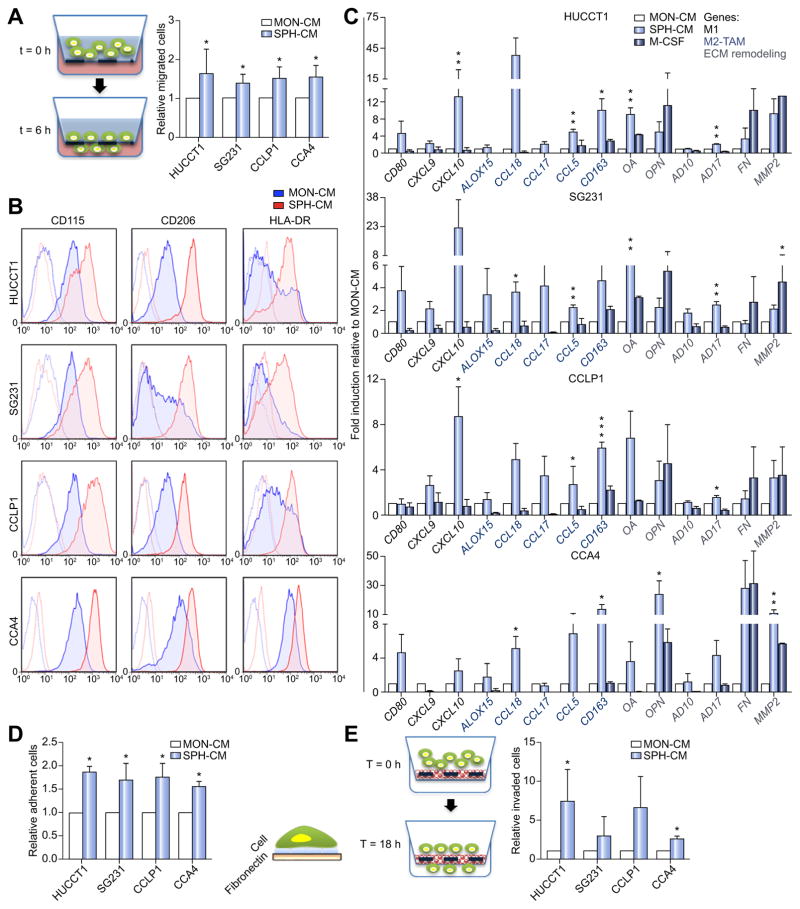
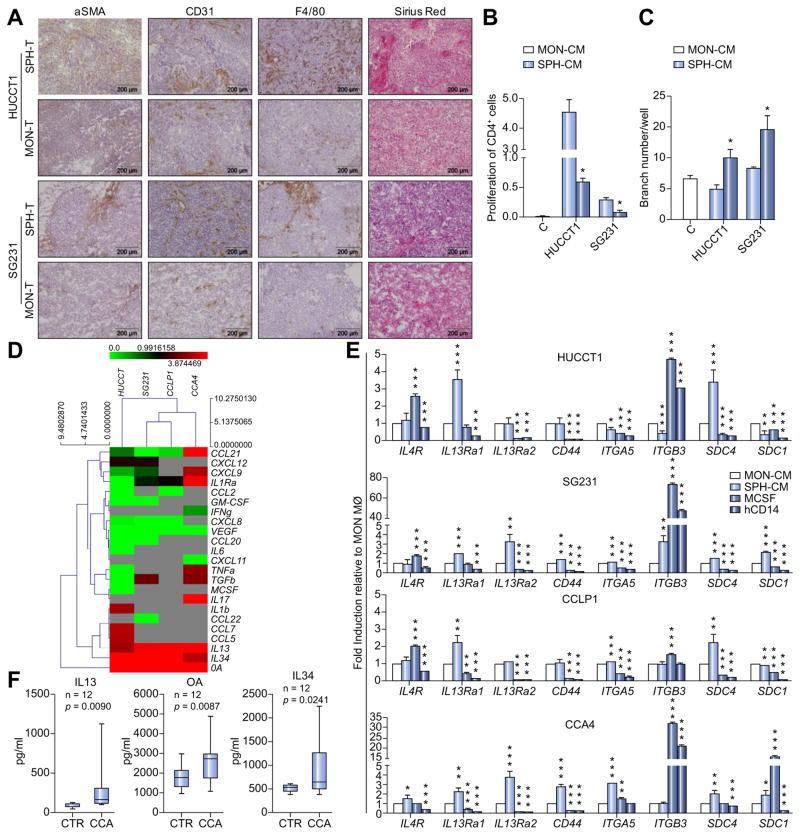
Methods: CCA cells were cultured in 3D conditions to generate spheres. CCA sphere analysis of in vivo tumorigenic-engraftment in immune-deficient mice and molecular characterization was performed. The in vitro and in vivo effect of CCA spheres on macrophage precursors was tested after culturing healthy donor cluster of differentiation (CD)14+ with CCA-sphere conditioned medium.

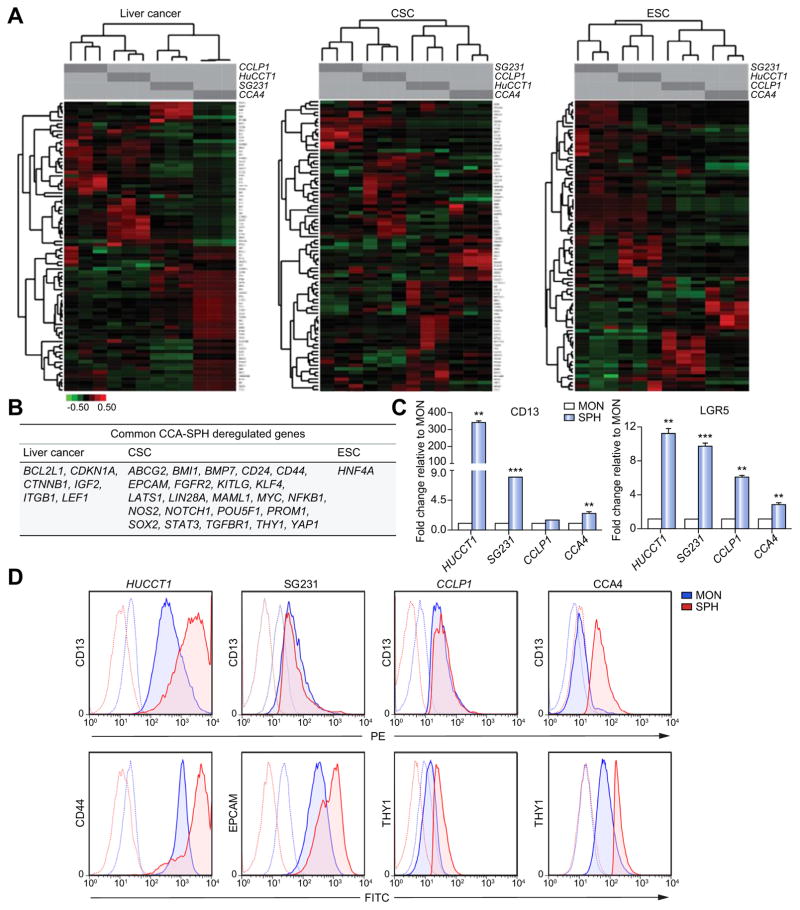
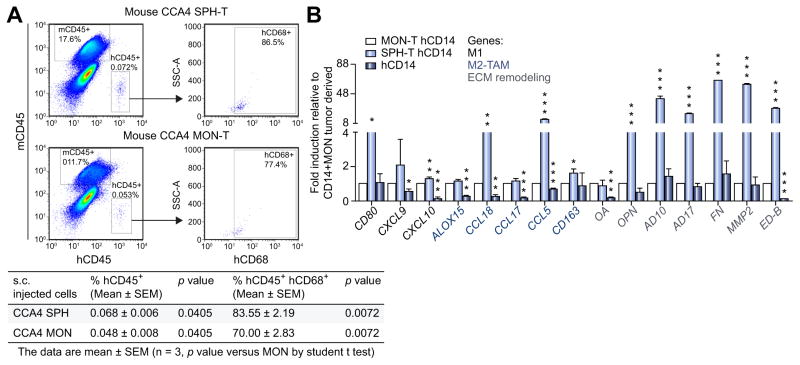
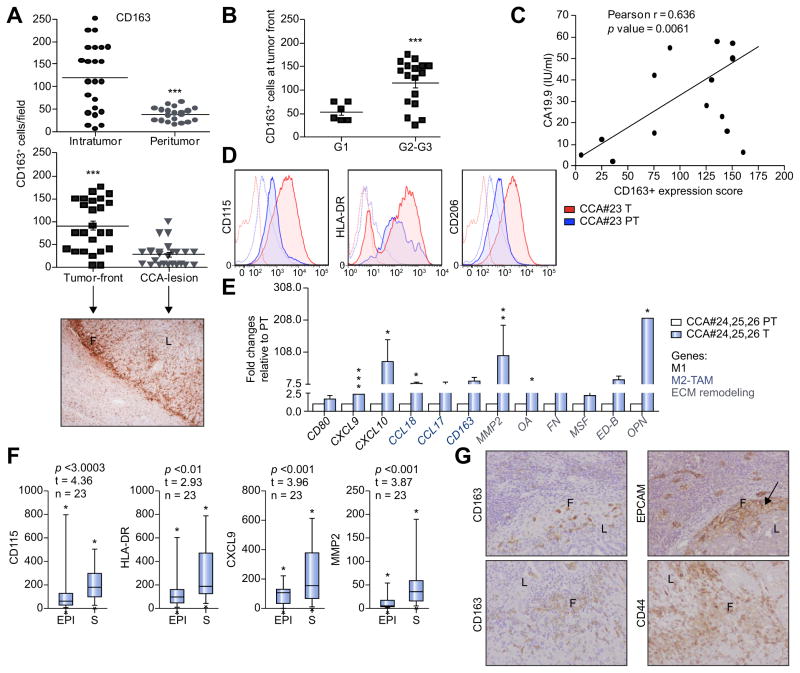
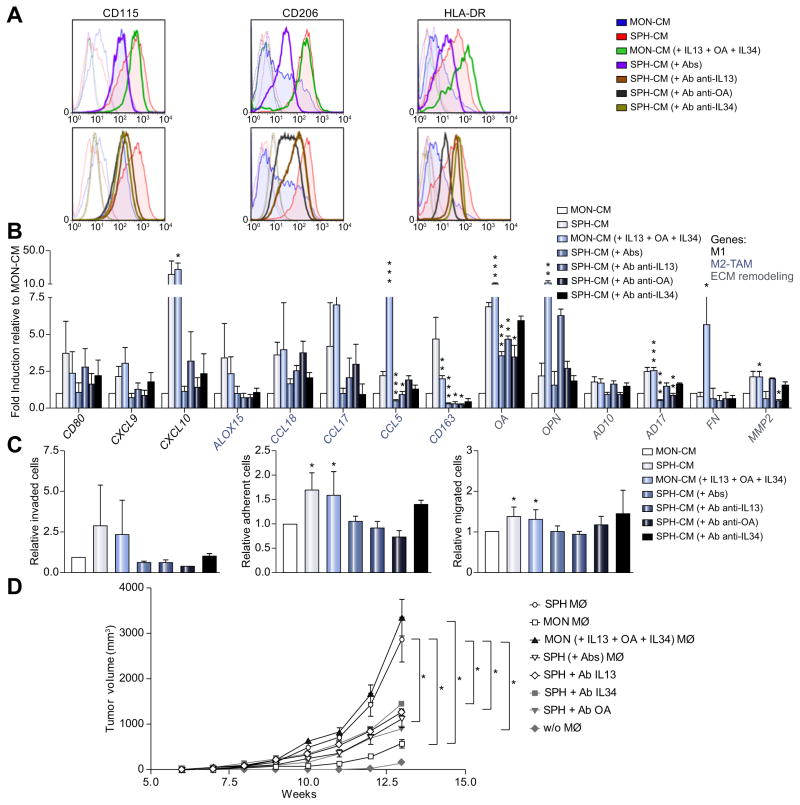
Results: CCA spheres engrafted in 100% of transplanted mice and revealed a significant 20.3-fold increase in tumor-initiating fraction (p=0.0011) and a sustained tumorigenic potential through diverse xenograft-generations. Moreover, CCA spheres were highly enriched for CSC, liver cancer and embryonic stem cell markers both at gene and protein levels. Next, fluorescence-activated cell sorting analysis showed that in the presence of CCA sphere conditioned medium, CD14+ macrophages expressed key markers (CD68, CD115, human leukocyte antigen-D related, CD206) indicating that CCA sphere conditioned medium was a strong macrophage-activator. Gene expression profile of CCA sphere activated macrophages revealed unique molecular TAM-like features confirmed by high invasion capacity. Also, freshly isolated macrophages from CCA resections recapitulated a similar molecular phenotype of in vitro-educated macrophages. Consistent with invasive features, the largest CD163+ set was found in the tumor front of human CCA specimens (n=23) and correlated with a high level of serum cancer antigen 19.9 (n=17). Among mediators released by CCA spheres, only interleukin (IL)13, IL34 and osteoactivin were detected and further confirmed in CCA patient sera (n=12). Surprisingly, a significant association of IL13, IL34 and osteoactivin with sphere stem-like genes was provided by a CCA database (n=104). In vitro combination of IL13, IL34, osteoactivin was responsible for macrophage-differentiation and invasion, as well as for in vivo tumor-promoting effect.

Conclusion: CCA-CSCs molded a specific subset of stem-like associated macrophages thus providing a rationale for a synergistic therapeutic strategy for CCA-disease.

Lay summary: Immune plasticity represents an important hallmark of tumor outcome. Since cancer stem cells are able to manipulate stromal cells to their needs, a better definition of the key dysregulated immune subtypes responsible for cooperating in supporting tumor initiation may facilitate the development of new therapeutic approaches. Considering that human cholangiocarcinoma represents a clinical emergency, it is essential to move to predictive models in order to understand the adaptive process of macrophage component (imprinting, polarization and maintenance) engaged by tumor stem-like compartment.

Keywords: Cancer stem cells; Cholangiocarcinoma; Tumor-associated macrophages.


Conflict of interest statement

Conflict of interest

The authors who have taken part in this study declared that they do not have anything to disclose regarding funding or conflict of interest with respect to this manuscript.

Figures

Fig. 1
Fig. 1. CCA self-renewal capacity in vitro and tumorigenic potential in vivo
(A) Sphere-forming efficiency (SFE) of CCAs (HUCCT1, SG231, CCLP1, CCA4) and normal cholangiocytes (HiBECs, H69) calculated by dividing the sphere number by number of single cells seeded and expressed as a percentage. Mean ± SEM (n = 4, p value vs. H69 and human intrahepatic biliary epithelial cells (HiBECS) by Student’s t test, ***p ≤0.001). Sphere tumorigenic capacity in NSG mice: (B) Tumor growth kinetic (n = 5), (C) frequency and (D) weight of generated tumors at 13 weeks after subcutaneous injection into NSG mice of 1000 SPH/MON isolated cells as monitored by weekly palpation. Mean ± SEM (p value vs. MON-T by Student’s t test). (E) Self-renewing CCLP1 cells calculated by ELDA program (see Methods section) (p value vs. MON tumor-initiating fraction (TIF) by Student’s t test). (F) Serial transplantations of 1000 CCLP1 SPH/MON cells into flanks of NSG mice (n = 4).
Fig. 2
Fig. 2. Molecular properties of CCA spheres
(A) Pathway-focused qRT-PCR arrays. Hierarchical clustering distinguished each CCA-SPH type based on significant gene expression compared to CCA-MON. Data first centered and normalized, then clustered using centered correlation metrics with complete linkage. Dendrograms depict similarity of individual genes and cases. Right side indicates clusters of coordinately expressed genes with higher expression levels in CCA-SPH than CCA-MON. Relative gene expression level depicted according to the scale bar. (B) List of commonly upregulated genes in SPH of all CCA cell lines. Genes divided according to pathway of belonging. (C) Relative expression of CD13 and LGR5 transcript-encoding markers. glyceraldehyde 3-phosphate dehydrogenase (GAPDH) as internal control. All mRNA levels are presented as fold changes normalized to 1 (mean expression of monolayer). Mean ± SEM (n = 3, p value vs. MON by Student’s t test, *p ≤0.05, **p ≤0.01, ***p ≤0.001). (D) FACS-profile of CD44, CD13, THY, EPCAM.
Fig. 3
Fig. 3. Effect of CCA stem-like cells on macrophage precursors
(A) Migrated CD14+ towards SPH-CM (6 h). Relative migrated CD14+ cells normalized to migrated CD14+ in presence of MON-CM. Mean ± SEM (n = 3, p value vs. MON). (B) FACS-profile of CD115, HLA-DR and CD206 expression in macrophages obtained by culture of CD14+ with SPH- and MON-CM. Histograms represent three independent experiments with macrophage from three different healthy donors. (C) Relative expression of M1/M2 and matrix remodeling-related genes. As control macrophage-differentiated with M-CSF. GAPDH as internal control. All mRNA levels presented as fold changes normalized to 1 (n = 3). (D) Adhesion assay using FN-supports. Cells counted and normalized to MON macrophages (n = 3). (E) SPH macrophage-invasion assay using Matrigel-coated transwells. Cells counted and normalized to migrated MON macrophages (n = 5). Mean ± SEM (p value vs. MON macrophage by Student’s t test, *p ≤0.05, **p ≤0.01, ***p ≤0.001).
Fig. 4
Fig. 4. Evaluation of TAM-infiltration in mouse model
(A) FACS-profile of mouse CD45, human CD45+ CD68+ cells in isolated mononucleate subset from CCA4-SPH-T and CCA4-MON-T. Representative dot plots and table with percent of human CD45 CD68 double positive cells determined by FACS. Data are mean ± SEM (n = 3, p value vs. MON-injected mice by Student’s t test). (B) Relative gene expression of human CD14+ isolated from CCA4-T. As control, human CD14+. Human GAPDH as internal control. All mRNA levels presented as fold changes normalized to 1 (mean expression of CCA4 MON-T CD14+ cells). Mean ± SEM (n = 3, p value vs. MON-T CD14+ cells). Student’s t test, *p ≤0.05, **p ≤0.01, ***p ≤0.001.
Fig. 5
Fig. 5. Evaluation of TAM-infiltration in human CCA samples
(A) Quantification of CD163+ cells in both CCA intratumoral (T) and peritumoral (PT) regions. Mean ± SEM (n = 23, p value vs. PT). Distribution of CD163+ cells in CCA lesion (L) and tumor front (F) shown by a representative image and corresponding quantification. Mean ± SEM (n = 23, p value vs. F). (B) Correlation of % CD163+ cells tumor grade (G) (n = 25, Supplementary Table 2, one-sided Student’s t test applied to log ratios in order to compare G1 to G2–G3). (C) Cancer antigen 19.9 serum levels in CCA patients (n = 17, Supplementary Table 2, Pearson correlation between two parameters was calculated using R and the cor.test function, yielding correlation coefficients and p values). (D) Expression of CD115, HLA-DR and CD206 in CCA-infiltrated macrophages by FACS included both CCA T and PT regions. Representative histograms of CCA#23 patient. (E) Relative expression of M1/M2 and matrix remodeling-related genes. GAPDH as internal control. All mRNA levels displayed as fold changes normalized to 1 (mean expression of PT-macrophages). Histograms represent the average of three different CCA patients (#24, #25, #26 patients). Mean ± SEM (n = 3, p value vs. PT). (F) Gene expression evaluated in a set of CCA patients (n = 23) where paired intratumoral epithelial (EPI) and stromal compartments (S) obtained by laser micro-dissection. Student’s t test, *p ≤0.05, **p ≤0.01, ***p ≤0.001. (G) Representative images for IHC analysis of CD163 and CSC-related markers (CD44, EPCAM) in CCA sections (20x) (CCA lesion (L) and tumor front (F)).
Fig. 6
Fig. 6. SPH-specific production of bioactive molecules
(A) Representative images show immunohistochemistry of α-SMA, CD31, F4/80 and Sirius Red staining for collagen on SPH and MON tumor sections. Scale bar: 200 μm. (B) Effect of SPH- and MON-CM on CD4+ cells proliferation. CD4+ without stimulation used as control. Data presented as % of proliferating CD4+ cells. Mean ± SEM (n = 3, p value vs. MON-CM by Student’s t test, *p ≤0.05, **p ≤0.01, ***p ≤0.001). (C) Effect of SPH- and MON-CM on HUVEC tube formation. HUCCT1 and SG231 MON- and SPH-CM were added to the medium of HUVEC to assay their effect on the tube formation ability of HUVEC. Data presented as number of branches/well. Mean ± SEM (n = 3, p value vs. MON-CM by Student’s t test, *p ≤0.05, **p ≤0.01, ***p ≤0.001). (D) Heat map representation of soluble mediators released by SPH and MON (ELISA). Concentration as pg/ml. Molecules clustered with names shown on right of heat map. Each raw corresponds to a single compound, and each column represents an independent condition. Heat map color scale corresponds to relative molecule expression (on the top, minimum and maximum of all values). Results are average of three independent experiments. (E) Relative expression of transcript-encoding receptors for IL4 (IL4-R), IL13 (IL13Ra1, IL13Ra2), OA (CD44, ITGA5, ITGB3, SDC4) and IL34 (SDC1) in SPH and MON macrophage. CD14+ cells as well M-CSF derived macrophage, as controls. GAPDH as internal control. All mRNA levels are presented as fold changes normalized to 1 (mean expression of MON macrophage). (F) IL13, OA and IL34 levels in CCA patients (n = 12) and controls (CTR) (n = 12) serum levels. Data are mean ± SEM (p value vs. MON macrophage by Student’s t test, *p ≤0.05, **p ≤0.01, ***p ≤0.001). MØ, macrophage.
Fig. 7
Fig. 7. IL13, OA, IL34 combination mimics SPH-like effects on macrophage-differentiation and monocyte recruitment
(A) FACS-profile of CD115, HLA-DR and CD206 expression in macrophages obtained by CD14+ cultured in presence of IL13 (80 pg/ml), OA (0.9 ng/ml) and IL34 (80 pg/ml), added to the MON-CM (green). Inhibitory impact of human antibodies anti-IL13 (800 ng/ml, 10,000x), OA (2700 ng/ml, 3000x), IL34 (800 ng/ml, 10,000x) alone (in brown, dark grey and dark green, respectively) or in combination was shown (violet). Effects of both SPH- (red) and MON- (blue) CM also shown. Histograms represent three independent experiments using macrophage from three different healthy donors. (B) Relative expression of M1/M2 and matrix remodeling-related genes. GAPDH as internal control. All mRNA levels displayed as fold changes normalized to 1 (mean expression of MON macrophage) (n = 3). Mean ± SEM (p value vs. MON- or SPH-CM by Student’s t test, *p ≤0.05, **p ≤0.01, ***p ≤0.001). (C) Invasion and adhesion assay with fibronectin supports. Cells counted normalized to MON macrophages (n = 5). Migration assay of monocytes. Monocytes counted and normalized to monocyte migrated in presence of MON-CM (n = 5). Mean ± SEM (p value vs. MON- or SPH-CM by Student’s t test, *p ≤0.05, **p ≤0.01, ***p ≤0.001). (D) macrophage-role in supporting in vivo tumorigenicity. 1000 MONs (SG231) co-injected with 300 in vitro-educated macrophages into NSG mice. Tumor growth evaluated. Mean ± SEM (n = 5, p value vs. MON or SPH macrophage at week 13 by Student’s t test, *p ≤0.05, **p ≤0.01, ***p ≤0.001). MØ, macrophage.

References

    1. Andersen JB, Spee B, Blechacz BR, Avital I, Komuta M, Barbour A, et al. Genomic and genetic characterization of cholangiocarcinoma identifies therapeutic targets for tyrosine kinase inhibitors. Gastroenterology. 2012;142:1021–1031. e1015. - PMC - PubMed
    1. Blechacz B, Gores GJ. Cholangiocarcinoma: advances in pathogenesis, diagnosis, and treatment. Hepatology. 2008;48:308–321. - PMC - PubMed
    1. Raggi C, Invernizzi P, Andersen JB. Impact of microenvironment and stem-like plasticity in cholangiocarcinoma: molecular networks and biological concepts. J Hepatol. 2015;62:198–207. - PubMed
    1. Banales JM, Cardinale V, Carpino G, Marzioni M, Andersen JB, Invernizzi P, et al. Expert consensus document: Cholangiocarcinoma: current knowledge and future perspectives consensus statement from the European Network for the Study of Cholangiocarcinoma (ENS-CCA) Nat Rev Gastroenterol Hepatol. 2016;13:261–280. - PubMed
    1. Lin G, Liu Y, Li S, Mao Y, Wang J, Shuang Z, et al. Elevated neutrophil-to-lymphocyte ratio is an independent poor prognostic factor in patients with intrahepatic cholangiocarcinoma. Oncotarget. 2016;7:50963–50971. - PMC - PubMed

Publication types