. 2016 Sep 12;38(5):478-92.
doi: 10.1016/j.devcel.2016.08.002. Epub 2016 Sep 1.

Congenital Heart Disease Genetics Uncovers Context-Dependent Organization and Function of Nucleoporins at Cilia

Affiliations

Congenital Heart Disease Genetics Uncovers Context-Dependent Organization and Function of Nucleoporins at Cilia

Florencia Del Viso et al. Dev Cell. .

Abstract

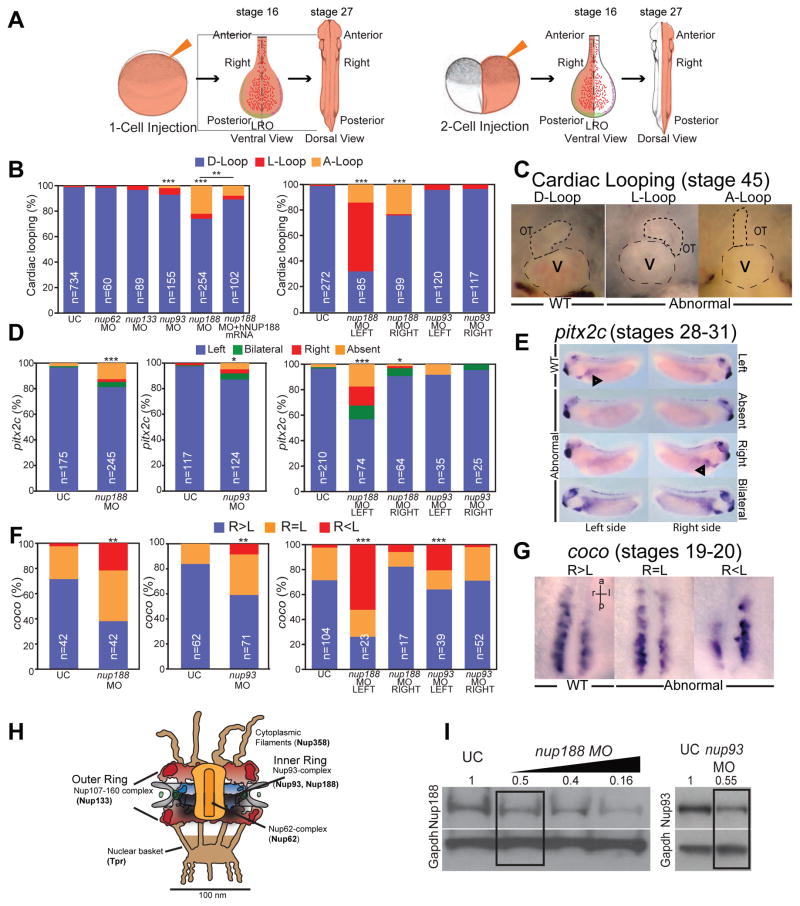
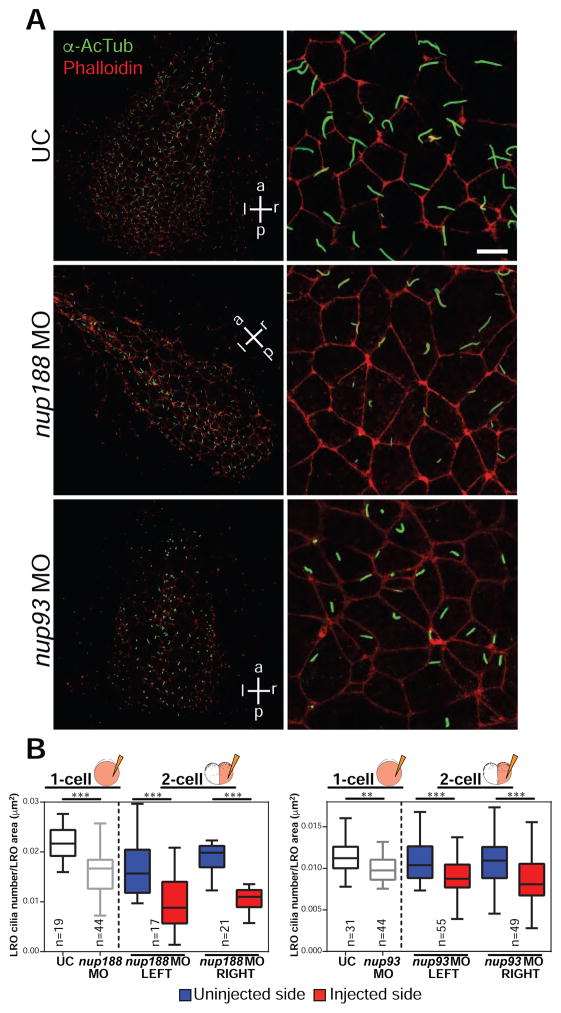
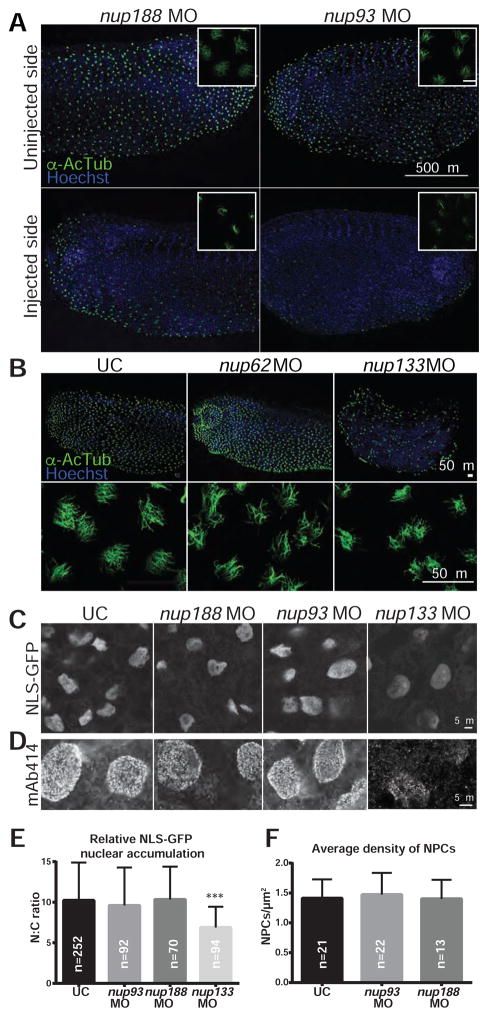
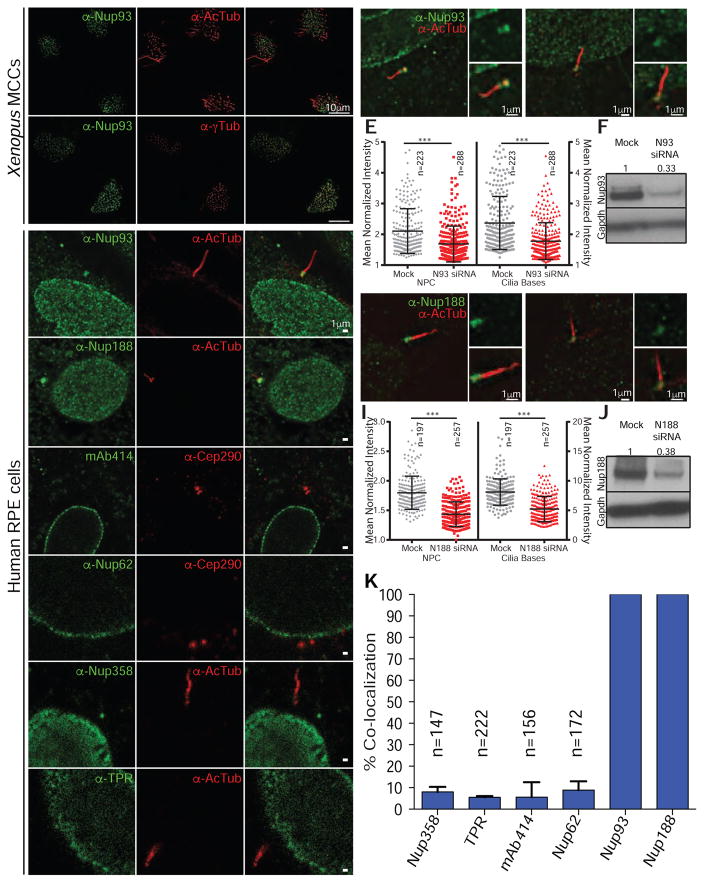
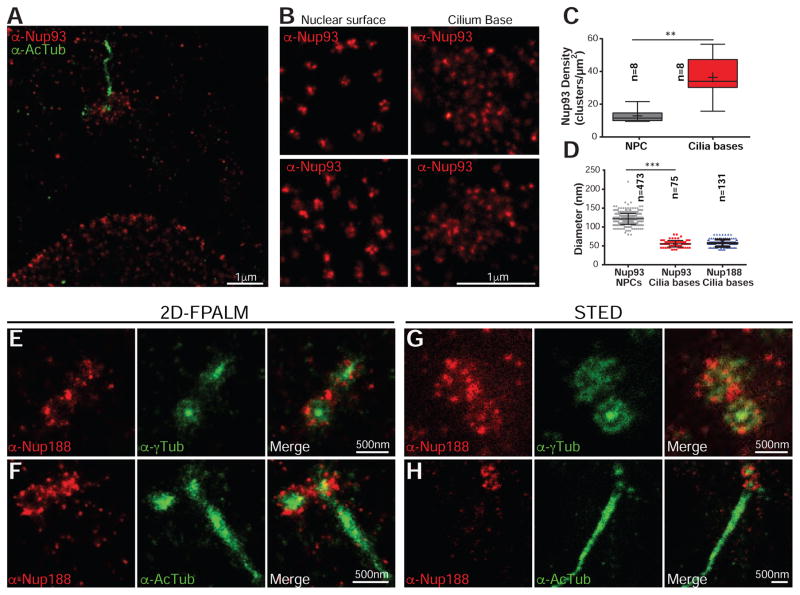
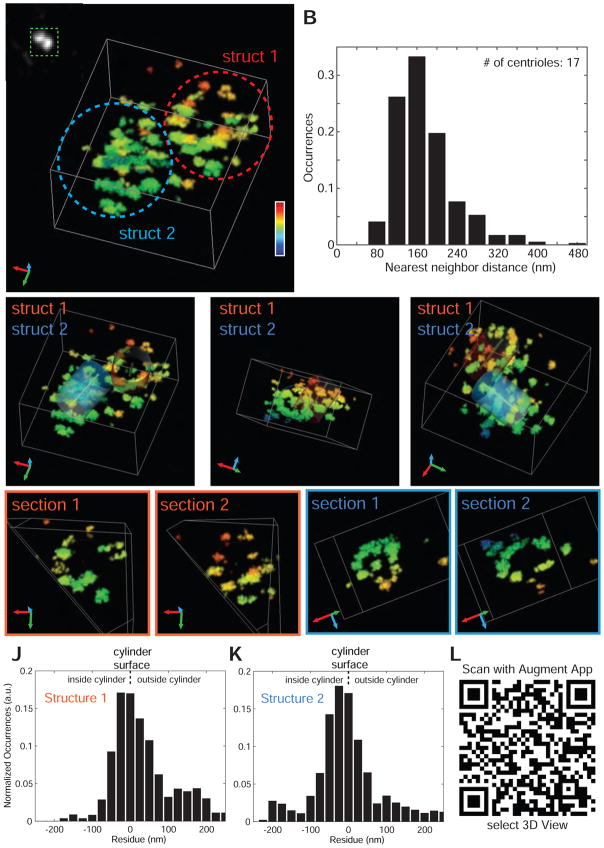
Human genomics is identifying candidate genes for congenital heart disease (CHD), but discovering the underlying mechanisms remains challenging. In a patient with CHD and heterotaxy (Htx), a disorder of left-right patterning, we previously identified a duplication in Nup188. However, a mechanism to explain how a component of the nuclear pore complex (NPC) could cause Htx/CHD was undefined. Here, we show that knockdown of Nup188 or its binding partner Nup93 leads to a loss of cilia during embryonic development while leaving NPC function largely intact. Many data, including the localization of endogenous Nup188/93 at cilia bases, support their direct role at cilia. Super-resolution imaging of Nup188 shows two barrel-like structures with dimensions and organization incompatible with an NPC-like ring, arguing against a proposed "ciliary pore complex." We suggest that the nanoscale organization and function of nucleoporins are context dependent in a way that is required for the structure of the heart.

Keywords: 3D nanoscopy; Xenopus tropicalis; congenital heart disease; heterotaxy; left-right patterning; nuclear pore complex; nucleoporin; super-resolution.


Figures

Figure 1
Figure 1. Depletion of inner ring nups alters LR patterning
(A) 1- (left) and 2-cell (right) injection schematic (not to scale) showing a salmon colored dye as a tracer. When injections are done in one cell at 2-cell stage, embryos are selected where either the left or the right side of the embryo is targeted, as shown in the diagram of dissected LRO (stage 16) or in a later stage 27 embryo. Small red lines in LRO represent cilia. (B) Percentage of embryos with abnormal cardiac looping (see Figure 1C for key to score cardiac looping) after MO injection at 1-cell stage (left) or 2-cell stage (right). nup188 morphant heart looping defects are rescued by human NUP188 expression (left). n=total number of embryos from 3 independent experiments. Chi-square/Fisher’s Exact Test, *** p<0.0005, ** p<0.005. UC – uninjected controls. (C) Examples of cardiac looping phenotypes of WT and abnormal Xenopus hearts at stage 45 viewed ventrally with anterior to the top. D-Loop: normal outflow track (OT) loops right (short dashed line), L-Loop: abnormal OT loops left, A-Loop: abnormal OT is unlooped. V, ventricle is indicated by long dashed line. (D) Percentage of embryos with abnormal pitx2c (see Figure 1E for key to score pitx2c staining) after MO injection at 1-cell stage (left, middle) or 2-cell stage (right). n=total number of embryos from 3 independent experiments. Chi-square/Fisher’s Exact Test, *** p<0.0005, * p<0.05. (E) Example key of pitx2c expression showing lateral views of embryos (stages 28–31) with dorsal at top. Arrowheads point to pitx2c in the lateral plate mesoderm. (F) Percentage of embryos with abnormal coco expression (see Figure 1G for key for coco scoring) after MO injection at 1-cell stage (left, middle) or 2-cell stage (right). L, R are left and right side of LRO, respectively. n=total number of embryos from 3 independent experiments. Chi-square/Fisher’s Exact Test, *** p<0.0005, ** p<0.005. (G) Example key of coco expression patterns in the LRO at stages 19–20. Ventral views with anterior to the top. (H) Nuclear pore complex (NPC) schematic. Nups referred to in this study are in bold. (I) Nup188 and Nup93 protein levels determined by Western Blot. Numbers are relative protein levels normalized to Gapdh with triangle reflecting dose of MO. Boxed lane indicates dose used for all experiments. See also Figures S1 and S2.
Figure 2
Figure 2. nup188 and nup93 depletion decreases cilia in the LRO
(A) LROs from embryos treated with the indicated MOs (or UC) stained with anti-acetylated α-tubulin (α-AcTub, green) to detect primary cilia, Phalloidin (red) marks the cell borders. p,a,l,r: posterior, anterior, left, right, respectively. Right panels show a magnification of a representative region of the LRO. (B) Box plots of cilia number per LRO area (μm2) of embryos derived from injections at the 1 or 2-cell stage. Box depicts 25th to 75th percentiles with median marked by horizontal line in box. Whiskers indicate data range from smallest to largest values. n=total number of embryos from 3 independent experiments, T-test, *** p<0.0005, ** p<0.005.
Figure 3
Figure 3. Depletion of Nup93/188 affects cilia but not NPCs
(A) Fluorescence images of lateral views, with dorsal at the top, of both sides (uninjected and injected) of a single embryo with the cilia of the multiciliated cells (MCCs) labeled with α-AcTub (green). Nuclei stained with Hoechst (blue). Insets (top right) are a magnification of a cluster of MCCs, scale bar: 20 μm. The disruption of cilia was found in 100% (n=73) of nup93 morphants and in 41% (n=70) of nup188 morphants. (B) Fluorescence images of Xenopus embryos injected with nup62 (n=30) or nup133 (n=33) MOs at the 1-cell stage labeled with anti-AcTub (green). Lateral views of embryos, with dorsal to the top (top panels) and higher magnification of the MCCs at bottom. Nuclei stained with Hoechst (blue). Level of nup depletion in these morphants is shown in Figure S1A. (C) Embryos were co-injected with mRNA encoding NLS-GFP and nup93, nup188 or nup133 MOs. Animal caps were dissected and allowed to develop MCCs before imaging the distribution of NLS-GFP. Cilia in these explants are shown in Figure S1J. (D) Staining of NPCs with the mAb414 antibody in animal caps of UC and embryos injected with the indicated MOs. (E) Graph shows the mean nuclear/cytoplasm (N:C) fluorescence ratios of NLS-GFP with SD. n=total number of nuclei from 3 independent experiments. T-test, *** p<0.0005 (F) Graph shows the mean and SD of the NPC density in animal caps of UCs and embryos injected with the indicated MOs. n= number of nuclei from 3 independent experiments. See also Figures S1 and S2.
Figure 4
Figure 4. Nup188 and Nup93 specifically localize to the bases of cilia
(A) Immunofluorescence images of Xenopus epidermal MCCs stained with anti-Nup93 (green) and either anti-AcTub (red, top) or anti-γTub (red, bottom) antibodies with merge. (B) Immunofluorescence images of human RPE cells stained with the indicated anti-nup antibodies (left) with anti-AcTub, anti-γTub or anti-Cep290 (middle) and merge (right). See Figure S3B for location of cilia-specific epitopes. (C) Anti-Nup93 antibodies are specific. Fluorescence image (merge of green and red channels) of representative scrambled (mock) siRNA-treated RPE cell stained with anti-Nup93 (green) and anti-AcTub (red) antibodies. Right panels are higher magnification of cilium base showing just the anti-Nup93 signal (green; top) and merge of anti-Nup93 and anti-AcTub (red) images (bottom). Arrowhead points to cilium base. N denotes the nucleus. (D) Identical to (C) except cells are treated with siRNAs specific to NUP93 (N93). (E) Plot of normalized fluorescence intensity in arbitrary units (a.u.) of anti-Nup93 signal at cilium base and NPCs of individual cells treated with scrambled (mock) or specific NUP93 (N93) siRNAs. Mean +/− SD indicated. n=total number of cells/cilia from 3 independent experiments, T-test, *** p<0.0005. (F) Western blot of Nup93 levels after siRNA transfection; numbers are quantification of protein levels relative to Gapdh. (GJ) Anti-Nup188 antibodies are specific. Panel layout identical to (C–F) except for cells are treated with scrambled (mock) or siRNAs specific to NUP188 (N188). (K) Plot of percentage of cells in which the anti-nup signal colocalizes with a cilium base marker. Mean and SD are shown. n=total number of cells from 3 independent experiments. See also Figures S1 and S3.
Figure 5
Figure 5. Nups do not form NPC-like rings at cilia bases
(A) 2D FPALM super-resolution image of a cell co-stained with anti-Nup93 (red; AF647) and anti-AcTub antibodies (green; Cy3B). (B) Higher magnification views of the nuclear surface (left panels) and the cilium base (right panels) of two different cells stained with anti-Nup93 (AF647). (C) Box plot where the density of localization clusters at the nuclear envelope and cilia bases are directly compared. The box depicts the 25th to 75th percentiles with the median marked as horizontal line in box. The whiskers mark the data range from the smallest to the largest value. “+” indicates the mean of the distribution (n=number of cells). T-test, ** p<0.005. (D) Plot of the diameter (mean +/− SD) of localization clusters at the nuclear envelope and cilia bases. n=number of localization clusters from 3 independent experiments. T-test, *** p<0.0005. (E) 2D FPALM images of anti-Nup188 (red; AF647) and anti-γTub antibodies (green; Cy3B) with merge on right. (F) As in (E) except with anti-AcTub co-stain. (G) STED images of a cell co-stained with anti-Nup188 (red; ATTO647N) and anti-γTub antibodies (green; ATTO594) with merge on right. (H) As in (G) except with anti-AcTub co-stain. See also Figure S4.
Figure 6
Figure 6. Nup188 forms two barrel-like structures that encase the centrioles
(A) Diffraction-limited (inset) and 3D W-4PiSMSN super-resolution image of anti-Nup188 signal at the cilium base. Heat map coloration reflects depth in z as depicted by scale. Individual structures are circled. See also Movie S2. (B) Nearest neighbor distances from all localization clusters in all structures imaged were calculated and plotted. (C–E) Rotated views of image in (A) where two cylinders (blue and red) have been fitted into both structures denoted by “1” and “2”. See also Movie S2. (F–G) and (H–I) Planar sections of each structure cut across the cylinder axis (central point). Dotted lines represent cylinders. (J–K) Distribution of the distances of individual localizations from W-4PiSMSN data inside (negative values) and outside (positive values) the modeled cylinder surface of Struct 1 and 2. (L) QR code to load Nup188 W-4PiSMSN structure into the 3D visualization application Augment. See Experimental Procedures for instructions. See also Figures S5 and S6.

Comment in

Similar articles

Cited by

References

    1. Alber F, Dokudovskaya S, Veenhoff LM, Zhang W, Kipper J, Devos D, Suprapto A, Karni-Schmidt O, Williams R, Chait BT, et al. The molecular architecture of the nuclear pore complex. Nature. 2007;450:695–701. - PubMed
    1. Amlacher S, Sarges P, Flemming D, van Noort V, Kunze R, Devos DP, Arumugam M, Bork P, Hurt E. Insight into structure and assembly of the nuclear pore complex by utilizing the genome of a eukaryotic thermophile. Cell. 2011;146:277–289. - PubMed
    1. Basu B, Brueckner M. Cilia multifunctional organelles at the center of vertebrate left-right asymmetry. Curr Top Dev Biol. 2008;85:151–174. - PubMed
    1. Belgareh N, Rabut G, Bai SW, van Overbeek M, Beaudouin J, Daigle N, Zatsepina OV, Pasteau F, Labas V, Fromont-Racine M, et al. An evolutionarily conserved NPC subcomplex, which redistributes in part to kinetochores in mammalian cells. The Journal of cell biology. 2001;154:1147–1160. - PMC - PubMed
    1. Bisgrove BW, Yost HJ. The roles of cilia in developmental disorders and disease. Development. 2006;133:4131–4143. - PubMed

Publication types

MeSH terms

LinkOut - more resources