. 2016 Sep 8;166(6):1423-1435.e12.
doi: 10.1016/j.cell.2016.08.019. Epub 2016 Sep 2.

A Genome-wide CRISPR Screen in Toxoplasma Identifies Essential Apicomplexan Genes

Affiliations

A Genome-wide CRISPR Screen in Toxoplasma Identifies Essential Apicomplexan Genes

Saima M Sidik et al. Cell. .

Abstract

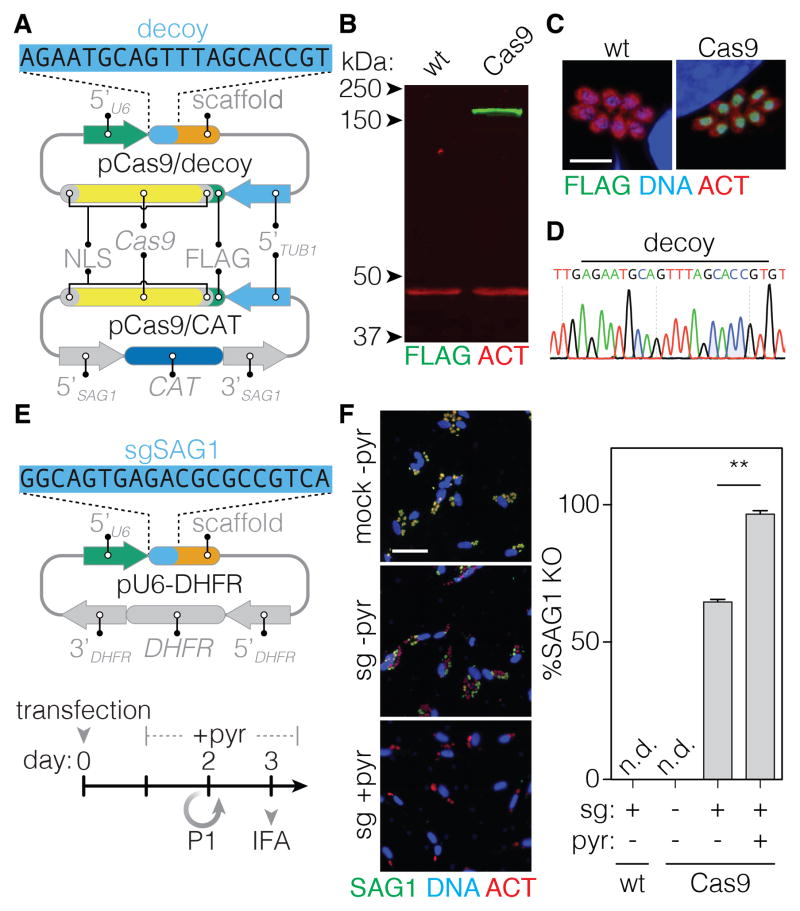
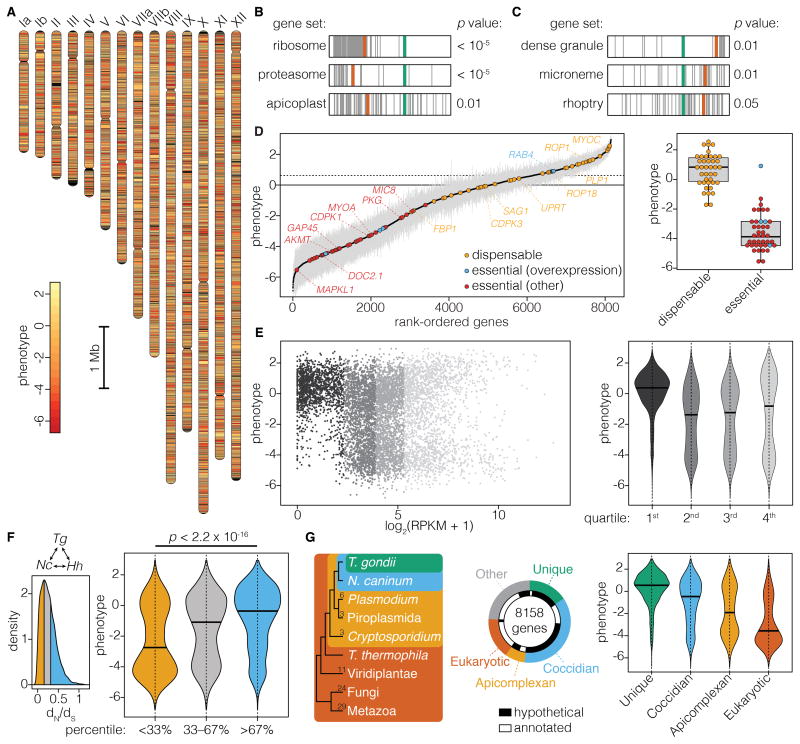
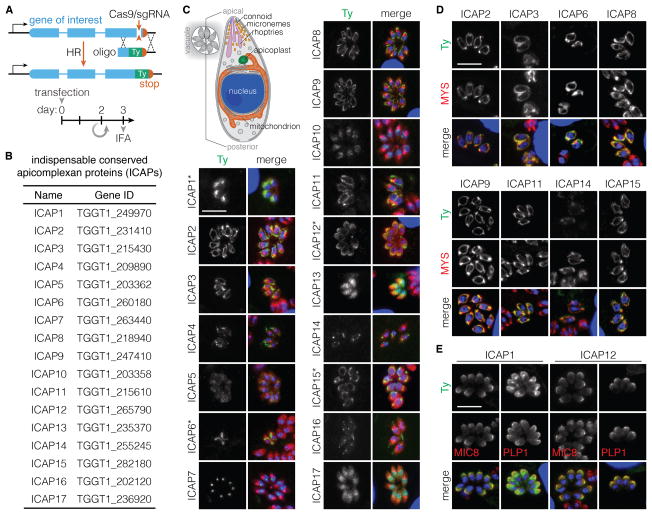
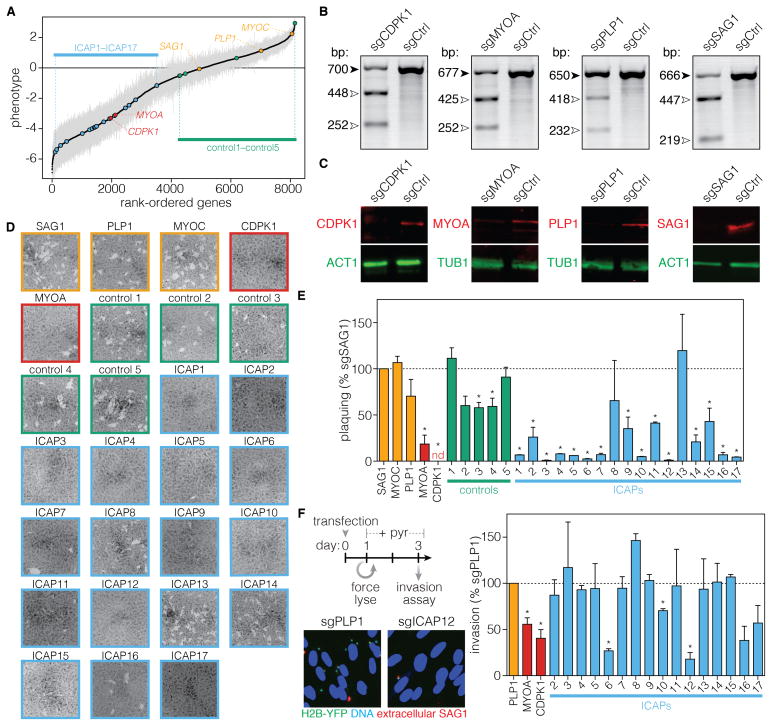
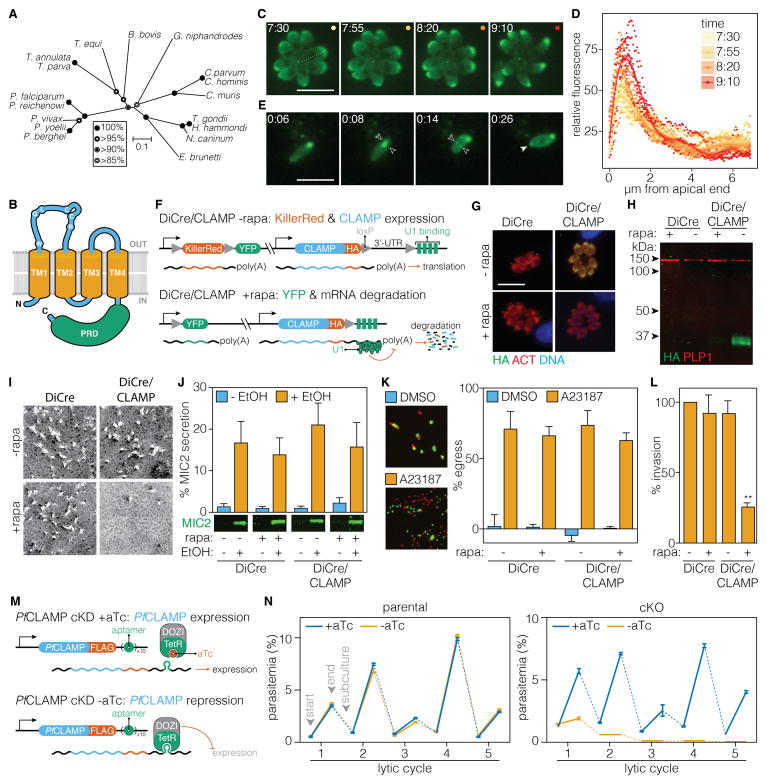
Apicomplexan parasites are leading causes of human and livestock diseases such as malaria and toxoplasmosis, yet most of their genes remain uncharacterized. Here, we present the first genome-wide genetic screen of an apicomplexan. We adapted CRISPR/Cas9 to assess the contribution of each gene from the parasite Toxoplasma gondii during infection of human fibroblasts. Our analysis defines ∼200 previously uncharacterized, fitness-conferring genes unique to the phylum, from which 16 were investigated, revealing essential functions during infection of human cells. Secondary screens identify as an invasion factor the claudin-like apicomplexan microneme protein (CLAMP), which resembles mammalian tight-junction proteins and localizes to secretory organelles, making it critical to the initiation of infection. CLAMP is present throughout sequenced apicomplexan genomes and is essential during the asexual stages of the malaria parasite Plasmodium falciparum. These results provide broad-based functional information on T. gondii genes and will facilitate future approaches to expand the horizon of antiparasitic interventions.

Keywords: Apicomplexan parasites; eukaryotic pathogen; genome-wide CRISPR screen; host-cell invasion; host-pathogen interactions; malaria; toxoplasmosis.


Figures

Figure 1
Figure 1. Expression of Cas9 Maximizes Gene-Disruption in T. gondii
(A) Constructs used to constitutively express Cas9 in T. gondii. The sequence of the decoy sgRNA is highlighted (blue), followed by the Cas9-binding scaffold (orange). (B) Immunoblot showing expression of FLAG-tagged Cas9 (green) in the strain constitutively expressing the transgene. ACT1 serves as a loading control (red). (C) Cas9 localizes to the parasite nucleus. ACT1 provides a counterstain and DAPI stains for host-cell and parasite nuclei. Scale bar = 10 μm. (D) Chromatogram showing the presence of the decoy in the Cas9-expressing strain. (E) The sgRNA expression construct with the pyrimethamine-resistance selectable marker (DHFR). The targeting sequence of the SAG1 sgRNA is highlighted. The timeline indicates the period of pyrimethamine (pyr) selection (if applied), passaging to new host cells (P1), and the immunofluorescence assay (IFA). (F) Representative micrographs showing intracellular parasites 3 days post transfection. Parasites were stained for SAG1 (green), and ACT1 (red). Host-cell and parasite nuclei were stained with DAPI (blue). Scale bar = 60 μm. The efficiency of SAG1 disruption in WT and Cas9-expressing parasites was measured following different treatments. Mean ± SD for n = 2 independent experiments, ** p < 0.005.
Figure 2
Figure 2. Using Pooled Screens to Identify genes responsible for drug sensitivity
(A) Schematic depiction of the pooled CRISPR screen. Cas9-expressing parasites are transfected with the sgRNA library and grown in human fibroblasts (HFFs). At various time-points, sgRNAs are amplified and enumerated by sequencing to determine relative abundance and phenotype scores for individual genes. (B) Time-line for the generation of mutant populations and subsequent selection in the presence or absence of FUDR. Times at which parasites were passaged (P) are indicated. (C) Heat-map showing the phenotype score of genes at different time-points following transfection of the library into wild-type (wt) or Cas9-expressing parasites. (D) Relative abundance of sgRNAs following growth of the population in the presence or absence of FUDR. Mean log2(normalized abundance) for each sgRNA in three independent experiments; sgRNAs against UPRT (blue). (E) Phenotype score calculated for each gene comparing growth ± FUDR. Mean ± SEM for n = 3 independent experiments; UPRT (blue). (F) Comparison of phenotypic scores in untreated samples after three (P3) or six (P6) passages. Pearson’s correlation coefficient (r) is shown.
Figure 3
Figure 3. A Genome-Scale Screen Measures the Contribution of Each Parasite Gene to Fitness in Human Fibroblasts
(A) Diagram of T. gondii chromosomes with genes colored according to phenotype. (B–C) Significantly enriched (B) or depleted (C) gene sets identified by GSEA. Genes belonging to each category (gray) are plotted according to their rank in the screen, relative to the maximum enrichment score (red) and zero phenotype (green). Phenotype scores for a given set were compared to the entire set by a Komolgorov-Smirnov test (FDR corrected) to calculate the p values. (D) T. gondii genes rank-ordered based on their phenotype. Genes previously reported are highlighted, indicating whether they are dispensable (yellow), or indispensable as inferred from overexpression (blue) or another method (red). Dotted line represents the median phenotype score for the dispensable genes. Mean ± SEM for n = 4 independent experiments. (E) Correlation of phenotype scores to gene expression based on maximum RPKM values. The distribution of phenotypes in each expression quartile are plotted in the violin graph. Bars indicate the group median. (F) Analysis of selective pressure for 5,897 syntenic genes found in all three coccidian genomes (Tg, T. gondii; Nc, N. caninum; Hh, H. hammondi). Histogram shows the distribution of dN/dS values, highlighting the top and bottom third. Genes binned according to dN/dS show higher phenotype scores for genes under purifying selection (orange). Bars indicate the group median. The distributions were compared using a Kolmogorov-Smirnov test. (G) Correlation between phenotype scores and depth of conservation. The phylogenetic relationship between T. gondii and the other genomes used in the analysis is illustrated by the dendrogram, with number of genomes in each taxon indicated. The proportion of T. gondii genes and, within this, the proportion that are functionally annotated, are shown for each category. The distribution of phenotype scores for each category is plotted. Bars indicate the group median. See also Figures S1 and S2, and Tables S1, S2 and S3.
Figure 4
Figure 4. Subcellular Localization of Indispensable Conserved Apicomplexan Proteins
(A) CRISPR was used to introduce a C-terminal Ty tag into the endogenous locus of individual genes through homologous recombination (HR) following the indicated timeline. (B) List of successfully tagged indispensable conserved apicomplexan proteins (ICAPs), numbered according to their phenotype scores from lowest (ICAP1) to highest (ICAP17). (C) Three days after transfection, intracellular parasites were fixed and stained for Ty (green), ACT1 (red), and DAPI (blue). * denotes fixation in methanol instead of formaldehyde. Scale bar = 10 μm. The diagram illustrates the relative position of various organelles within the parasite. (D–E) Colocalization ICAPs (green) with a mitochondrial marker (MYS; red) (D), or micronemal proteins (MIC8 or PLP1; red) (E). Nuclei stained with DAPI (blue) are shown in the merged image. Scale bar = 10 μm. See also Table S2.
Figure 5
Figure 5. Functional Characterization of Indispensable Conserved Apicomplexan Proteins
(A) Position of analyzed genes within the phenotypic ranking of all T. gondii genes. Known indispensable (red) or dispensable (yellow) genes used as controls are indicated. The ICAPs (blue) and uncharacterized genes predicted to be dispensable (green) are numbered in ascending order according to their rank. (B–C) Gene disruption observed at a population level three days after transfection with various control constructs. Disruption of the target locus is observed by Surveyor assay comparing, for each locus, the specific sgRNA to an irrelevant sgRNA against the dispensable gene MYOC (B). Loss of the target proteins (red) is observed in samples treated with the targeting sgRNA but not the control, while the loading controls (green) remain unchanged (C). (D–E) Plaque assays performed immediately following transfection with sgRNAs targeting ICAPs or control genes (D). The number of plaques observed for disruption of each gene relative to the sgRNA against SAG1 (E). Mean ± SEM for n = 2 independent experiments, * FDR-adjusted p < 0.1 relative to the control. (F) Secondary screen for genes involved in invasion. The period of intracellular growth prior to phenotypic changes was extended by forced release and passaging the day after transfection. Invasion was assayed after the subsequent lysis, and calculated relative to PLP1 disruption. Mean ± SEM for n = 2 independent experiments, * FDR-adjusted p < 0.1 relative to the control. Representative immunofluorescence images are shown. See also Figure S3, and Table S2.
Figure 6
Figure 6. CLAMP Mediates T. gondii Invasion and is Essential for the P. falciparum Asexual Cycle
(A) Neighbor-joining tree showing the phylogenetic relationships of CLAMP homologs in diverse apicomplexans. Bootstrap values for 10,000 trials are displayed. (B) Inferred topology of CLAMP highlighting transmembrane domains (orange) and the proline-rich domain (green). See also Figure S4. (C–E) CLAMP-mNeonGreen localization during egress and invasion. Intracellular parasites expressing CLAMP-mNeonGreen were stimulated to egress with A23187 (C). Relative fluorescence across the length of each parasite (dotted line) is plotted for the four time-points shown. Lines are polynomial regressions ± 95% CI (D). The localization was also monitored during invasion (E). The position of the moving junction is indicated with paired open arrows. Solid arrowhead indicates a punctum of mNeonGreen at the posterior of the parasite appearing immediately after invasion. Time is expressed in min:sec following addition of the compound (C–D) or initiation of invasion (E). Scale bar = 10 μm. (F) Diagram of the DiCre/CLAMP strain showing how after rapamycin (rapa) treatment the reporter locus switches from expressing KillerRed to expressing YFP, and CLAMP mRNA degradation is induced. (G–H) A 2 hour treatment with rapa is sufficient to induce CLAMP degradation as demonstrated by immunofluorescence microscopy 24 hours later (G) or immunoblotting two days later (H). The parental strain (DiCre) is included as a control. (I–L) The DiCre/CLAMP strain or its parental stain (DiCre) were treated as above. Parasites were harvested and phenotypically assayed for plaque formation (I), microneme secretion (J), egress (K) or invasion (L). Secretion was measured as the percent of total MIC2 present in the parasites (J). Egress was induced with A23187 and compared to a vehicle control (DMSO) over the same period (K). All results are means ± SEM for n = 3 independent experiments, ** p < 0.005 relative to the untreated DiCre strain. (M) Diagram of the PfCLAMP cKD showing how removing aTc allows the TetR-DOZI regulator to bind and suppress expression. (N) Growth curves of the parental strain (left) or the cKD (right) ± aTc. Means ± SD for n = 3 technical replicates. See also Figure S5D for an independent replicate. See also Figures S4 and S5, and Movies S1, S2, S3, and S4.

Comment in

References

    1. Achbarou A, Mercereau-Puijalon O, Autheman JM, Fortier B, Camus D, Dubremetz JF. Characterization of microneme proteins of Toxoplasma gondii. Mol Biochem Parasitol. 1991;47:223–233. - PubMed
    1. Bargieri D, Lagal V, Andenmatten N, Tardieux I, Meissner M, Ménard R. Host cell invasion by apicomplexan parasites: the junction conundrum. PLoS Pathog. 2014;10:e1004273. - PMC - PubMed
    1. Bastin P, Bagherzadeh Z, Matthews KR, Gull K. A novel epitope tag system to study protein targeting and organelle biogenesis in Trypanosoma brucei. Mol Biochem Parasitol. 1996;77:235–239. - PubMed
    1. Bullen HE, Jia Y, Yamaryo-Botté Y, Bisio H, Zhang O, Jemelin NK, Marq JB, Carruthers V, Botté CY, Soldati-Favre D. Phosphatidic Acid-Mediated Signaling Regulates Microneme Secretion in Toxoplasma. Cell Host Microbe. 2016;19:349–360. - PubMed
    1. Burg JL, Perelman D, Kasper LH, Ware PL, Boothroyd JC. Molecular analysis of the gene encoding the major surface antigen of Toxoplasma gondii. J Immunol. 1988;141:3584–3591. - PubMed

Publication types

MeSH terms