. 2016 Sep 8;166(6):1585-1596.e22.
doi: 10.1016/j.cell.2016.08.002. Epub 2016 Sep 1.

Development of a Comprehensive Genotype-to-Fitness Map of Adaptation-Driving Mutations in Yeast

Affiliations

Development of a Comprehensive Genotype-to-Fitness Map of Adaptation-Driving Mutations in Yeast

Sandeep Venkataram et al. Cell. .

Abstract

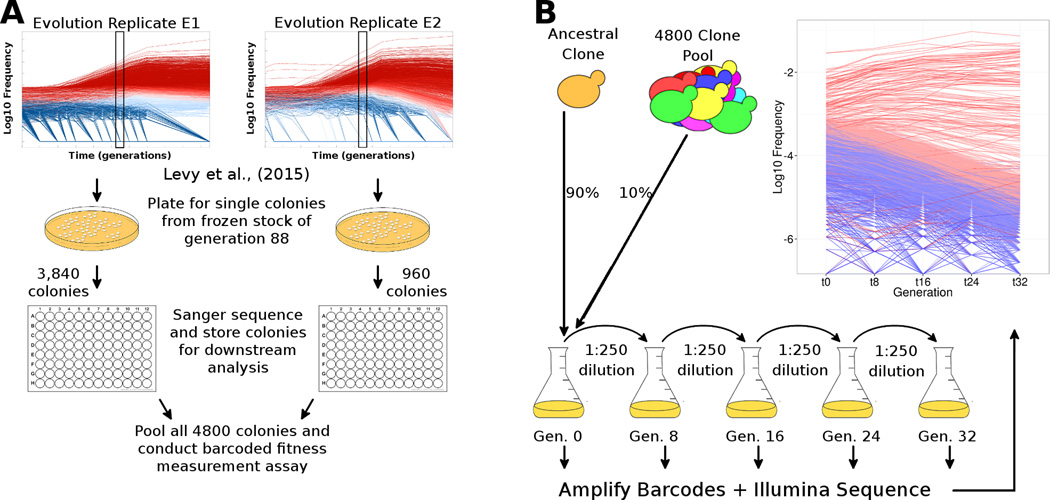
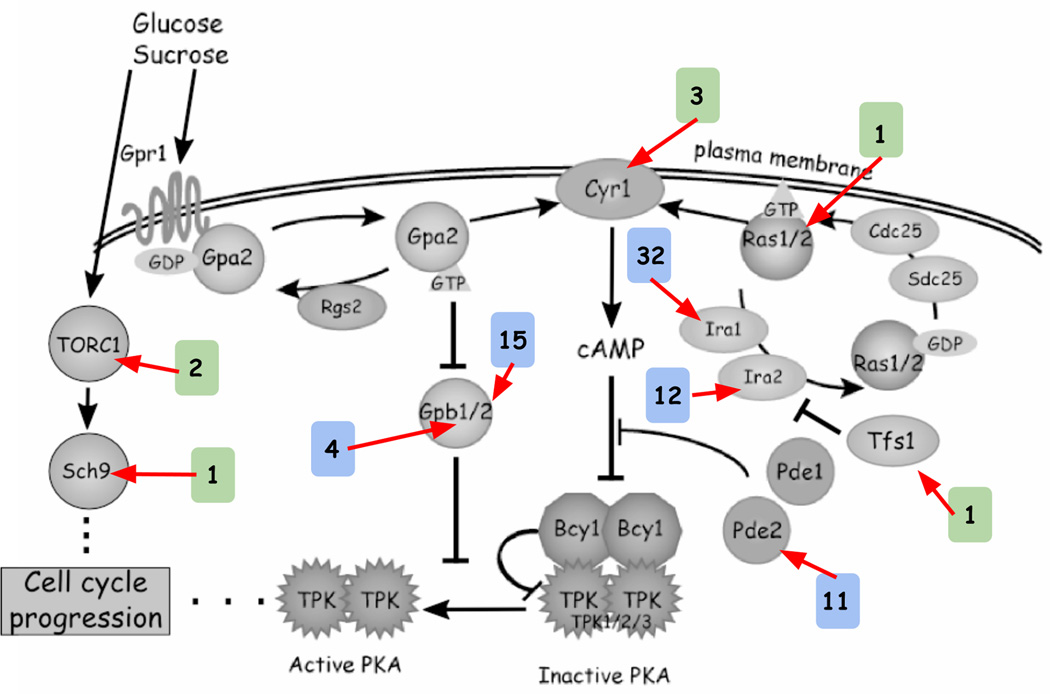
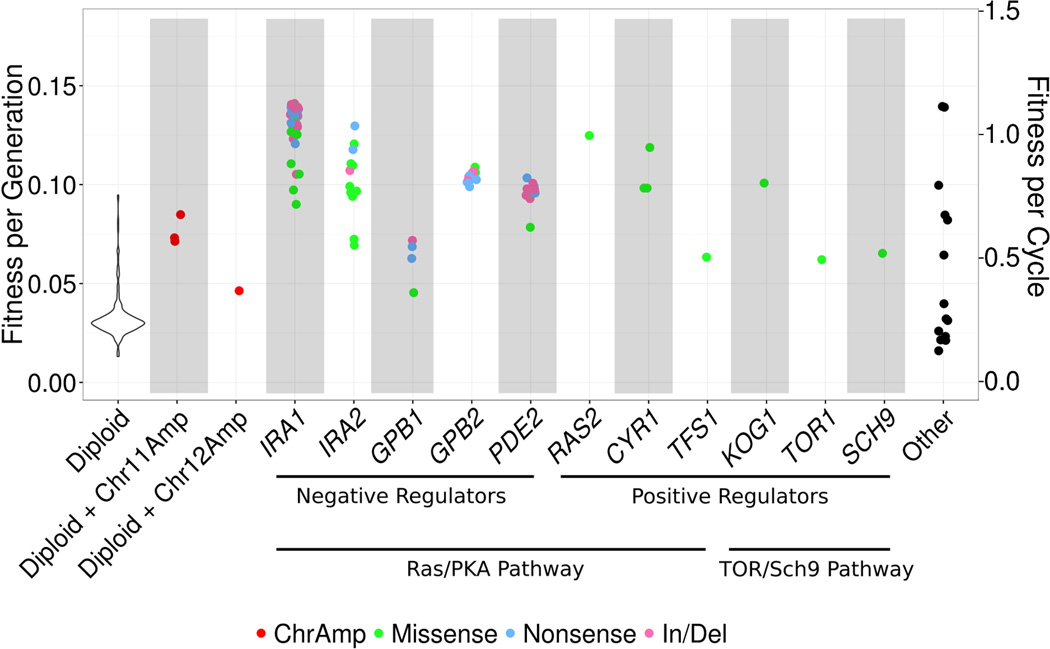
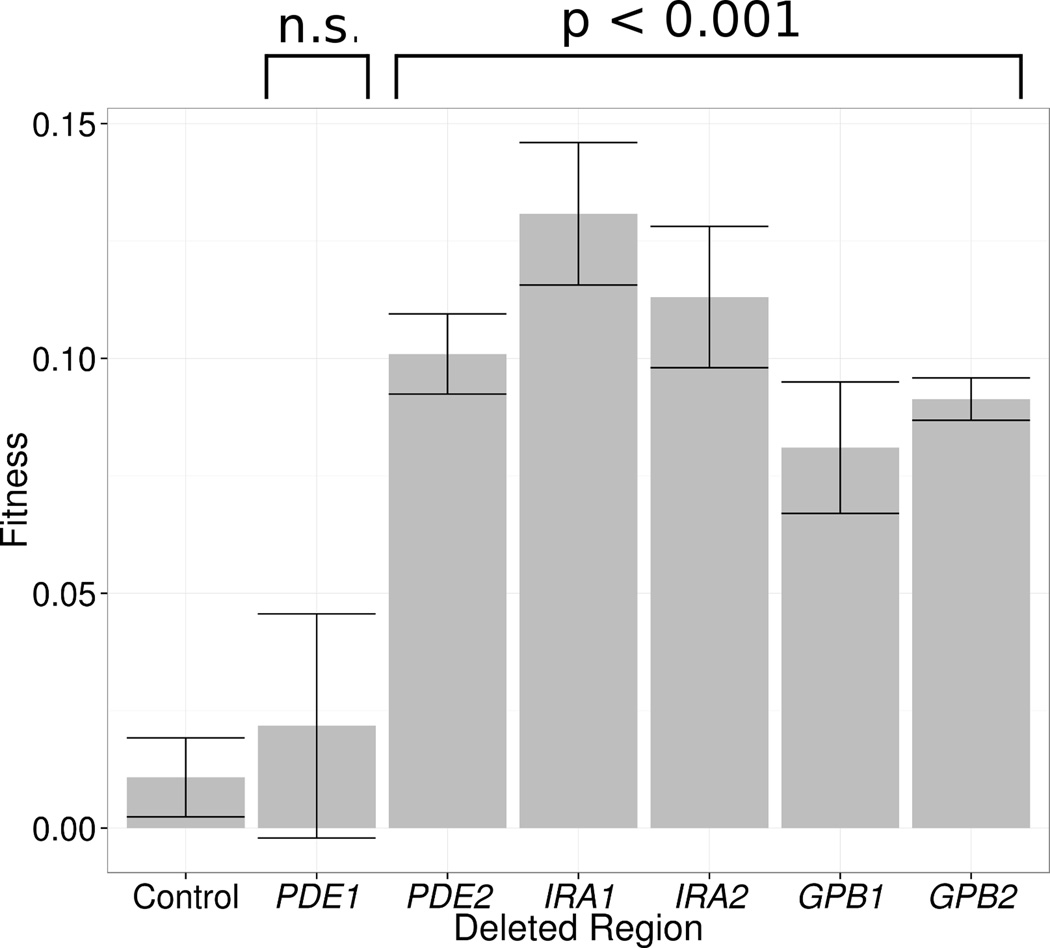
Adaptive evolution plays a large role in generating the phenotypic diversity observed in nature, yet current methods are impractical for characterizing the molecular basis and fitness effects of large numbers of individual adaptive mutations. Here, we used a DNA barcoding approach to generate the genotype-to-fitness map for adaptation-driving mutations from a Saccharomyces cerevisiae population experimentally evolved by serial transfer under limiting glucose. We isolated and measured the fitness of thousands of independent adaptive clones and sequenced the genomes of hundreds of clones. We found only two major classes of adaptive mutations: self-diploidization and mutations in the nutrient-responsive Ras/PKA and TOR/Sch9 pathways. Our large sample size and precision of measurement allowed us to determine that there are significant differences in fitness between mutations in different genes, between different paralogs, and even between different classes of mutations within the same gene.


Figures

Figure 1
Figure 1. Experimental procedures to select and measure fitness of evolved clones
(A) Schematic of isolation and identification of individual evolved yeast clones. We isolated 4,800 single colonies from generation 88 across both replicate evolution experiments from Levy et al. (2015), determined their lineage barcodes, and stored them individually. (B) Schematic of barcoded fitness measurement assay. We grew all 4,800 colonies individually (not shown) and pooled them. The pool was mixed with an ancestral clone at a 1:9 ratio and the mixture was propagated for 32 generations in four independent batches (2–3 replicates per batch). At each transfer (every 8 generations), we isolated DNA, amplified the barcodes and conducted high-throughput sequencing to estimate the frequency trajectory of each barcode. The inset graph shows the frequency trajectory of all lineages with fitness > −1%, where adaptive lineages are colored in red (darker red lineages are more fit) and neutral lineages are colored in blue. Fitness was estimated using 24 generations of data from these frequency trajectories (M&R). Raw data for the sampled clones and their fitness measurements are in Tables S1–S3.
Figure 2
Figure 2. Fitness measurements are consistent across replicates and techniques
(A) Comparison of fitness values for individual barcoded clones obtained from independent replicate assays conducted in the same experimental batch. (B–C) Comparison of fitness values for individual barcoded clones obtained from independent experimental batches (averaged over all replicates within a batch) of the fitness measurement assay. For A-C, a small number of lineages with extreme fitness estimates in at least one replicate (s < −5% or s > 20%) are not shown for increased resolution. A comparison of our fitness measurements using the 4,800 clone pool and (D) fitness measurements from a 500 clone pool, (E) to their barcode lineage fitness measurements from the Levy et al. (2015) lineage tracking estimates, and (F) the pairwise fluorescence competition assay measurements, from Levy et al. (2015). The solid lines on all panels are Y=X while X and Y error bars show the fitness measurement errors (M&R). For each panel, we report the mean and standard deviation of the difference in fitness for each comparison, grouped by low and high fitness clones. Systematic differences between measurements appear to be lower in low-fitness clones compared to high fitness clones, but the measurements are generally consistent throughout. We conducted extensive validation of our fitness estimation methodology, highlighted in Figures S1–S5.
Figure 3
Figure 3. Schematic of the Ras/PKA and TOR/Sch9 pathways in yeast and the number of adaptive mutations found per gene
The colored boxes denote the number of independent haploid lineages observed in our dataset with mutations in a particular gene. Blue boxes indicate mutations in negative regulators of cell cycle progression, while green boxes indicate mutations in positive regulators. Modified from Kao and Sherlock (2008) Figure S1.
Figure 4
Figure 4. The fitness spectrum (genotype-to-fitness map) of evolved clones with different adaptive mutations
The inverse variance weighted fitness averaged across all batches and replicates is plotted. Mutations are colored by their molecular basis (i.e. chromosomal amplification, insertion/deletion, nonsense or missense). The “other” class includes the 14 adaptive haploid clones for which we did not identify a nutrient response pathway mutation. Within-batch standard deviations (not shown for clarity) are ≤ 1% for > 90% of clones with nutrient response pathway mutations, while between-batch standard deviations are ~2% for all clones. To highlight the effect of single mutations on fitness, the six diploid clones with nutrient response pathway mutations are not shown. We show per-cycle fitness (8 generations per cycle) as a secondary y-axis (right side), as the fitness benefit of these mutations may not exclusively be due to changes in per-generation fermentative growth rate, but due to changes in other parts of the growth cycle such as growth lag, diauxic shift, aerobic growth, or increased viability after stationary phase. Figure S6 shows the distribution of fitness effects of our 4,800 sampled and 418 sequenced clones.
Figure 5
Figure 5. Fitness of clones with synthetic whole-gene deletions in negative regulators of the Ras/PKA pathway
Fitness was assayed using pairwise competitions against a fluorescently tagged ancestral clone. The plot shows the fitness for each of the constructed deletions and the error bars show standard error. P-values are for t-tests comparing the fitness of each gene deletion to the control, which is a deletion of the pseudogene YFR059C. n.s. stands for “non-significant”, meaning P > 0.05.

References

    1. Adams J, Hansche PE. Population studies in microorganisms. I. Evolution of diploidy in Saccharomyces cerevisiae . Genetics. 1974;76:327–338. - PMC - PubMed
    1. Bank C, Hietpas RT, Jensen JD, Bolon DNA. A Systematic Survey of an Intragenic Epistatic Landscape. Mol. Biol. Evol. 2014;32:229–238. - PMC - PubMed
    1. Barrick JE, Yu DS, Yoon SH, Jeong H, Oh TK, Schneider D, Lenski RE, Kim JF. Genome evolution and adaptation in a long-term experiment with Escherichia coli . Nature. 2009;461:1243–1247. - PubMed
    1. Benson G. Tandem repeats finder: a program to analyze DNA sequences. Nucleic Acids Res. 1999;27:573–580. - PMC - PubMed
    1. Bozek K, Wei Y, Yan Z, Liu X, Xiong J, Sugimoto M, Tomita M, Pääbo S, Pieszek R, Sherwood CC, et al. Exceptional evolutionary divergence of human muscle and brain metabolomes parallels human cognitive and physical uniqueness. PLoS Biol. 2014;12:e1001871. - PMC - PubMed

Publication types