

Relative Effects of Sensory Modalities and Importance of Fatty Acid Sensitivity on Fat Perception in a Real Food Model
- PMID: 27594969
- PMCID: PMC4989022
- DOI: 10.1007/s12078-016-9211-5
Relative Effects of Sensory Modalities and Importance of Fatty Acid Sensitivity on Fat Perception in a Real Food Model
Abstract
Introduction: Fat can be perceived through mouthfeel, odour and taste, but the influence of these modalities on fat perception remains undefined. Fatty acids are stimuli and individual sensitivity to fatty acids varies. Studies show association between fatty acid sensitivity, dietary intake and BMI, but results are conflicting. Therefore, this study examined this association, and the effect of modalities on fat perception.
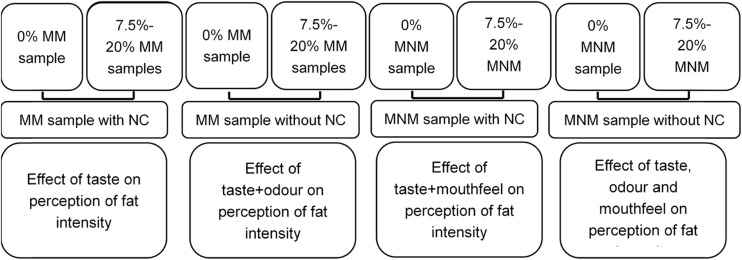
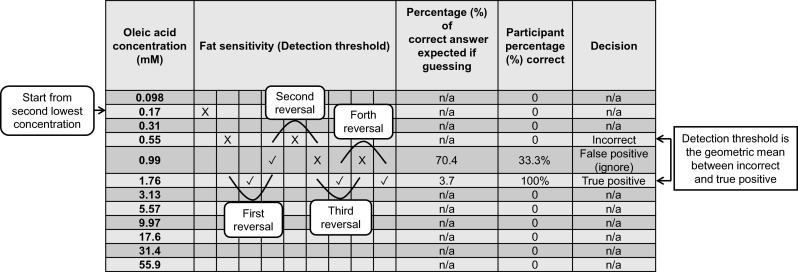
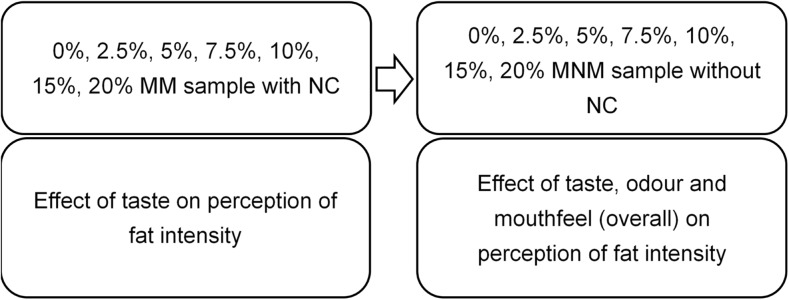
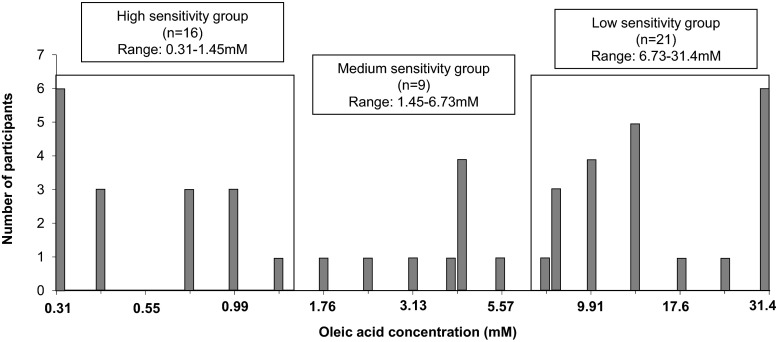
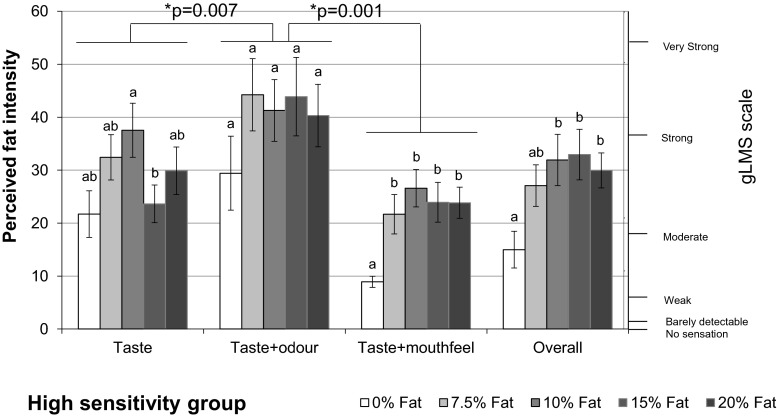
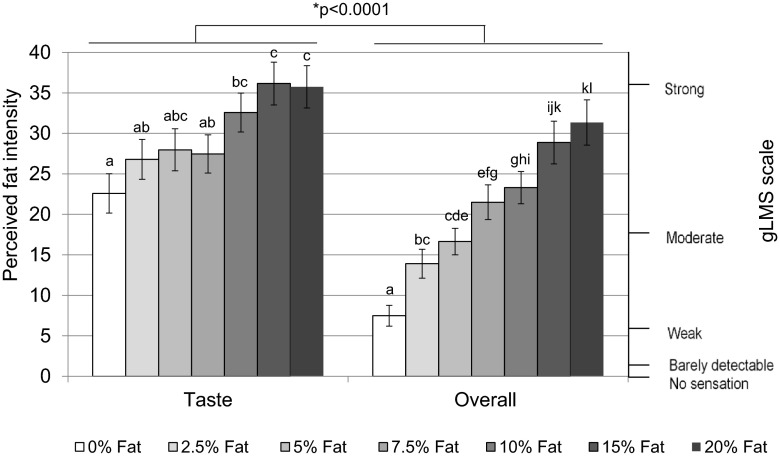
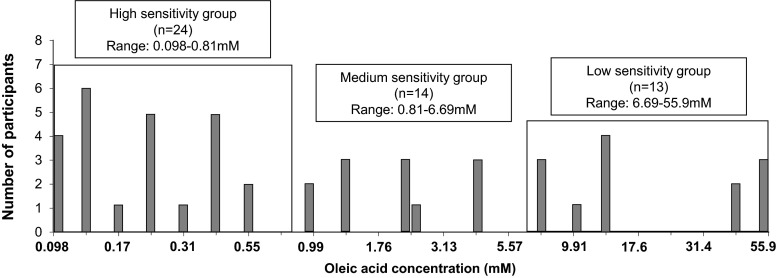
Methods: Two sub-studies were conducted. In study 1 (n = 46), fat intensity was assessed by milk/cream mixtures varying by five fat levels. Fat intensity was rated under four conditions: mouthfeel odour-masked, mouthfeel-masked, odour masked and with no masking. Mouthfeel masking was achieved using thickener and paraffin, odour masking using nose-clips. Fatty acid sensitivity was measured by 3-AFC staircase method using milk containing oleic acid (0.31-31.4 mM). In study 2 (n = 51), more fat levels were added into the intensity rating. A 2-AFC discrimination test was used to confirm whether fat levels could be distinguished. In the sensitivity test, a wider range of oleic acid was included.
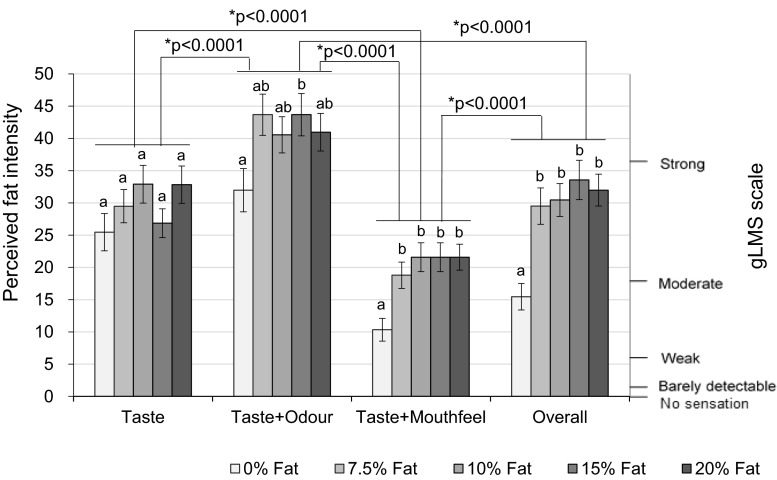
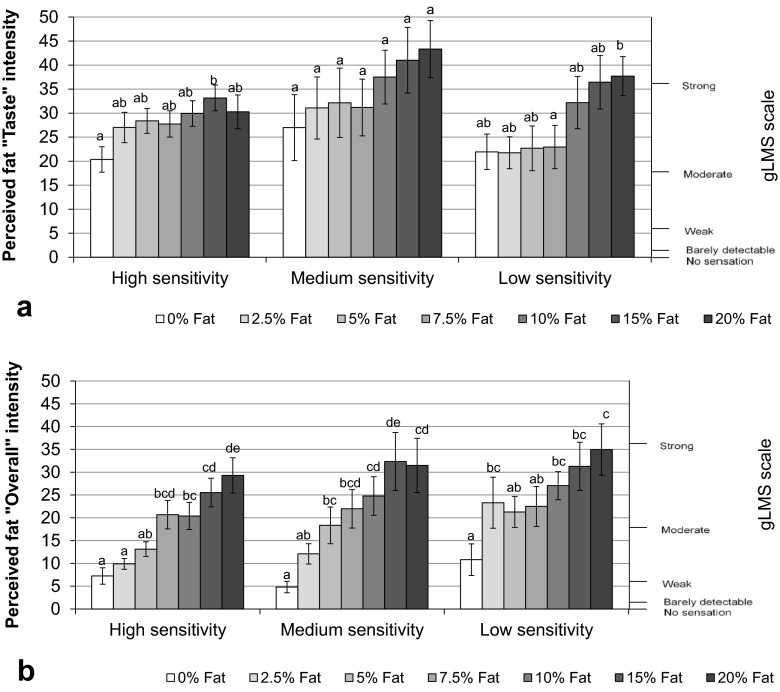
Results: Fat intensity was rated higher without nose clips (p < 0.0001), implying that odour increased fat perception. Mouthfeel-masked samples were rated higher, showing that increased viscosity and lubricity enhanced fat perception (p < 0.0001). Participants could distinguish fat levels based on "taste" in rating tests and 2-AFC tests. Participants were divided into high-/medium-/low-sensitivity groups. No significant difference was found in fat intensity between groups; however, the high-sensitivity group discriminated more fat levels. No association between sensitivity groups, nutrient intake or BMI was found.
Conclusion: Mouthfeel and odour can enhance fat perception. Fat level can be discriminated based on taste.
Keywords: Detection threshold; Fat intake; Fat perception; Fatty acid sensitivity; Taste.
Figures
References
-
- Allen VJ, Withers CA, Hough G, Gosney MA, Methven L. A new rapid detection threshold method for use with older adults: reducing fatigue whilst maintaining accuracy. Food Qual Prefer. 2014;36:104–110. doi: 10.1016/j.foodqual.2014.03.007. - DOI
-
- Amer B, Nebel C, Bertram HC, Mortensen G, Hermansen K, Dalsgaard TK. Novel method for quantification of individual free fatty acids in milk using an in-solution derivatisation approach and gas chromatography-mass spectrometry. Int Dairy J. 2013;32:199–203. doi: 10.1016/j.idairyj.2013.05.016. - DOI
-
- Bartoshuk LM, Duffy VB, Green BG, Hoffman HJ, Ko C-W, Lucchina LA, Marks LE, Snyder DJ, Weiffenbach JM (2004) Valid across-group comparisons with labeled scales: the gLMS versus magnitude matching. Physiol Behav 82:109–114. doi:10.1016/j.physbeh.2004.02.033 - PubMed
LinkOut - more resources
Full Text Sources
Other Literature Sources
Medical