. 2016 Oct;19(10):1356-66.
doi: 10.1038/nn.4377. Epub 2016 Sep 5.

VTA dopaminergic neurons regulate ethologically relevant sleep-wake behaviors

Affiliations

VTA dopaminergic neurons regulate ethologically relevant sleep-wake behaviors

Ada Eban-Rothschild et al. Nat Neurosci. 2016 Oct.

Abstract

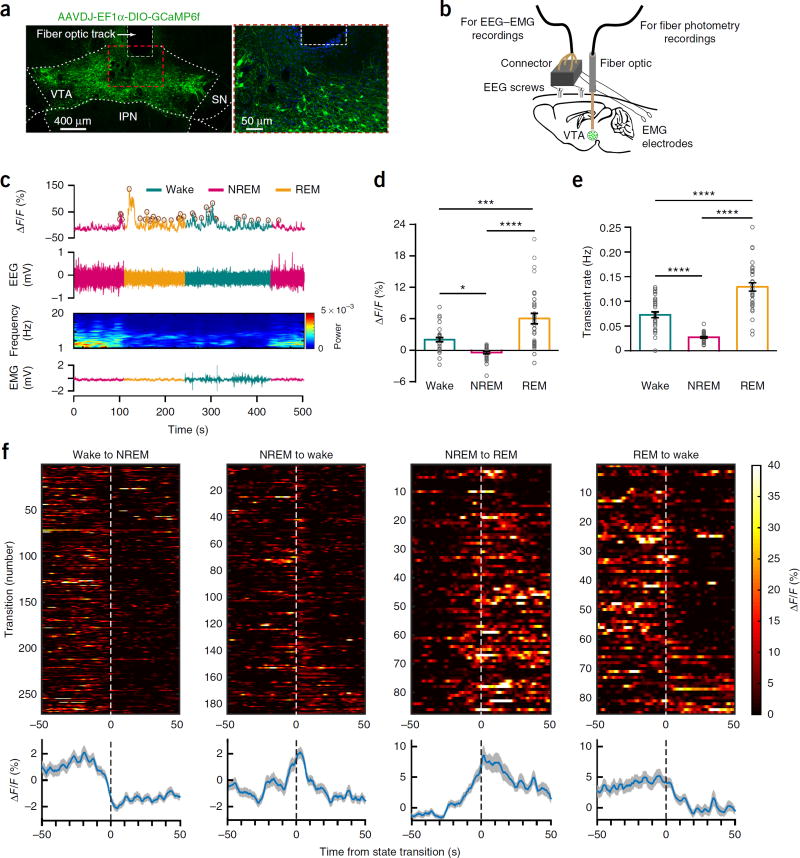
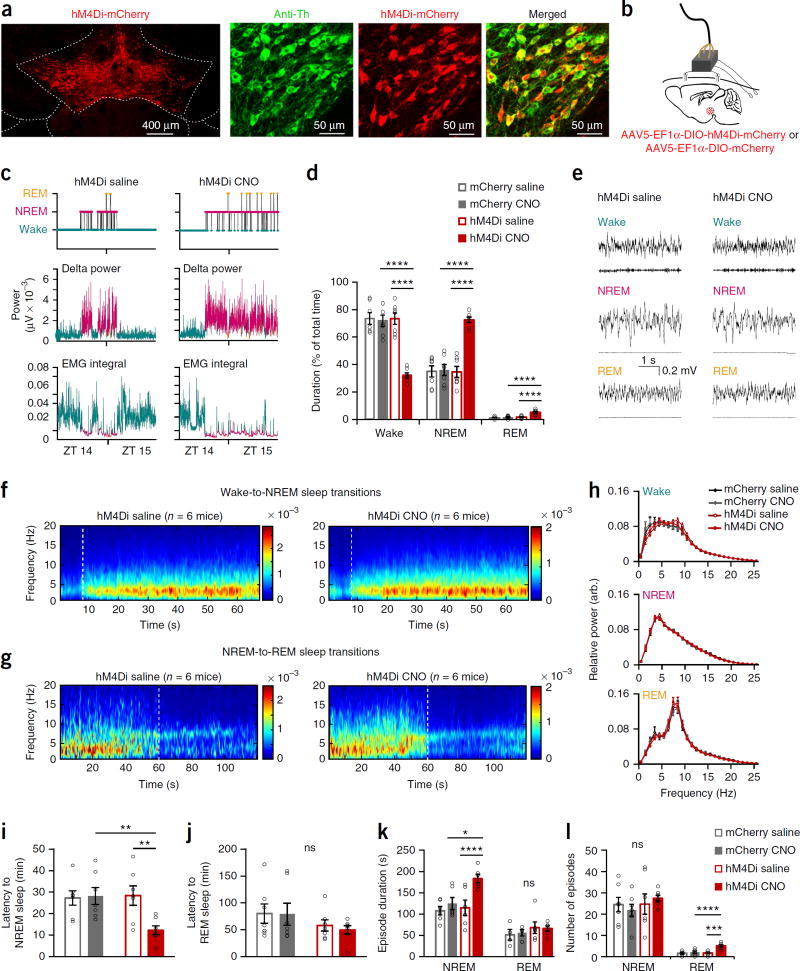
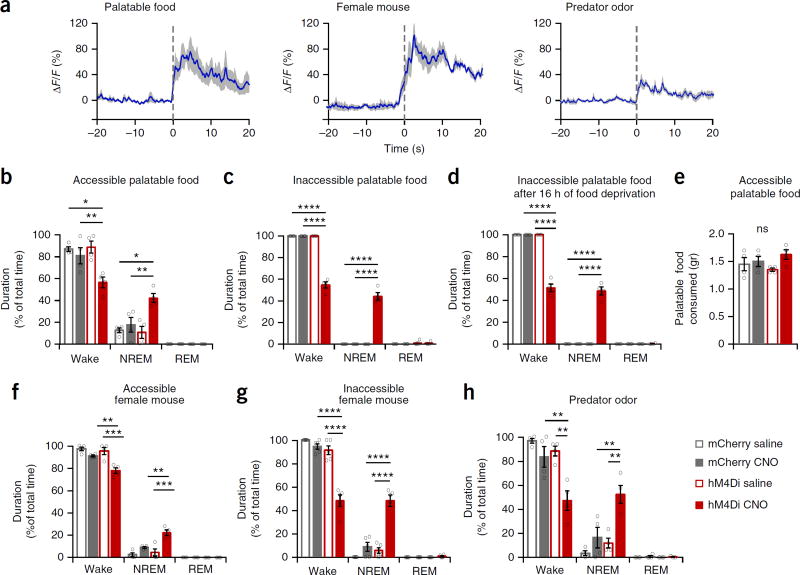
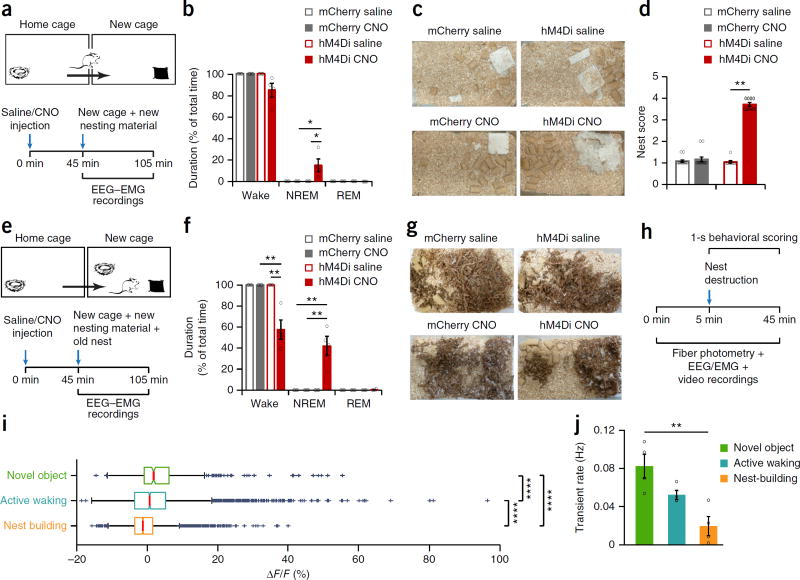
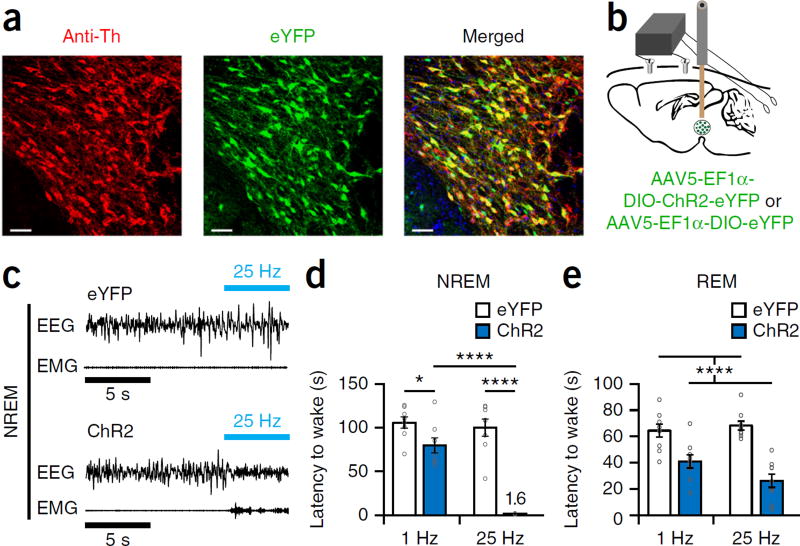
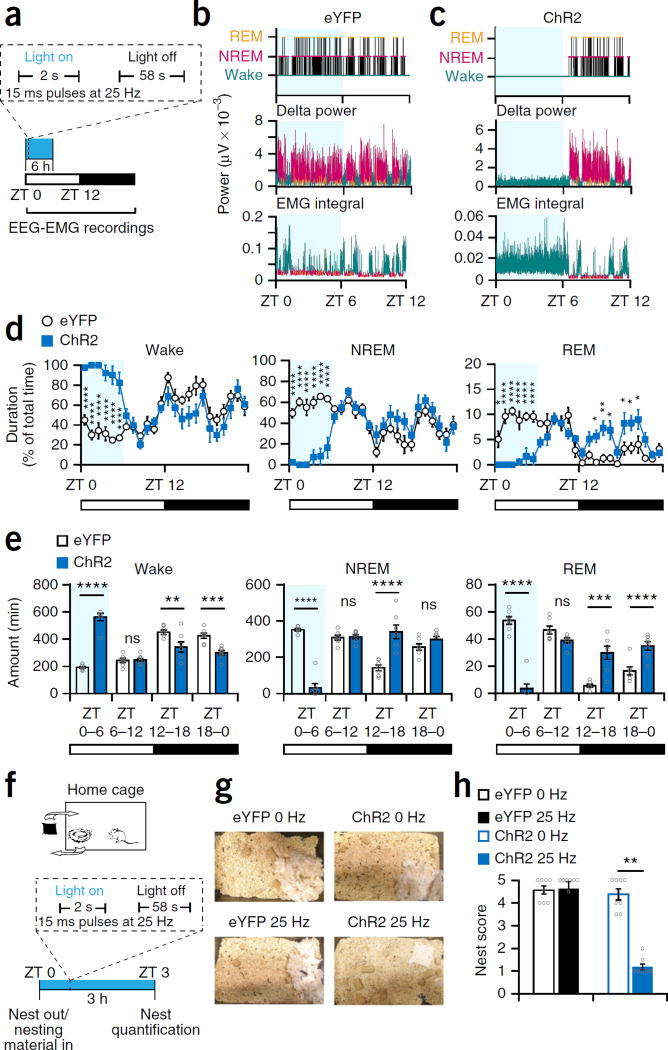
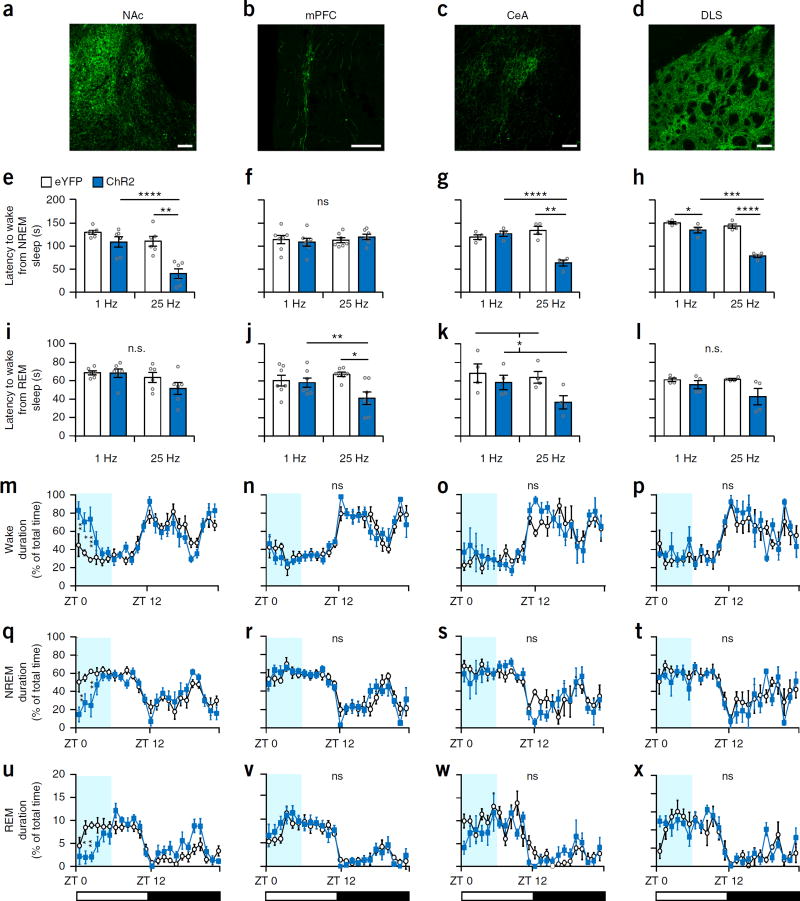
Dopaminergic ventral tegmental area (VTA) neurons are critically involved in a variety of behaviors that rely on heightened arousal, but whether they directly and causally control the generation and maintenance of wakefulness is unknown. We recorded calcium activity using fiber photometry in freely behaving mice and found arousal-state-dependent alterations in VTA dopaminergic neurons. We used chemogenetic and optogenetic manipulations together with polysomnographic recordings to demonstrate that VTA dopaminergic neurons are necessary for arousal and that their inhibition suppresses wakefulness, even in the face of ethologically relevant salient stimuli. Nevertheless, before inducing sleep, inhibition of VTA dopaminergic neurons promoted goal-directed and sleep-related nesting behavior. Optogenetic stimulation, in contrast, initiated and maintained wakefulness and suppressed sleep and sleep-related nesting behavior. We further found that different projections of VTA dopaminergic neurons differentially modulate arousal. Collectively, our findings uncover a fundamental role for VTA dopaminergic circuitry in the maintenance of the awake state and ethologically relevant sleep-related behaviors.


Figures

Figure 1
Figure 1
Population activity of Th+ VTA neurons across sleep–wake states, (a) Representative images of the VTA from a GCaMP6f-expressing mouse, showing viral expression and the placement of the tip of the fiber above the VTA (one of four mice), (b) Schematic of the in vivo recording configuration, (c) Representative fluorescence trace, EEG, EEG power spectrogram and EMG trace across spontaneous sleep–wake states. ΔF/F, change in fluorescence from median of the entire time series. Brown circles, transients detected using a filtering-based algorithm. (d,e) Mean ± s.e.m. fluorescence (d) and transient rate (e) during wake, NREM sleep and REM sleep (n = 4 mice, 8 sessions per mouse; two-way repeated-measures (RM) ANOVA between arousal state and mice, arousal state: F2,14 = 36.95 (fluorescence) and 89.26 (transient rate), P = 2.6 × 10⁻⁶ (fluorescence) and 1.08 × 10⁻⁸ (transient rate); followed by Tukey’s post hoc tests, *P= 0.015, ***P=3 × 10⁻⁴, ****P= 1 × 10⁻⁶ (fluorescence) and ****P(wake-NREM) = 9 × 10⁻⁵, (wake–REM) = 9 × 10⁻⁶ and (NREM–REM) = 6 × 10⁻⁹. (f) Fluorescence aligned to arousal state transitions. Top, individual transitions with color-coded fluorescence intensity (wake-NREM, n = 254; NREM-wake, n = 172; NREM–REM, n=86; REM-wake, n = 84). Bottom, average responses from all the transitions expressed as mean (blue trace) ± s.e.m. (gray shading). Trials in top panel are sorted by the duration of the second state (shortest, top; longest, bottom).
Figure 2
Figure 2
Chemogenetic inhibition of Th+ VTA neurons decreases wakefulness and increases sleep. (a) hM4Di expression in the VTA and co-expression of mCherry in Th+ cells (one of seven mice). (b) Schematic of injection and implant. (c) Hypnogram, fast Fourier transform–derived delta power and EMG activity over 2 h after injection (one of seven mice). (d) Percent (mean ± s.e.m.) time in wake, NREM and REM sleep during 2 h after njection (n = 7 per group, two-way RM ANOVAs between compound injected and virus, interaction: F1,12 = 41.96 (wake), 42.03 (NREM), 9.64 (REM); P = 3 × 10⁻⁵ (wake and NREM), 0.0091 (REM)). (e) Representative EEG-EMG traces. EEG power spectrogram (μV) of (f) wake-to-NREM sleep transitions and (g) NREM-to-REM sleep transitions (aligned to state transition at 8 s and 60 s, respectively; dashed white line). Presented are averages across all transitions (wake-to-NREM, n = 99 transitions (saline) and n = 138 (CNO); NREM-to-REM n = 10 (saline) and n = 30 (CNO)), in all mice (n = 6 per group). (h–l) Sleep–wake parameters (mean ± s.e.m.) during the 2 h after injection (n = 7 per group, two-way RM ANOVAs followed by Sidak’s post hoc tests, *P = 0.011, **P(CNO: mCherry-hM4Di) = 0.009 and (hM4Di: saline-CNO) = 0.001, ***P = 2 × 10⁻⁴, ****P(NREM–hM4Di: saline–CNO) = 7 × 10⁻⁵, ****P(REM-CNO: mCherry-hM4Di) = 5 × 10⁻⁵. (h) EEG power spectrum of arousal states episodes (two-way RM ANOVAs between compound injected and frequency, compound injected: P > 0.18). (i,j) Latency to the first (i) NREM and (j) REM sleep episode (interaction: F1,12 = 11.03 (NREM), 0.16 (REM); P = 0.006 (NREM), 0.96 (REM)). (k) Duration of individual arousal state episodes (interaction: F1,12 = 13.83 (NREM), 0.15 (REM); P = 0.004 (NREM), 0.71 (REM)). (l) The total number of arousal state episodes (interaction: F1,12 = 0.93 (NREM), 15.52 (REM); P = 0.35 (NREM), 0.002 (REM)).
Figure 3
Figure 3
Activity in Th+ VTA neurons is necessary for wake maintenance even in the face of salient stimuli, (a) Th+ VTA neurons population activity in response to salient stimuli. Time 0 represents contact with food or predator odor and the placement of the female mouse in the cage. Presented are average responses (n = 4 mice; blue trace) ± s.e.m. (gray shading). (b-d,f-h) Percent time in wake, NREM and REM sleep (mean ± s.e.m.; n = 4 per group for b-d,f,h and n = 5 for g; two-way RM ANOVA between compound injected and viral transduction, followed by Sidak’s post hoc test; *P < 0.05, **P < 0.01, ***P < 0.001, ****P < 0.0001. (b) In the presence of high-fat chow (interaction: F1,6 = 6.75 (wake) and 7.58 (NREM), P= 0.04 (wake) and 0.03 (NREM)). (c,d) In the presence of inaccessible high-fat chow (c) in normally fed mice (interaction: F1,6 = 241.3 (wake) and 162.1 (NREM), P= 4.5 × 10⁻⁶ (wake) and 1.4 × 10⁻⁵ (NREM)) and (d) in 16-h food-deprived mice (interaction: F1,6 = 193.1 (wake) and 173.1 (NREM), P= 8.65 × 10⁻⁶ (wake) and 1.9 × 10⁻⁵ (NREM)). (e) Amount (mean ± s.e.m.) of high-fat chow consumed during a 1-h test period in the presence of 6 g high-fat chow (interaction: F1,6 = 1.45, P= 0.27). (f) In the presence of a freely moving female mouse (interaction: F1,6 = 12.31 (wake) and 12.56 (NREM), P= 0.01 for wake and NREM)). (g) In the presence of an inaccessible female mouse (interaction: F1,8 = 50.22 (wake) and 34.97 (NREM), P= 0.0001 (wake) and 3.5 × 10⁻⁴ (NREM)). (h) In the presence of a predator odor (virus: F1,6 = 13.9 (wake) and 14.75 (NREM), P= 0.0098 (wake) and 0.0086 (NREM); compound injected: F1,6 = 16.9 (wake) and 17.47 (NREM), P= 0.0063 (wake) and 0.0058 (NREM)).
Figure 4
Figure 4
Chemogenetic inhibition of Th+ VTA neurons promotes nest-building behavior. (a) Diagram of experiment. (b) Percentage (mean ± s.e.m.) of time spent awake, in NREM sleep and in REM sleep following the transfer to a new cage in mCherry and hM4Di mice (n = 4 per group). Two-way RM ANOVA between compound injected and viral transduction, interaction: F1,6 = 5.847 (wake) and 6.328 (NREM), P = 0.052 (wake) and 0.0456 (NREM); followed by Sidak’s post hoc tests, *P(hM4Di: saline–CNO) = 0.02, (CNO: mCherry-hM4Di) = 0.007. (c) Representative pictures of mCherry and hM4Di mouse cages following saline (top) and CNO (bottom) injections at the end of the 1-h test period (one each of 13 mCherry and 9 hM4Di mice). (d) Nesting score (mean ± s.e.m.) represents the amount of nesting material used and shape of the nest during the 1-h test period (1, poor; 5, good). Wilcoxon matched-pairs signed rank test, mCherry: n = 13, W = 3, P = 0.75; hM4Di: n = 9, W = 45, **P = 0.0039. (e) Diagram of experiment. (f) Percentage (mean ± s.e.m.) of time spent awake, in NREM and REM sleep during the test hour following the transfer to a new cage, in mCherry and hM4Di mice (n = 4 per group). Two-way RM ANOVA between compound injected and viral transduction, followed by Sidak’s post hoc tests: P(CNO: mCherry–hM4Di) = 5 × 10⁻⁵ and (hM4Di: saline–CNO) = 0.001. (g) Representative pictures of mCherry and hM4Di mouse cages following saline (top) and CNO (bottom) injections, at the end of the 1-h test period (n = 4 mice each). (h) Timeline of experiment. (i) Fluorescence changes during novel object exploration, active waking and nest-building, calculated per 1-s epoch. Box plot: central mark indicates median; bottom and top edges indicate the 25th and 75th percentiles, respectively. The whiskers extend to the most extreme data points not considered outliers, and the outliers are plotted ndividually using the “+” symbol. From 4 mice, novel object, n = 374 epochs; active waking n = 2,801 epochs; nest-building n = 2,143 epochs), two-way ANOVA between behavioral state and mice, behavioral state: F3,2 = 37.25, P = 5.2 × 10−50; followed by Sidak’s post hoc tests, P(active waking-novel object) = 1 × 10⁻⁵, (active waking–nest building) = 9 × 10⁻¹⁰ and (novel object–nest building) = 9 × 10⁻¹⁰. (j) Mean (± s.e.m.) transient rate during novel object exploration, active waking and nest-building (n = 4 mice). One-way ANOVA; F2,9 = 10.56, P = 0.0044; followed by Tukey’s multiple comparisons test, **P = 0.0033
Figure 5
Figure 5
Optogenetic activation of Th+ VTA neurons is sufficient to initiate wakefulness. (a) Representative immunofluorescence image of the VTA from an eYFP mouse, showing expression of the fluorescent protein eYFP and Th+ cells of the VTA. Scale bar, 50 μm (one of eight mice). (b) Schematic of injection and implant. (c) Representative traces of EEG-EMG recordings showing an immediate sleep-to-wake transition during NREM sleep after acute photostimulation (25 Hz for 5 s) of Th+ VTA neurons during the inactive (light) phase in a mouse transduced with ChR2 (bottom) but not in a mouse transduced with eYFP (top). (d) Mean latency (± s.e.m.) to wake from NREM sleep following optogenetic stimulation at 1 and 25 Hz of eYFP (white) and ChR2 (blue) mice (n = 8 per group; 6–10 stimulations per frequency per mouse). Two-way RM ANOVA between stimulation condition and viral transduction; F1,14 = 63.27 (virus), 38 (frequency) and 28.34 (interaction), P = 1.4 × 10⁻⁶ (virus), 2.5 × 10⁻⁵ (frequency) and 1 × 10⁻⁴ (interaction); followed by Sidak’s post hoc tests, *P = 0.035, ****P(ChR2: 1 HzαΔ±μ–25 Hz) = 2 × 10⁻⁶ and P(25 Hz: eYFP–ChR2) = 5 × 10⁻¹⁰. (e) Mean latency (± s.e.m.) to wake from REM sleep following optogenetic stimulation at 1 and 25 Hz of eYFP (white) and ChR2 (blue) mice (n = 9 per group; 6–10 stimulations per frequency per mouse). Two-way RM ANOVA between stimulation condition and viral transduction; F1,16 = 59.25 (virus), 1.2 (frequency) and 3.45 (interaction), P = 1 × 10⁻⁶ (virus), 0.29 (frequency) and 0.08 (interaction).
Figure 6
Figure 6
Optogenetic activation of Th+ VTA neurons is sufficient to maintain wakefulness and suppress nest-building behavior. (a) Diagram of stimulation protocol. (b,c) Representative hypnogram, fast Fourier transform–derived delta power and EMG activity over the 12 h of the nactive, light phase in (b) an eYFP and (c) a ChR2 mouse. Light blue shading represents the stimulation phase. (d) Percent (mean ± s.e.m.) time spent awake (left), in NREM sleep (middle) and REM sleep (right) during 24 h, starting with the photostimulation (n = 7 per group; two-way RM ANOVA between time and viral transduction, interaction: F23,138 = 11.65 (wake), 10.38 (NREM), and 12.18 (REM), P = 1 × 10⁻¹⁵ for wake, NREM and REM sleep; followed by Sidak’s post hoc tests, Wake: P(ZT 0) = 3 × 10⁻⁶, P(ZT 1) = 3 × 10⁻¹⁰, P(ZT 2) = 4 × 10⁻⁹, P(ZT 3) = 5 × 10⁻⁸, P(ZT 4) = 5 × 10⁻⁹, P(ZT 5) = 1 × 10⁻⁶; NREM: P(ZT 0) = 3 × 10⁻⁶, P(ZT 1) = 1 × 10⁻⁹, P(ZT 2) = 3 × 10⁻⁸, P(ZT 3) = 1 × 10⁻⁷, P(ZT 4) = 9 × 10⁻⁹, P(ZT 5) = 4 × 10⁻⁶; REM: P(ZT 0) = 0.02, P(ZT 1) = 1 × 10⁻⁷, P(ZT 2) = 3 × 10⁻⁹, P(ZT 3) = 8 × 10⁻⁶, P(ZT 4) = 2 × 10⁻⁵, P(ZT 5) = 5 × 10⁻⁶, P(ZT 14) = 0.025, P(ZT 15) = 0.003, P(ZT 16) = 0.01, P(ZT 18) = 0.03, P(ZT 19) = 0.03, P(ZT 20) = 0.03. (e) Duration (mean ± s.e.m.) per 6-h bin; n = 7 per group; two-way RM ANOVA between time and viral transduction; interaction: F3,36 = 54.92 (wake), 81.64 (NREM), and 56.8 (REM), P = 1.6 × 10⁻¹³ (wake), 1 × 10⁻¹⁵ (NREM), and 9.9 × 10⁻¹⁴ (REM). (f) Diagram of experiment. (g) Representative pictures of the cages of eYFP and ChR2 mice at the end of the 3-h stimulation period at 0 Hz and 25 Hz (one of eight each). (h) Nesting score (mean ± s.e.m.); n = 8 mice per group, Wilcoxon matched-pairs signed rank test; eYFP: W = 0, P = 0.99; ChR2: W = −36, **P = 0.0078.
Figure 7
Figure 7
Th+ VTA neuron projections differentially modulate arousal. (a–d) Representative images of Th+ VTA fibers expressing ChR2 at the (a) NAc, (b) mPFC, (c) CeA and (d) DLS. Scale bars, 100 μm (one of six mice for a and b and one of four mice for c and d). Note that each column represents one output region. (e–h) Mean latency (± s.e.m.) to wake from NREM sleep following optogenetic stimulation at 1 and 25 Hz of eYFP and ChR2 mice (8–12 stimulations per frequency per mouse); two-way RM ANOVA between frequency and viral transduction (interactions: F1,10 = 5.4 (NAc), F1,12 = 0.94 (mPFC), F1,6 = 31.71 (CeA), F1,6 = 29.73 (DLS), P(NAc) = 0.042, P(mPFC) = 0.35, P(CeA) = 0.001, P(DLS) = 0.002), followed by Sidak’s post hoc tests (NAc: **P = 0.002, ****P = 9 × 10⁻⁶, CeA: **P = 0.001, ****P = 1 × 10⁻⁵, DLS: *P = 0.046, ***P = 2 × 10⁻⁴, ****P = 4 × 10⁻⁷). (i–l) Mean atency (± s.e.m.) to wake from REM sleep following optogenetic stimulation at 1 and 25 Hz of eYFP and ChR2 mice (8–12 stimulations per frequency per mouse); two-way RM ANOVA between frequency and viral transduction (interactions: F1,10 = 0.8 (NAc), F1,12 = 5.081 (mPFC), F1,6 = 1.032 (CeA), F1,6 = 1.94 (DLS); P(NAc) = 0.3, P(mPFC) = 0.043, P(CeA) = 0.35 , P(DLS) = 0.2; virus (CeA): F1,6 = 6.207, P = 0.047) followed by Sidak’s post hoc tests (mPFC: **P = 0.003, ****P = 9 × 10⁻⁶). (mx) The percentage (mean ± s.e.m.) of time spent (mp) awake, (qt) in NREM sleep and (ux) in REM sleep during 24 h starting with photostimulation of the different output regions in eYFP (white) and ChR2 (blue) mice. n = 6 per group for NAc and mPFC and n = 4 per group for CeA and DLS experiments; two-way RM ANOVA between time and viral transduction (NAc interactions: wake F23,115 = 2.829, P = 0.0001; NREM F23,115 = 2.455, P = 0.0009; REM: F23,115 = 2.938, P = 8 × 10⁻⁵), followed by Sidak’s post hoc tests (NAc wake: P(ZT 0) = 0.005, P(ZT 1) = 0.022, P(ZT 2) = 0.0004; NREM: P(ZT 0) = 0.003, P(ZT 2) = 0.001; REM: P(ZT 1) = 0.01, P(ZT 2) = 0.005).

Comment in

  • Too bored to stay awake.
    Happ M, Halassa MM. Happ M, et al. Nat Neurosci. 2016 Sep 27;19(10):1274-6. doi: 10.1038/nn.4383. Nat Neurosci. 2016. PMID: 27669985 No abstract available.

References

    1. Robbins TW, Everitt BJ. A role for mesencephalic dopamine in activation: commentary on Berridge (2006) Psychopharmacology (Berl.) 2007;191:433–437. - PubMed
    1. Berridge KC, Robinson TE. What is the role of dopamine in reward: hedonic impact, reward learning, or incentive salience. Brain Res. Brain Res. Rev. 1998;28:309–369. - PubMed
    1. Salamone JD, Correa M. The mysterious motivational functions of mesolimbic dopamine. Neuron. 2012;76:470–485. - PMC - PubMed
    1. Wise RA. Dopamine, learning and motivation. Nat. Rev. Neurosci. 2004;5:483–494. - PubMed
    1. Schultz W. Multiple dopamine functions at different time courses. Annu. Rev. Neurosci. 2007;30:259–288. - PubMed

Publication types