. 2016 Oct 20;538(7625):406-410.
doi: 10.1038/nature19794. Epub 2016 Sep 5.

Atomic structure of the entire mammalian mitochondrial complex I

Affiliations

Atomic structure of the entire mammalian mitochondrial complex I

Karol Fiedorczuk et al. Nature. .

Abstract

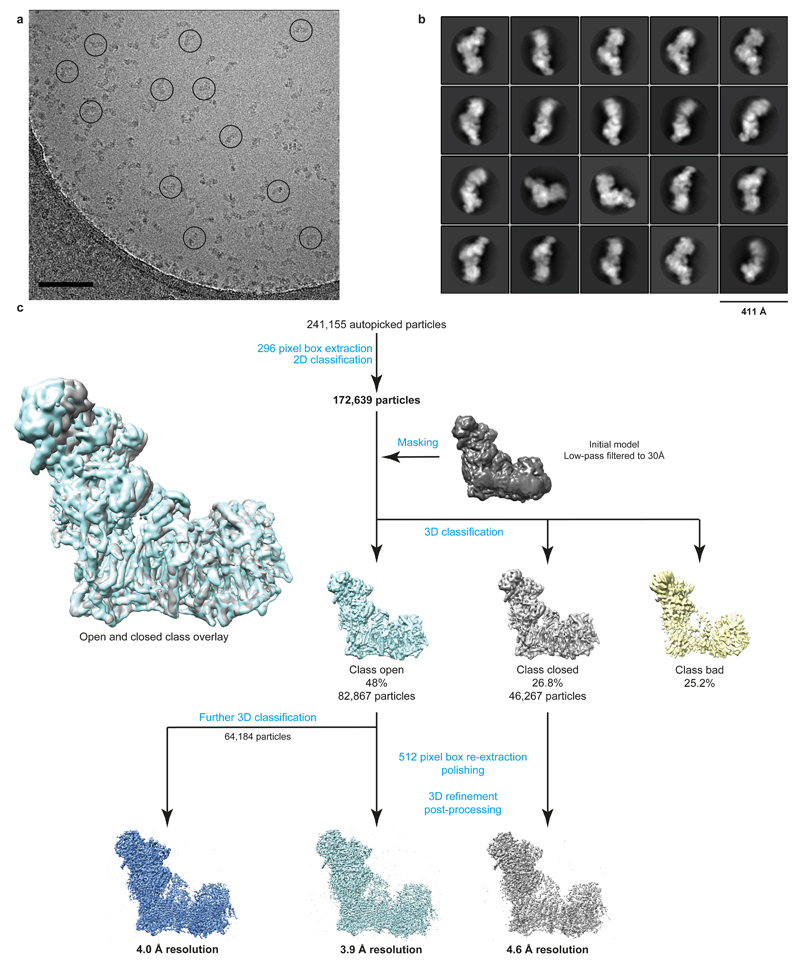
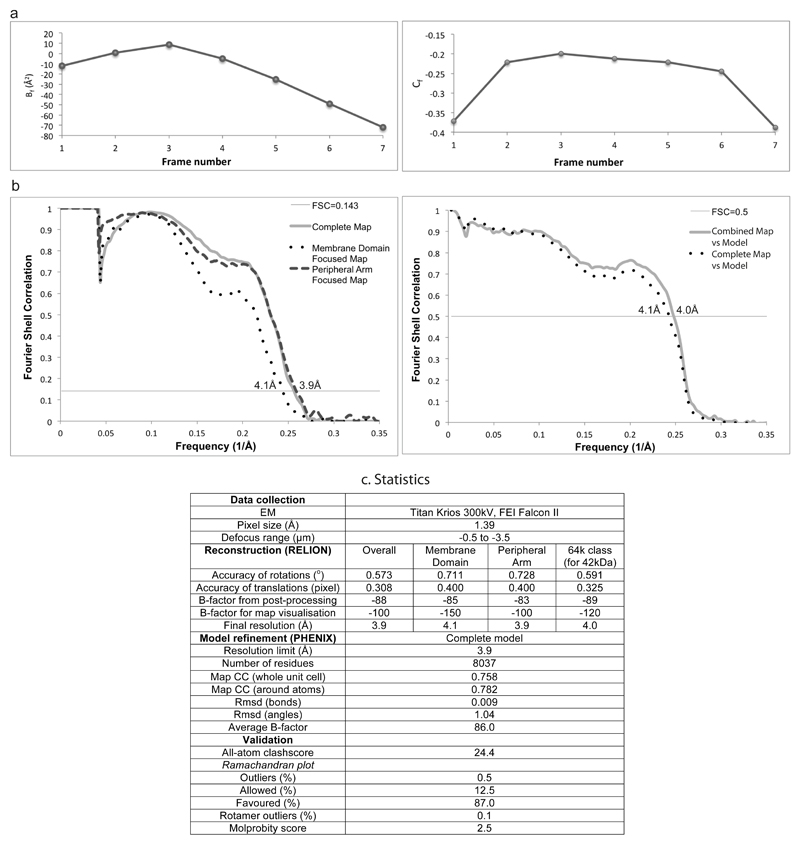
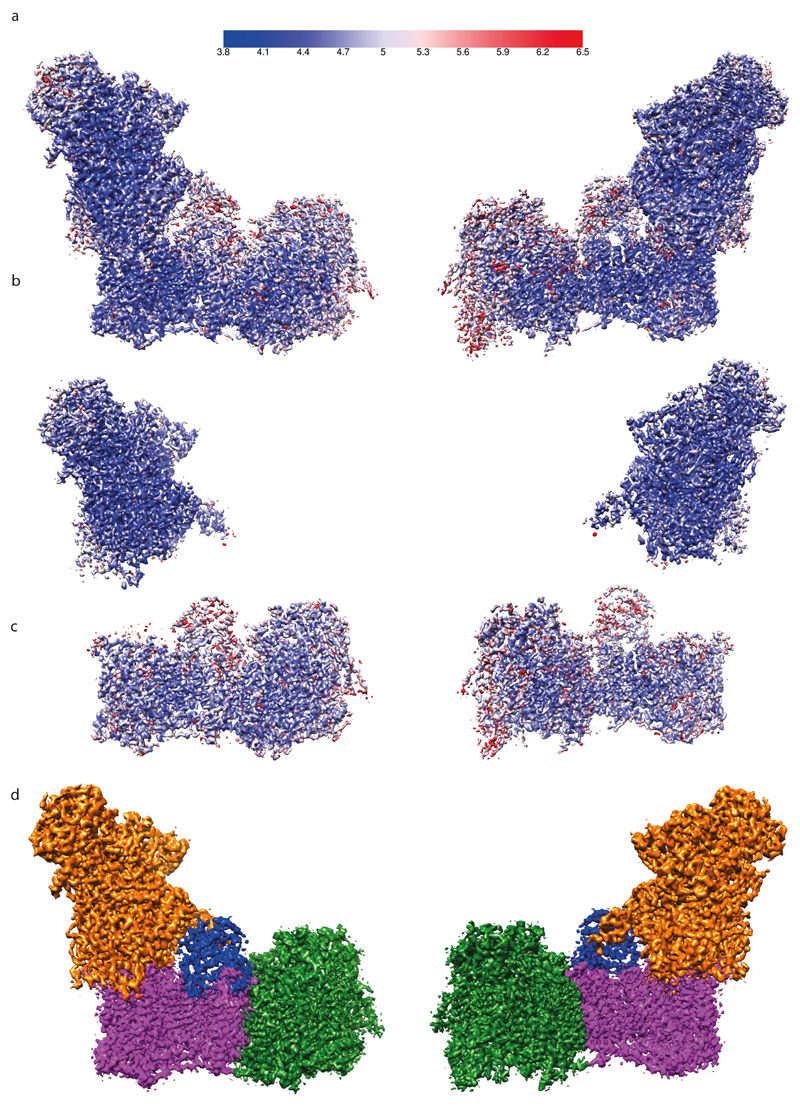
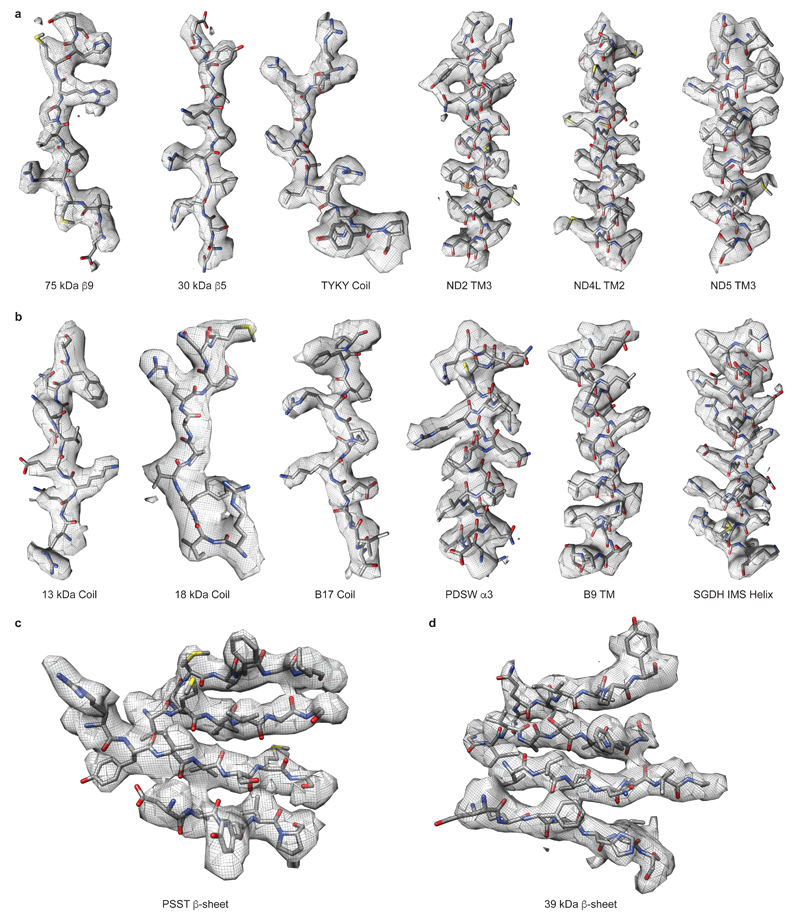
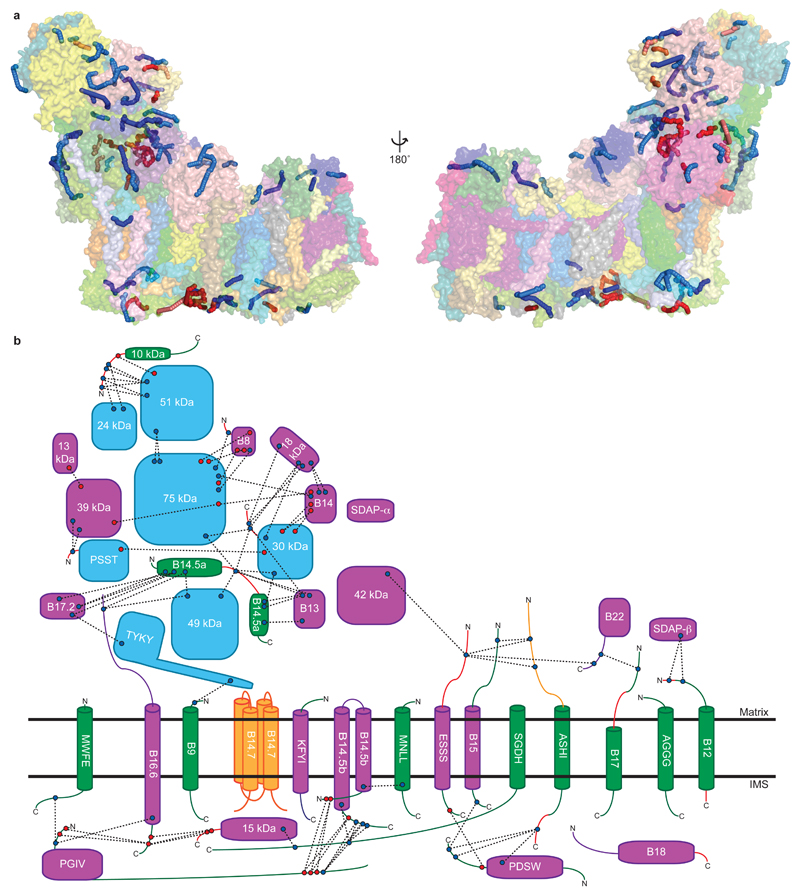
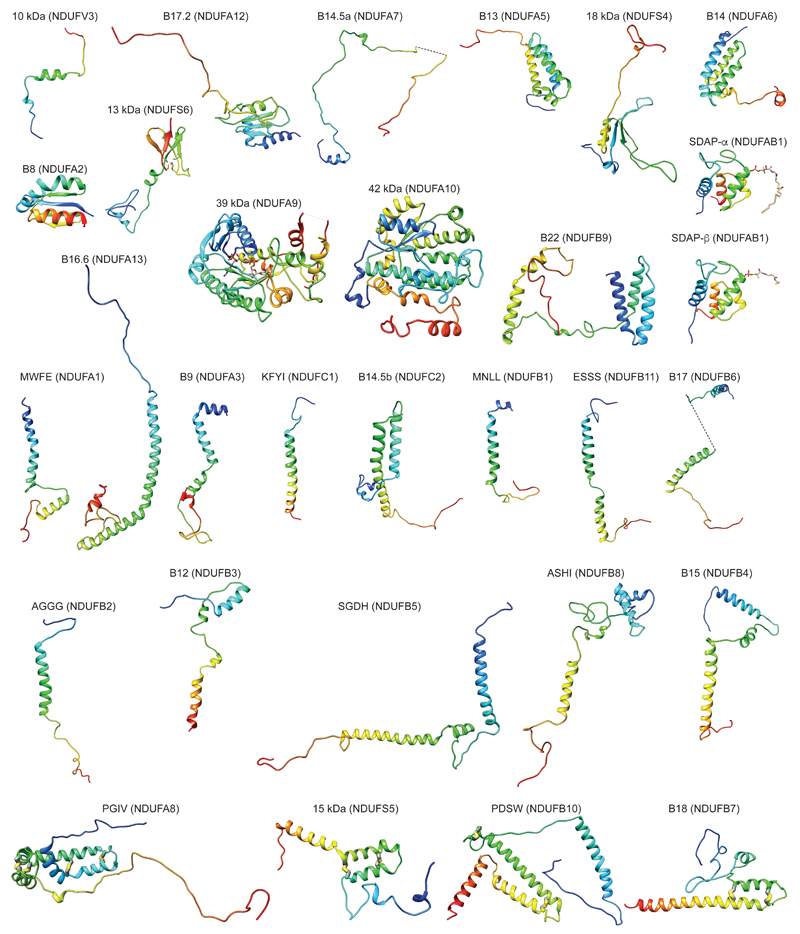
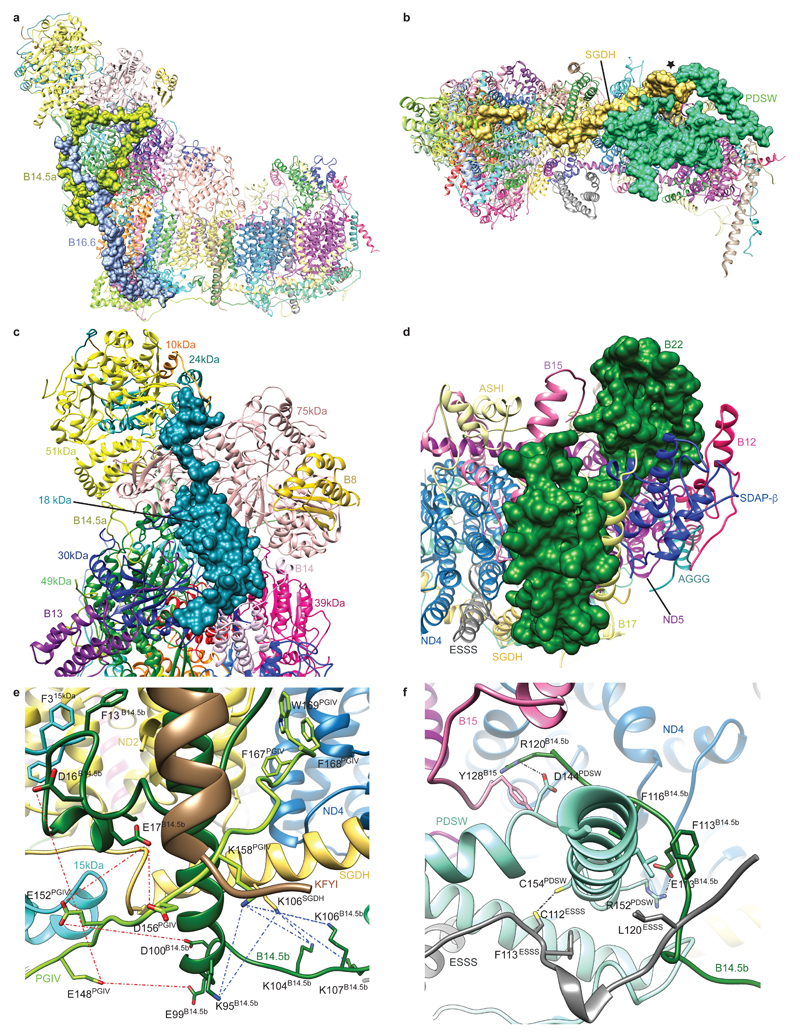
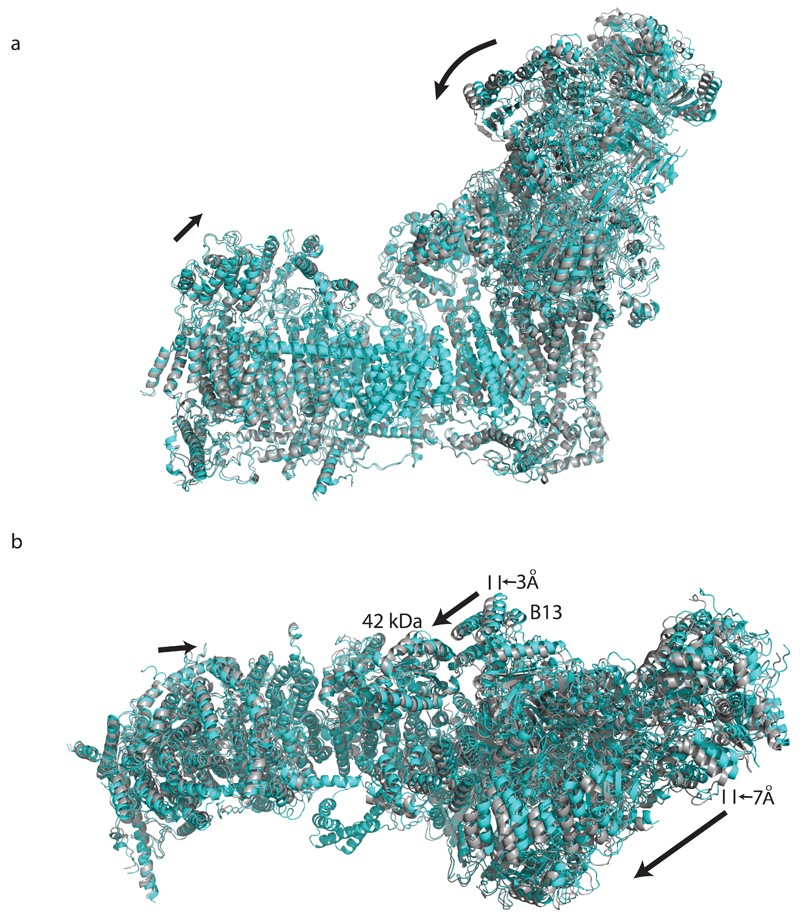
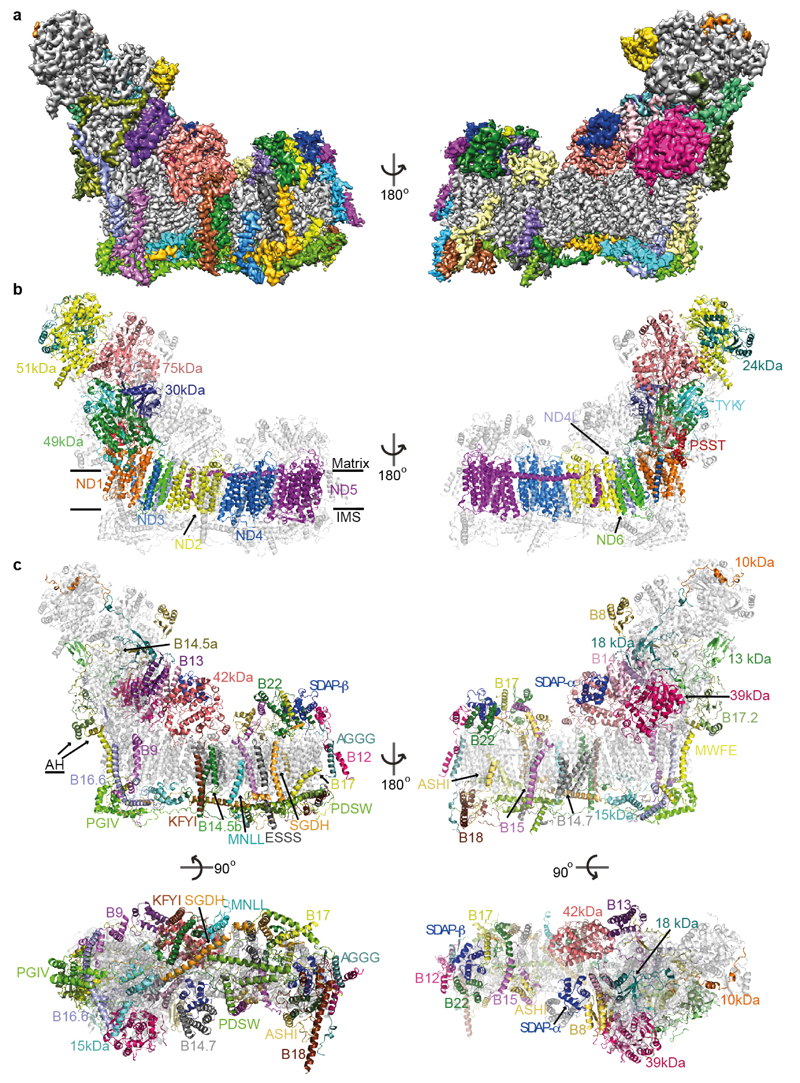
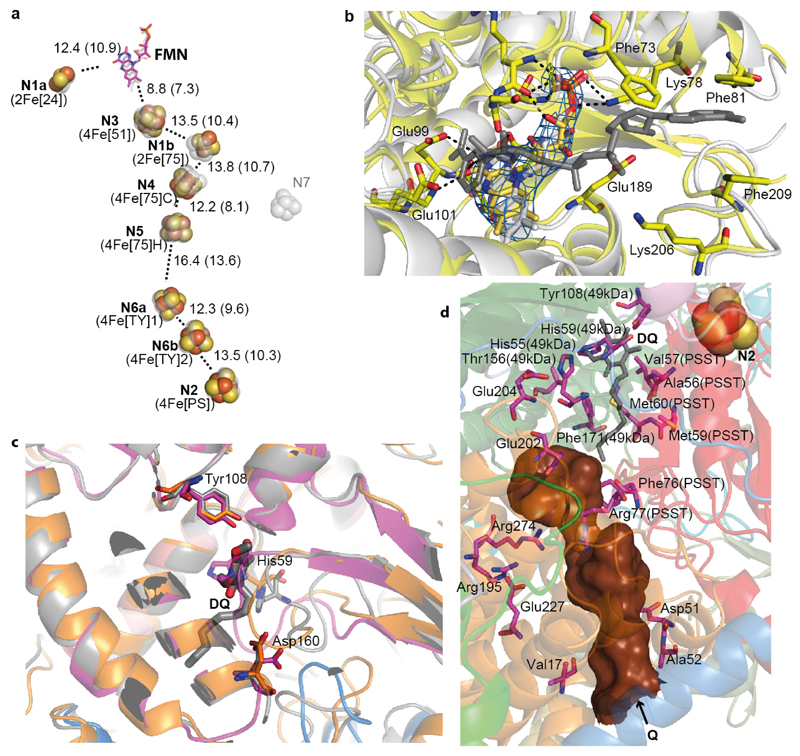
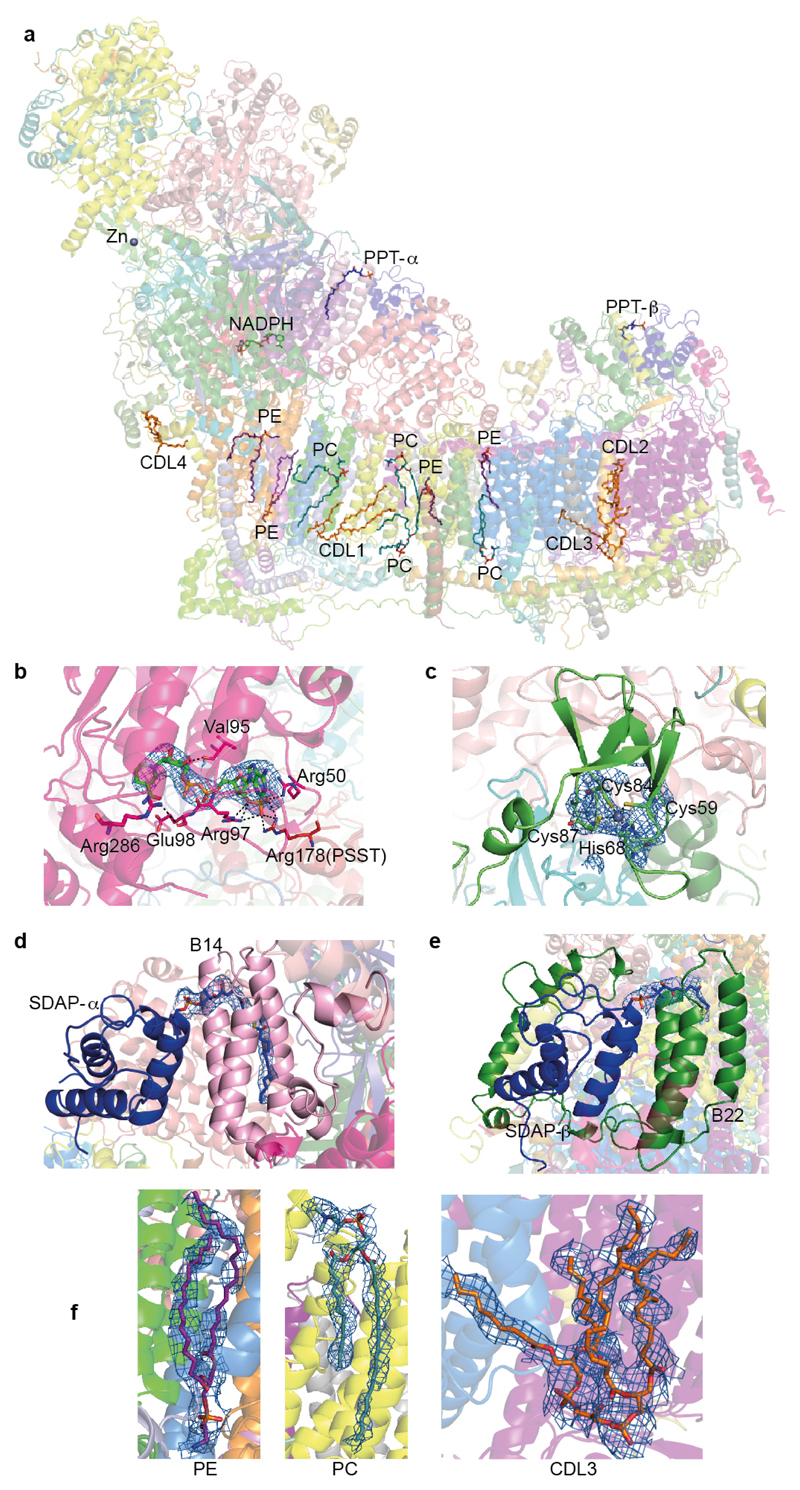
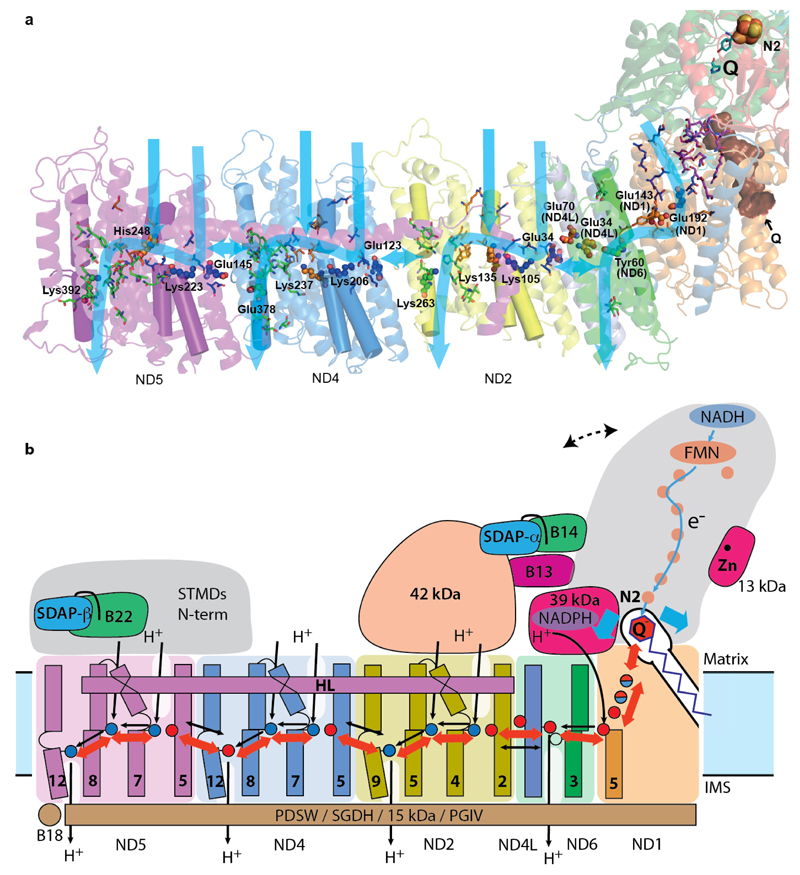
Mitochondrial complex I (also known as NADH:ubiquinone oxidoreductase) contributes to cellular energy production by transferring electrons from NADH to ubiquinone coupled to proton translocation across the membrane. It is the largest protein assembly of the respiratory chain with a total mass of 970 kilodaltons. Here we present a nearly complete atomic structure of ovine (Ovis aries) mitochondrial complex I at 3.9 Å resolution, solved by cryo-electron microscopy with cross-linking and mass-spectrometry mapping experiments. All 14 conserved core subunits and 31 mitochondria-specific supernumerary subunits are resolved within the L-shaped molecule. The hydrophilic matrix arm comprises flavin mononucleotide and 8 iron-sulfur clusters involved in electron transfer, and the membrane arm contains 78 transmembrane helices, mostly contributed by antiporter-like subunits involved in proton translocation. Supernumerary subunits form an interlinked, stabilizing shell around the conserved core. Tightly bound lipids (including cardiolipins) further stabilize interactions between the hydrophobic subunits. Subunits with possible regulatory roles contain additional cofactors, NADPH and two phosphopantetheine molecules, which are shown to be involved in inter-subunit interactions. We observe two different conformations of the complex, which may be related to the conformationally driven coupling mechanism and to the active-deactive transition of the enzyme. Our structure provides insight into the mechanism, assembly, maturation and dysfunction of mitochondrial complex I, and allows detailed molecular analysis of disease-causing mutations.


Conflict of interest statement

The authors declare no competing financial interests.

Figures

Extended Data Figure 1
Extended Data Figure 1. Image processing procedures.
a. Representative micrograph of 2.6k micrographs collected which all varied somewhat in defocus, ice thickness and particle count, with good quality particles circled. Scale bar = 100 nm. b. Representative 2D class averages obtained from reference-free classification. c. Classification and refinement procedures used in this study.
Extended Data Figure 2
Extended Data Figure 2. Image and model refinement procedures.
a. Radiation-damage weighting. Relative B-factors (Bf) and intercepts (Cf) from the Relion particle polishing procedure. b. Left, gold-standard (two halves of data refined independently) FSC curves for the maps of the entire complex complete map (resolution at FSC = 0.143 is 3.9 Å), membrane domain (MD) focused refinement (4.1 Å resolution) and peripheral arm (PA) focused refinement (3.9 Å resolution). Right, FSC curve of the combined map vs final model shows good agreement of the model with the map (FSC=0.5 at 4.0 Å resolution). FSC curve against the entire complex complete map, which was not used in refinement, is shown as a control. c. Statistics of refinement.
Extended Data Figure 3
Extended Data Figure 3. Local resolution estimation and combination of maps for model building.
Local resolution estimation by Resmap of a. entire complex I, b. peripheral arm focused refinement map and c. membrane domain focused refinement map. Maps are coloured according to the shown resolution scale in Å. d. The final map was produced by combining maps with the best local resolution features, i.e. for peripheral arm – PA focused refinement map (orange), for the distal part of membrane domain – MD focused refinement map (green), for 42 kDa subunit – map from the selected homogenous complex I class (64k particles; blue) and the rest of the complex from the best map of the entire complex (magenta).
Extended Data Figure 4
Extended Data Figure 4. Examples of cryo-EM density.
Coils and α-helices from a. core and b. supernumerary subunits. Example β-sheets from c. core PSST subunit and d. supernumerary 39 kDa subunit. Cryo-EM density is shown with the model represented as sticks and coloured by atom with carbon grey, oxygen red, nitrogen blue and sulphur yellow.
Extended Data Figure 5
Extended Data Figure 5. Identified cross-links.
a. Solvent accessible surface (SAS) representation of cross-links. Surfaces for complex I subunits are shown transparent and coloured as in Fig. 1. Shortest (SAS) paths calculated using Xwalk are shown for cross-links as coloured worms with inter-subunit lysine reactive cross-links in blue, inter-subunit acid reactive cross-links in red, intra-subunit lysine reactive cross-links in light blue, intra-subunit acid reactive cross-links in light red. b. Inter-subunit cross-link schematic. Complex I subunits are shown in a similar orientation as in a. left panel with core subunits cyan, previously assigned supernumerary subunits in magenta, newly assigned or newly built regions of supernumerary subunits in green, poly-alanine regions in orange and unmodelled regions in red. Observed cross-links are indicated by dashed black lines between either blue circles (lysine reactive cross-links) or red circles (acid reactive cross-links). No cross-links were observed to the core subunits of the membrane arm and hence they were omitted for clarity. The horizontal black lines indicate the approximate boundaries of the IMM. Subunits B14.7, B15 and ASHI are shown as being behind the membrane boundaries as they are found on the opposite (far) side of the membrane arm.
Extended Data Figure 6
Extended Data Figure 6. Folds of supernumerary subunits.
Subunits are shown in cartoon representation, coloured blue to red from N- to C-terminus. Disulphide bridges are shown as sticks with sulphur in yellow.
Extended Data Figure 7
Extended Data Figure 7. Examples of supernumerary subunits interactions.
a. Side view of complex I showing surfaces for subunits B14.5a and B16.6. b. IMS view of complex I showing surfaces for subunits SGDH and PDSW. The point at which the two subunits are intertwined is marked with a star. c. View of the hydrophilic arm looking from above the membrane arm. The surface of the 18 kDa subunit which spans the hydrophilic arm is shown. d. Matrix view of the tip of the membrane arm with the surface of supernumerary subunit B22 shown. e. Close up of the centre of the membrane arm on the IMS side. This region contains many interactions between supernumerary subunits and the side chains of residues involved are shown. The region is also a hot spot for cross-links, the side chains involved are shown and cross-links are indicated with dashed lines (acid cross-links: red; basic cross-links: blue). f. Close up of the C-terminal helix of supernumerary subunit PDSW at the centre of the membrane arm on the IMS side. This helix extends away from complex I and is encircled by the C-termini of supernumerary subunits B14.5b, ESSS and B15. The side chains of residues involved in stabilizing interactions are shown. A possible disulphide bond between PDSW (Cys154) and ESSS (Cys112) and stabilizing salt-bridges are indicated by dashed lines. Subunits are coloured as in Fig. 1.
Extended Data Figure 8
Extended Data Figure 8. Comparison of “open” and “closed” 3D class structures.
a. Side and b. top view from the matrix for the alignment of the “open” class structure (in cyan) and “closed” class structure (in gray). To generate the closed class structure, the final structure of the “open” class was refined in real space in Phenix (5 macro cycles with morphing at each cycle) against 4.6 Å map of the “closed” class (Extended Data Fig. 1). All the α-helices were well fit into density, but due to low resolution of the “closed” class no further refinement was performed and the comparison of structures involves only the relative positions of secondary structure elements. The two structures were aligned via TM core subunits and are displayed as cartoon models. In the “closed” class the peripheral arm undergoes a hinge-like motion around the Q site towards the tip of the membrane domain, with the direction of shift indicated by the arrow in b. As a result, subunit B13 moves ~3 Å closer to the 42 kDa subunit, allowing for direct contacts. The shift is larger at the periphery, reaching 7 Å at the tip of the peripheral arm. Additionally, subunit ND5 and its matrix “bulge” move about 3 Å towards peripheral arm.
Figure 1
Figure 1. Structure of ovine complex I.
a. Cryo-EM density coloured by subunit, with core subunits in grey (left-right view). b. Structure depicted as a cartoon, with core subunits coloured and labelled, and supernumerary in grey and transparent. Approximate lipid bilayer boundaries are indicated. c. Structure depicted with core subunits in grey and supernumerary subunits coloured and labelled (left-right, matrix-IMS views). Amphipathic helices at the “back” of the complex, likely attached to the lipid bilayer, are indicated as AH.
Figure 2
Figure 2. Arrangement of redox centers and substrate binding sites.
a. Fe-S clusters are shown as spheres with centre-to-centre and edge-to-edge (in brackets) distances indicated in Å, overlaid with transparent grey depictions from T. thermophilus. Both traditional and structure-based (in brackets) nomenclature for clusters is shown. b. NADH binding site (overlay with T. thermophilus structure in grey, containing NADH). Cryo-EM density for FMN is shown in blue. Key residues involved in interactions with FMN and NADH are shown as sticks. c. Quinone binding site with subunits coloured as Fig.1. Key β1-β249-kDa loop deviates from bacterial structure (grey) and is more similar to Y. lipolytica (orange, PDB 4WZ712), clashing with the decyl-ubiquinone (DQ) head group position in T. thermophilus (grey). d. Environment surrounding the Q cavity (brown surface, entrance point indicated by an arrow), with some of functionally important residues shown as sticks and labelled with non-ND1 subunit names in brackets. The quinone from the aligned T. thermophilus structure is shown in grey (DQ), demonstrating that the distal part of the cavity is blocked in the ovine enzyme.
Figure 3
Figure 3. Additional cofactors identified in the structure.
a. Overview of the model coloured as in Fig. 1c, with cofactors shown as sticks and labeled as PPT for phosphopantetheine, CDL for cardiolipin, PC for phosphatidylcholine and PE for phosphatidylethanolamine. b. NADPH in the 39 kDa subunit. Interacting residues are shown. c. Zn2+ ion in the 13 kDa subunit, with coordinating residues. d. Phosphopantetheine in SDAP-α. e. Phosphopantetheine in SDAP-β. f. Lipids PE, PC and cardiolipin. All cofactors are shown with cryo-EM density carved to within 5 Å.
Figure 4
Figure 4. Mechanism of mitochondrial complex I.
a. Structure of the core subunits of ovine complex I coloured as in Fig. 1b, with polar residues in proton channels shown as sticks, with carbon in blue, orange and green for input, connecting and output parts respectively. Key residues GluTM5, LysTM7, Lys/HisTM8 and Lys/GluTM12 from the antiporters and the corresponding residues in the E-channel (near Q site) are shown as small spheres and labelled. These residues sit on flexible loops in discontinuous TM helices shown as cylinders. Polar residues linking the E-channel to the Q cavity (brown) are shown in magenta. Tyr10849-kDa and His5949-kDa are shown in cyan near the position of bound Q in bacteria. Possible proton translocation pathways are indicated by blue arrows. b. Graphic of the coupling mechanism. Core and some putatively regulatory supernumerary subunits are shown. Conformational changes, indicated by red arrows, propagate from the Q site/E-channel to antiporter-like subunits via the central hydrophilic axis. Shifts of helices near the cluster N2 (blue arrows) may help initiate the process. ND5 helix HL and traverse helices from four supernumerary subunits on the IMS side may serve as “stators”. Dashed line indicates the shift of peripheral arm in the “closed” conformation (Extended Data Fig. 8). NADPH-containing 39 kDa subunit and Zn-containing 13 kDa subunit are essential for activity and may serve as redox “sensors”. Both SDAP subunits interact with their LYR partners via “flipped out” phosphopantetheine (black line). The net result of one conformational cycle, driven by NADH:ubiquinone oxidoreduction, is the translocation of four protons across the membrane (black lines indicate possible pathways).

References

    1. Sazanov LA. A giant molecular proton pump: structure and mechanism of respiratory complex I. Nat Rev Mol Cell Biol. 2015;16:375–388. - PubMed
    1. Moser CC, Farid TA, Chobot SE, Dutton PL. Electron tunneling chains of mitochondria. Biochim Biophys Acta. 2006;1757:1096–1109. - PubMed
    1. Letts JA, Sazanov LA. Gaining mass: the structure of respiratory complex I-from bacterial towards mitochondrial versions. Curr Opin Struct Biol. 2015;33:135–145. - PubMed
    1. Fassone E, Rahman S. Complex I deficiency: clinical features, biochemistry and molecular genetics. J Med Genet. 2012;49:578–590. - PubMed
    1. Walker JE. The NADH - ubiquinone oxidoreductase (complex I) of respiratory chains. Q Rev Biophys. 1992;25:253–324. - PubMed

MeSH terms