. 2016 Oct;48(10):1131-41.
doi: 10.1038/ng.3659. Epub 2016 Sep 5.

Mutational signatures in esophageal adenocarcinoma define etiologically distinct subgroups with therapeutic relevance

Collaborators, Affiliations

Mutational signatures in esophageal adenocarcinoma define etiologically distinct subgroups with therapeutic relevance

Maria Secrier et al. Nat Genet. 2016 Oct.

Erratum in

Abstract

Esophageal adenocarcinoma (EAC) has a poor outcome, and targeted therapy trials have thus far been disappointing owing to a lack of robust stratification methods. Whole-genome sequencing (WGS) analysis of 129 cases demonstrated that this is a heterogeneous cancer dominated by copy number alterations with frequent large-scale rearrangements. Co-amplification of receptor tyrosine kinases (RTKs) and/or downstream mitogenic activation is almost ubiquitous; thus tailored combination RTK inhibitor (RTKi) therapy might be required, as we demonstrate in vitro. However, mutational signatures showed three distinct molecular subtypes with potential therapeutic relevance, which we verified in an independent cohort (n = 87): (i) enrichment for BRCA signature with prevalent defects in the homologous recombination pathway; (ii) dominant T>G mutational pattern associated with a high mutational load and neoantigen burden; and (iii) C>A/T mutational pattern with evidence of an aging imprint. These subtypes could be ascertained using a clinically applicable sequencing strategy (low coverage) as a basis for therapy selection.


Conflict of interest statement

Competing Financial Interests

The authors declare no competing financial interests.

Figures

Figure 1
Figure 1. Recurrent genomic events in the cohort (n = 129).
The top panel highlights the total number of protein-coding genes affected by copy number or structural changes (above the 0 axis), and point mutations or indels (below the 0 axis), respectively, for every patient (depicted on the X-axis). (a) The top rearranged genes, excluding fragile sites, containing structural variant hotspots and recurrent in >10% of patients. *INK4/ARF comprises the CDKN2A/2B locus. ‘Interchr trans’ = interchoromosomal translocation. (b) Fragile sites rearranged in at least 20% of the patients. (c) Mobile element (ME) insertions detected by structural variant analysis, plotted on a log2 scale. Grey tiles correspond to cases without any evidence of ME insertions. (d) Loci that are significantly amplified/deleted according to GISTIC2.0 and that are recurrent in >10% of the patients. The most extreme copy number alteration within the locus is shown for each patient (see Supplementary Tables 2 and 3 for lists of genes in such loci). Only amplification and deletions are counted for the frequency histogram. (e) Genes altered by nonsynonymous SNVs/indels, deemed significantly mutated by MutSigCV. Loss of heterozygosity (LOH) regions are indicated in black rectangles when the gene also presents a mutation, indicating likely loss of function. (f) Presence of genomic catastrophes. (g) Cellularities, estimated by histopathology (H) or computationally using ASCAT (A). All samples sequenced have passed the histopathological cellularity cut-off of 70%. The total frequency of a specific gene alteration or event in the cohort is shown on the right-hand side for each panel.
Figure 2
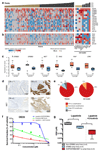
Figure 2. RTK copy number profiling and responses to targeted RTK therapy (n=129).
(a) RTK copy number gains/losses in the patient cohort and cell models. The score refers to: amplifications (2), homozygous deletions (–2), relative gains/losses (+1/–1) (Methods). Columns correspond to samples, ordered by the average ploidy. Samples with average ploidy ≥ 3 are highlighted as potentially whole-genome duplicated. (b) Copy number alterations in key genes of downstream pathways (c) Expression of RTKs and downstream key genes in samples with gains (light red) versus losses (light blue) of respective genes. The number of samples varies depending on the availability of cases with gain/loss (indicated in brackets). * marks p-values <0.05 after multiple testing correction. The solid horizontal line within the box represents the median. The interquartile range (IQR) is defined as Q3–Q1 with whiskers that extend 1.5 times the IQR from the box edges. (d) IHC staining of selected samples displaying consequences of copy number loss/gain in ERBB2 and MET. The GISTIC score (CN) is marked. (e) Breakdown of major resistance mechanisms to RTK-based monotherapy. “Amplification” denotes anything with a score ≥1. (f) Growth curve of OE33 cells after 72-hour exposure to Lapatinib, Crizotinib and in combination. Mean values as percentage of DMSO treated cells and ±SD for three experiments. Olaparib in combination was 1μM. (g) The effects of Lapatinib, Crizotinib and in combination on the cell lines with varying RTK status. Error bars represent the standard deviation. * indicates p-values <0.05.
Figure 3
Figure 3. Mutational signature-based clustering reveals differences in disease etiology in the cohort and is spatially consistent within a single tumor.
(a) The heat map highlights the sample exposures to six main mutational signatures, as identified in the cohort (n=120) using the NMF methodology. The strength of exposure to a certain signature may vary from 0% to 100% (on a color scale from grey to red). Three main subgroups can be observed from the clustering based on the predominant signature: C>A/T dominant (S18-like/S1 age) – orange, 32% samples; DDR impaired (S3-BRCA) – purple, 15% samples; and mutagenic (S17A/B dominant) – green, 53% samples. The TP53, ERBB2 status, and catastrophic event distribution in the corresponding genomes are highlighted below (no significant difference observed among subgroups). The total mutational burden is significantly higher in the mutagenic subgroup. Consensus clustering was used for the heat map (Methods). b) Validation of the mutational signature-based clustering in an independent cohort (n=87). Unsupervised hierarchical clustering (Pearson correlation distance, Ward linkage method) reveals three main subgroups, similar to the ones in the discovery cohort: (1) DDR impaired (S3-BRCA) dominant – purple, 22% of the cohort; (2) C>A/T dominant (S18-like/S1 age) – orange, 25% of the cohort; (3) mutagenic (S17A/B dominant) – green, 53% of the cohort. The total SNV burden is also highlighted, confirming higher abundance in the mutagenic subgroup. c) Mutational signature contributions in three cases with multiple sampling from the same tumor. The relative exposures to the 6 signatures are highlighted on a grey-to-red gradient for each case. The group assignment is based on the dominant signature.
Figure 4
Figure 4. DNA damage repair pathways altered through nonsynonymous mutations/indels in the cohort.
(a) For each of the three defined subgroups, the percentage of patients harboring defects in the different DDR-related pathways is shown. Only nonsynoymous mutations in genes mutated in the cohort significantly more compared to the expected background rate and predicted to be potentially damaging to the protein structure (Methods) have been considered in the analysis. (b) HR, CR and CPF genes altered in the three subgroups (the numbers in the gradients indicate how many patients have mutations in the respective gene). AM, alternative mechanism for telomere maintenance; BER, base excision repair; CPF, checkpoint factor; CR, chromatin remodelling; CS, chromosome segregation; FA, Fanconi anaemia pathway; HR, homologous recombination; MMR, mismatch repair; NER, nucleotide excision repair; NHEJ, non-homologous end joining; OD, other double-strand break repair; TLS, translesion synthesis; TM, telomere maintenance; UR, ubiquitylation response.
Figure 5
Figure 5. Neoantigen burden is significantly higher in the mutagenic subgroup and associates with an increased CD8+ T-cell density.
(a) From left to right: Neoantigen burden compared among the 3 mutational signature subgroups shows significant differences. A two-sided Welch’s t-test was used to compare the mutagenic group to the rest; Expression data available for a subset of the samples (25 from the mutagenic subgroup and 21 from the others) reveals that the number of expressed potential neoantigens is significantly higher in the mutagenic subgroup (Wilcoxon rank-sum test p = 0.042); Numbers of CD8+ T cells per mm2 observed in patients. Patients were grouped into the mutagenic group and BRCA+C>A/T dominant group (n = 10 for each group). (b) Two representative images of CD8 IHC staining from each group (magnification 200x, scale bar, 100μm).
Figure 6
Figure 6. Treatment response in different mutational signature groups.
(a) Three cell lines, OES127, MFD and CAM02 have been derived, each representative of a distinct signature-dominant subgroup: DDR impaired (OES127), mutagenic (MFD) and C>A/T dominant (CAM02). (b) Growth curves of OES127 cell lines after 72-hour exposure to Olaparib, Topotecan and in combination. Mean values as a percentage of DMSO treated cells and ±SD for three experiments are shown. Olaparib used in combination was kept at 1μM. (c) Growth curve of MFD cell lines after 72-hour exposure to MK-1775 and in AZD-7762. Mean values as a percentage of DMSO treated cells and ±SD for three experiments are shown.
Figure 7
Figure 7. Proposed subclassification of EAC based on mutational signatures informs etiology and, consequently, potential tailored therapies to be further investigated for the disease.
Patients are currently treated uniformly, but classification based on mutational signatures may enable targeted treatments that would complement classical therapy routes and potentially achieve more durable responses. The highlighted box (right) exemplifies classifying new patients into the defined etiological categories based on mutational signatures using a quadratic programming approach (see Methods). The bars highlight the relative contributions of the six expected signatures to the observed mutations in 7 new tumors (not part of the 129 sample cohort). The dominant signature is indicative of the group to which the sample should be assigned.

Comment in

References

    1. Ferlay J, et al. Cancer incidence and mortality worldwide: sources, methods and major patterns in GLOBOCAN 2012. International Journal of Cancer. 2015;136(5):E359–86. - PubMed
    1. Brown LM, Devesa SS, Chow WH. Incidence of adenocarcinoma of the esophagus among white Americans by sex, stage, and age. J Natl Cancer Inst. 2008;100(16):1184–7. - PMC - PubMed
    1. Cunningham D, Okines AF, Ashley S. Capecitabine and oxaliplatin for advanced esophagogastric cancer. N Engl J Med. 2010;362(9):858–9. - PubMed
    1. Allum WH, et al. Long-term results of a randomized trial of surgery with or without preoperative chemotherapy in esophageal cancer. J Clin Oncol. 2009;27(30):5062–7. - PubMed
    1. Cunningham D, et al. Perioperative chemotherapy versus surgery alone for resectable gastroesophageal cancer. N Engl J Med. 2006;355(1):11–20. - PubMed

Publication types

MeSH terms

Supplementary concepts