. 2016 Sep 19;213(10):1983-98.
doi: 10.1084/jem.20151853. Epub 2016 Sep 5.

GM-CSF primes cardiac inflammation in a mouse model of Kawasaki disease

Affiliations

GM-CSF primes cardiac inflammation in a mouse model of Kawasaki disease

Angus T Stock et al. J Exp Med. .

Abstract

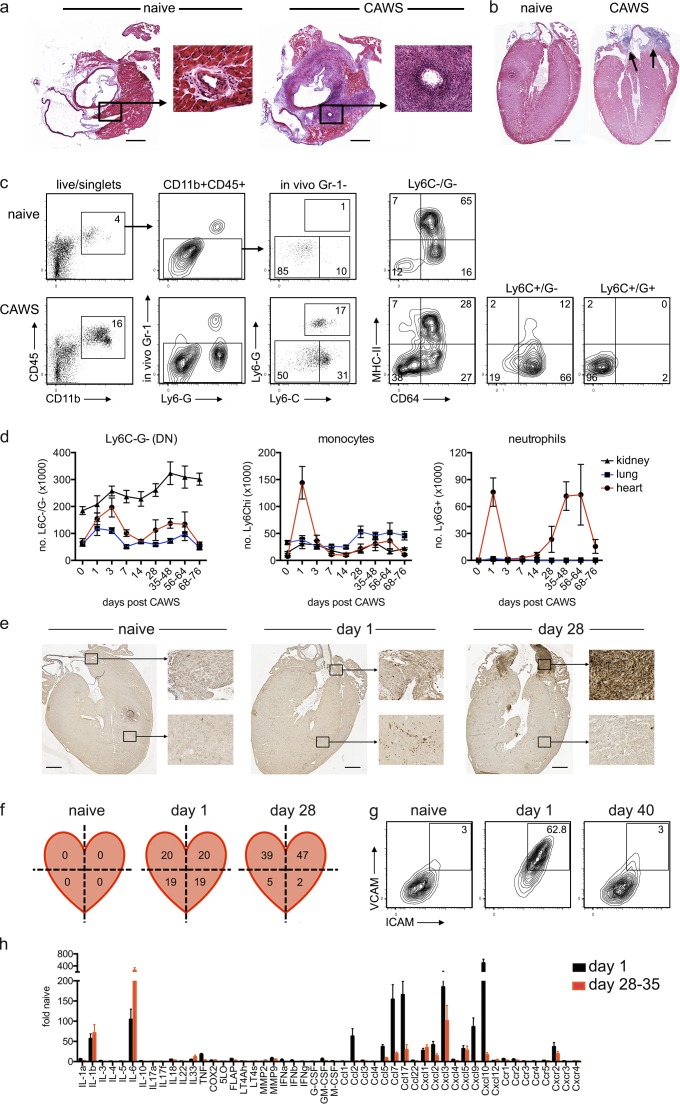
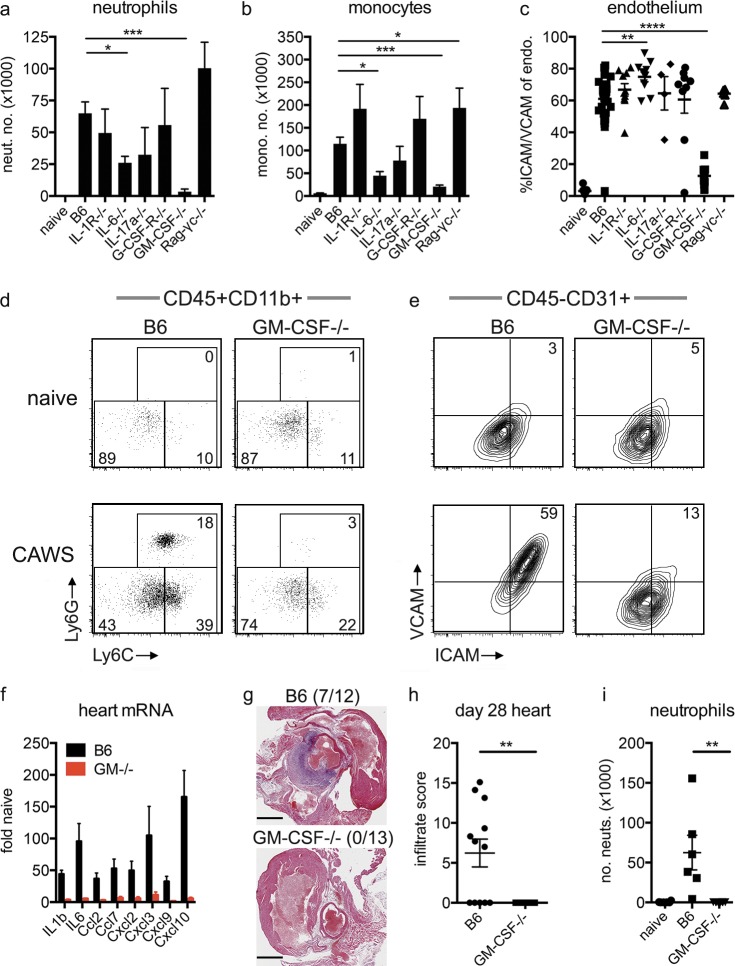
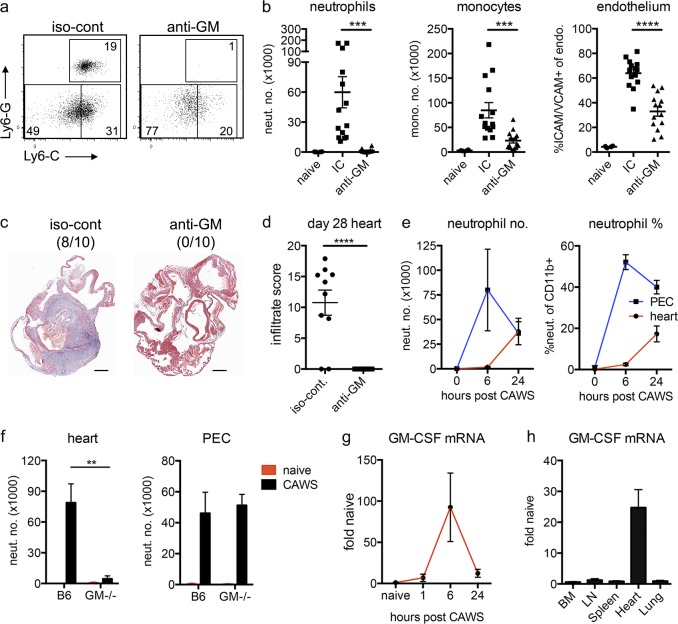
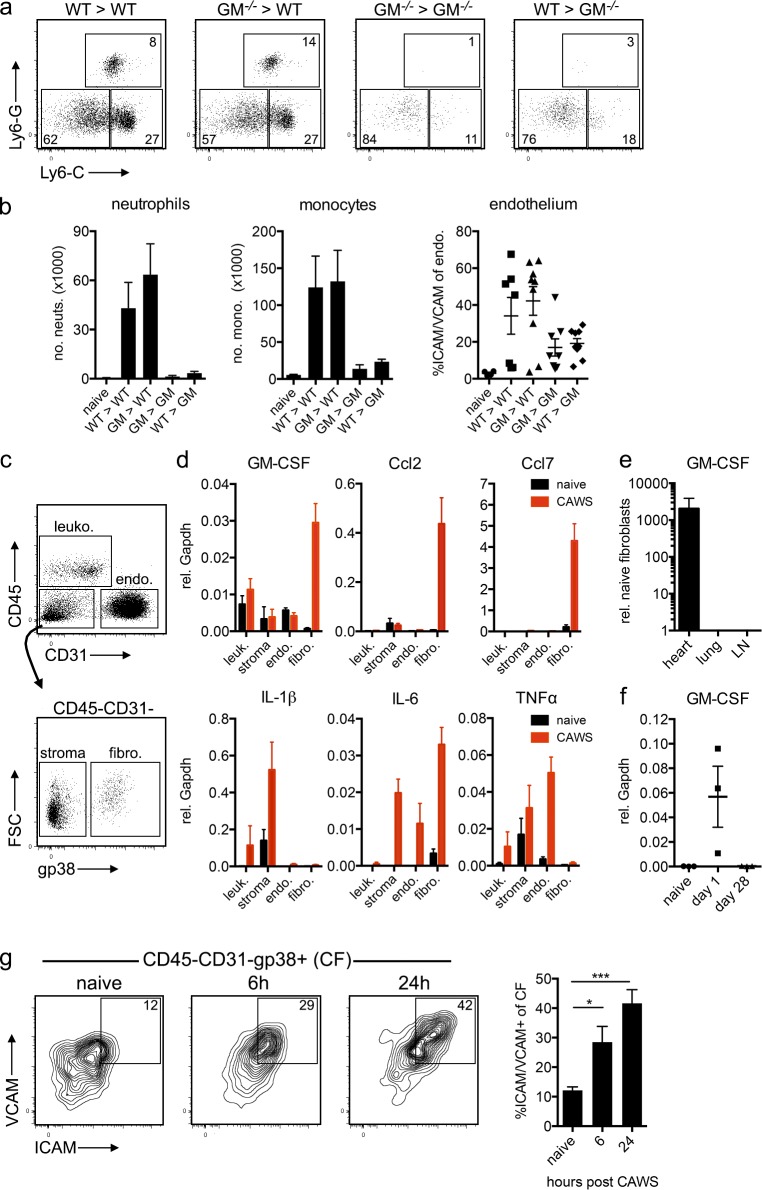
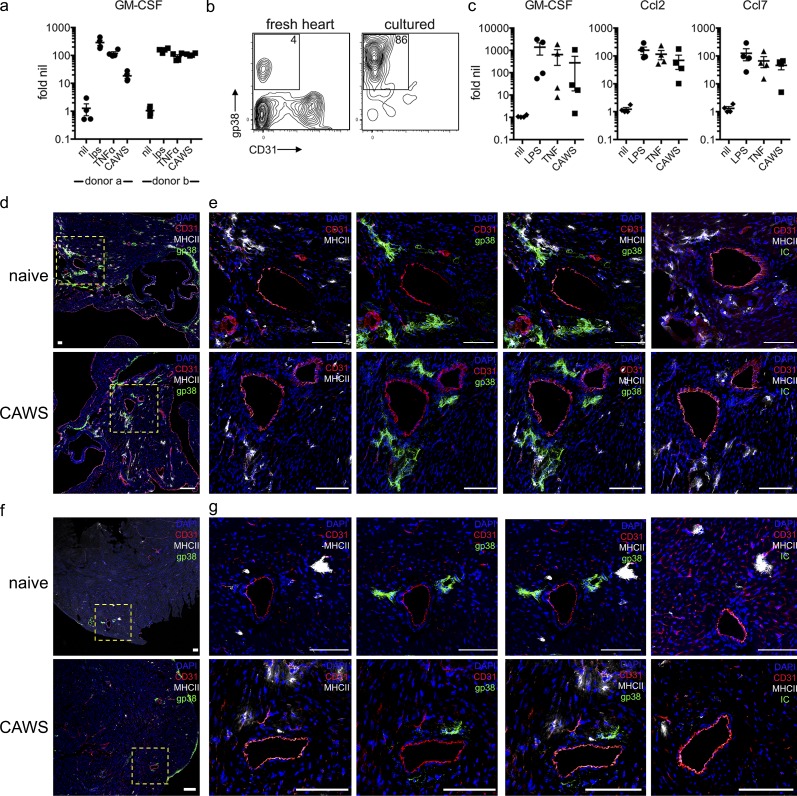
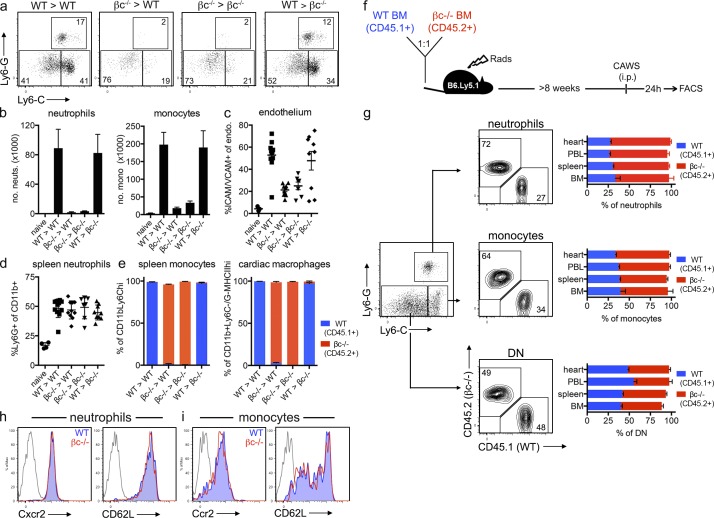
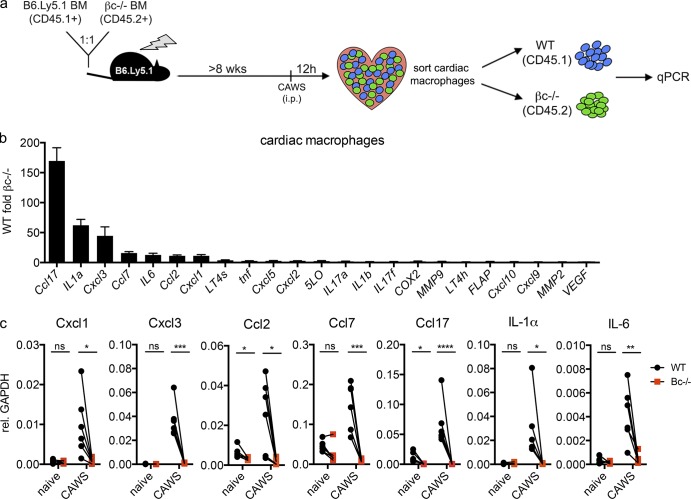
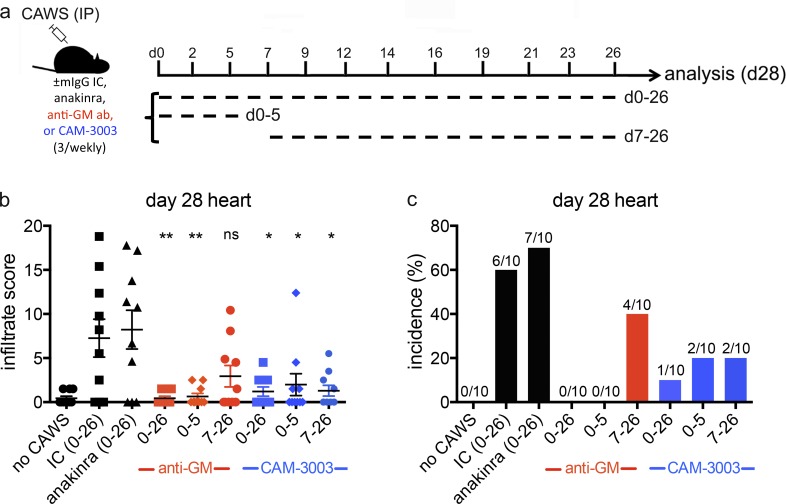
Kawasaki disease (KD) is the leading cause of pediatric heart disease in developed countries. KD patients develop cardiac inflammation, characterized by an early infiltrate of neutrophils and monocytes that precipitates coronary arteritis. Although the early inflammatory processes are linked to cardiac pathology, the factors that regulate cardiac inflammation and immune cell recruitment to the heart remain obscure. In this study, using a mouse model of KD (induced by a cell wall Candida albicans water-soluble fraction [CAWS]), we identify an essential role for granulocyte/macrophage colony-stimulating factor (GM-CSF) in orchestrating these events. GM-CSF is rapidly produced by cardiac fibroblasts after CAWS challenge, precipitating cardiac inflammation. Mechanistically, GM-CSF acts upon the local macrophage compartment, driving the expression of inflammatory cytokines and chemokines, whereas therapeutically, GM-CSF blockade markedly reduces cardiac disease. Our findings describe a novel role for GM-CSF as an essential initiating cytokine in cardiac inflammation and implicate GM-CSF as a potential target for therapeutic intervention in KD.


Figures

Figure 1.
Figure 1.
CAWS induces a biphasic, cardiac-specific inflammation in mice. (a and b) C57BL/6 (B6) mice were injected i.p. with 4 mg CAWS. 28 d later, mice were euthanized, and the hearts were excised for HE staining. Representative image (of hearts from 7 to 88 mice over at least four experiments) cut on a transverse (a) or coronal (b) plane are shown (cropped images show coronary arteries, and arrows indicate infiltrate). Bars, 1 mm. (c and d) B6 mice were injected with CAWS, and at various times, hearts were analyzed by flow cytometry (mice received anti–Gr-1 PE i.v. 10 min before sacrifice to prelabel circulating granulocytes). (c) Representative FACs plots of hearts from naive and day 1 CAWS-challenged mice are shown. (d) A time course for the number of Ly6C/G (double negative [DN]) myeloid (CD45.2+/CD11b+/in vivo GR-1/Ly6C/Ly6G), monocytes (CD45.2+/CD11b+/in vivo Gr-1/Ly6Chi/Ly6G), and neutrophils (CD45.2+/CD11b+/in vivo Gr-1/Ly6C+/Ly6G+) in the heart, lung, and kidney of B6 mice after CAWS challenge is shown (data depict the mean ± SEM of 5–17 mice pooled from at least two experiments). (e and f) Hearts were isolated from naive or CAWS-challenged B6 mice (injected 1 or 28 d earlier) and either stained with anti-Ly6G for IHC (bars, 1 mm; e) or dissected into quadrants, and the frequency of neutrophils in each quadrant were analyzed by flow cytometry (values are mean percent Ly6G+ of CD11b+/CD45.2+ of five to six mice from two experiments; f). (g) The expression of ICAM and VCAM on cardiac endothelium (CD45CD31+) was analyzed by flow cytometry (inset values show the mean of 9–12 mice pooled from at least three experiments). (h) Hearts from B6 mice were harvested 1 or 28–35 d after CAWS challenge and assessed by qPCR (gene expression is relative to naive controls and the mean ± SEM of five mice from two to three experiments is shown). FLAP, 5-lipoxygenase activating protein; M-CSF, macrophage CSF.
Figure 2.
Figure 2.
GM-CSF is essential for the development of cardiac disease in the CAWS model of KD. (a–e) B6 and KO mice were injected with CAWS, and 1 d later, the hearts were analyzed for neutrophil (neut.; a) and monocyte (mono.; b) infiltrate and ICAM/VCAM expression on endothelium (endo.; c) by flow cytometry. FACs plots show Ly6C and Ly6G are gated on heart-resident (in vivo Gr-1) myeloid cells (CD11b+/CD45.2+; d) and ICAM/VCAM expression on endothelium (CD45.2CD31+; e). Data depict the mean ± SEM from 4 to 30 mice pooled from at least two experiments. (f) Inflammatory gene expression from the hearts of B6 and GM-CSF−/− mice was assessed by qPCR 1 d after CAWS challenge (values are relative to naive B6 hearts and show the mean ± SEM of six mice from two experiments). (g and h) B6 and GM-CSF−/− mice were challenged with CAWS, and 28–40 d later, the hearts were analyzed for infiltrate by HE staining and flow cytometry. Representative HE images with inflammatory infiltrate incidence (in parentheses; g) and infiltrate score (h) are shown (pooled from two experiments). Bars, 1 mm. (i) Cardiac neutrophil infiltrate enumerated by flow cytometry (individual mice are shown pooled from two experiments). Statistical analysis was performed with unpaired, two-tailed Student’s t tests. *, P < 0.05; **, P < 0.01; ***, P < 0.001; ****, P < 0.0001.
Figure 3.
Figure 3.
Locally expressed GM-CSF induces cardiac inflammation after CAWS challenge. (a and b) B6 mice were challenged with CAWS and immediately injected with anti–GM-CSF (anti-GM) or isotype control (iso-cont or IC) antibodies. 1 d later, hearts were harvested and analyzed by flow cytometry. Dot plots are gated on heart-resident (in vivo Gr-1) myeloid cells (CD11b+/CD45.2+; a), and graphs depict neutrophil (neut.) and monocyte (mono.) infiltrate and ICAM/VCAM expression on endothelium (endo.; data points depict individual mice pooled from four experiments; b). (c and d) CAWS-challenged B6 mice were injected with anti–GM-CSF or isotype control antibodies at the time of challenge and then three times weekly. 28 d later, hearts were analyzed by HE staining. A representative section with infiltrate incidence (in parentheses; c) and infiltrate score (d) is shown (n = 10 mice pooled from two experiments). Bars, 1 mm. (e) B6 mice were challenged with CAWS, and 6 or 24 h later, neutrophils were enumerated in the heart and peritoneal cavity (PEC) by flow cytometry (data represent four to six mice from two experiments). (f) B6 or GM-CSF−/− mice were challenged with CAWS, and 1 d later, neutrophils were enumerated in the heart and peritoneal cavity by flow cytometry (data represent three to nine mice from three experiments). (g) B6 mice were challenged with CAWS, and GM-CSF mRNA were measured in the heart at various times by qPCR (data represent five to six mice pooled from two experiments). (h) B6 mice were challenged with CAWS, and 7–8 h later, various organs were isolated from naive and CAWS-injected mice and assessed for GM-CSF expression by qPCR (data represent five mice pooled from three experiments). GM-CSF mRNA expression levels are shown relative to naive B6 tissue controls. (e–h) Data depict the mean ± SEM. Statistical analysis was performed with unpaired, two-tailed Student’s t tests. **, P < 0.01; ***, P < 0.001; ****, P < 0.0001.
Figure 4.
Figure 4.
Radio-resistant CFs produce GM-CSF after CAWS challenge. (a and b) Reciprocal B6.Ly5.1 (WT) and GM-CSF−/− (GM−/−) BM chimeras were challenged with CAWS, and 1 d later, the hearts were analyzed for cardiac vasculitis. (a) Dot plots are gated on heart-resident (in vivo Gr-1) myeloid cells (CD11b+). (b) Graphs depict the mean ± SEM number of neutrophils (neuts.) and monocytes (mono.) and ICAM/VCAM expression on cardiac endothelium (endo.; data are pooled from four to nine mice from four experiments). (c and d) Hearts from naive or CAWS-challenged mice (6 h after injection) were sorted into CD45+ leukocytes (leuko.), CD45CD31+ endothelial cells, CD45gp38+ CFs, and CD45CD31gp38 stromal cells (stroma), and the expression of cytokines and chemokines was analyzed by qPCR. (d) Bar graphs show mean ± SEM gene expression relative (rel.) to Gapdh pooled from three experiments. fibro., fibroblasts; FSC, forward side scatter. (e) Fibroblasts (CD45CD31gp38+) were sorted from the heart, lung, and LN of naive and CAWS (∼10 h after challenge) mice, and GM-CSF expression was measured by qPCR. Expression is normalized to naive tissue fibroblasts and shows the mean ± SEM from two experiments (n = 5–6 mice). (f) The expression of GM-CSF by CFs sorted from naive, day 1, or day 28 CAWS-challenged mice was measured by qPCR. Data points show individual experiments (n = 2–3 mice per experiment), with the mean ± SEM indicated. (g) The expression of ICAM and VCAM on CFs was analyzed at various stages after CAWS challenge. FACS plots are gated on CFs (CD45CD31gp38+), and graphs depict the mean ± SEM of four to six mice pooled from two experiments. Statistical analysis was performed with unpaired, two-tailed Student’s t tests. *, P < 0.05; ***, P < 0.001.
Figure 5.
Figure 5.
Identifying activating stimuli and location of CFs. (a) Primary human CFs were stimulated with LPS, TNF, or CAWS, and 4 h later, GM-CSF expression was measured by qPCR. Results show fold-induction relative to nil stimulation from two donors conducted over four experiments. (b) FACS analysis of B6 mouse hearts before and after in vitro culture. A representative contour plot of gp38 and CD31 expression is shown (inset value shows the mean from three individual CF lines). (c) Primary mouse CFs were stimulated with LPS, TNFα, or CAWS for 4 h, and GM-CSF, Ccl2, and Ccl7 expression were measured by qPCR (values show gene expression relative to nil stimulation). The four data points represent individual experiments with different CF lines. (d–g) Hearts from naive and CAWS-injected (∼20 h after challenge) RAG-1−/− mice were divided into upper (d and e) and lower (f and g) halves, stained for gp-38 (green), CD31 (red), and MHC-II (gray), and analyzed by confocal microscopy (isotype control [IC; green] of gp-38 antibody is shown). Yellow, dashed-lined boxes show image insets. Representative images of five to six mice from three experiments are shown. Bars, 100 µm.
Figure 6.
Figure 6.
GM-CSF signaling on the hematopoietic compartment drives cardiac inflammation. (a–e) Reciprocal BM chimeras were generated with WT (B6.Ly5.1; CD45.1+) and βc−/− (CD45.2+) mice. BM chimeras were challenged with CAWS and 1 d later analyzed for the development of cardiac vasculitis. (a) Dot plots are gated on heart-resident (in vivo Gr-1) myeloid cells (CD11b+). (b–e) Graphs depict the mean ± SEM number of neutrophils (neuts.) and monocytes (mono.) in the heart (b), ICAM/VCAM expression of cardiac endothelium (endo.; c), the frequency of neutrophils in the spleen (d), and the level of chimerism for splenic monocytes (CD11b+Ly6GLy6Chi) and cardiac macrophages (CD11b+Ly6CLy6GMHCIIhi; e). Values are pooled from three to nine mice pooled from four experiments. (f and g) 50:50 mixed B6.Ly5.1 (CD45.1+) + βc−/− (CD45.2+) BM chimeras were challenged with CAWS, and 1 d later, WT and βc−/− neutrophils, monocytes, and double-negative (DN; Ly6C/G) macrophages were enumerated by flow cytometry. A representative dot plot of Ly6C and Ly6G expression is gated on resident (in vivo Gr-1) myeloid (CD11b+) cells from the heart, with contour plots depicting the composition (B6.Ly5.1 vs. βc−/−) of each population. Bar graphs show the frequency of each population across various organs (data represent the mean ± SEM of nine mice pooled from four experiments). (h and i) Homing receptor expression of WT (CD45.1+) and βc−/− (CD45.2+) neutrophils and monocytes isolated from the spleen of mixed B6.Ly5.1 + βc−/− BM chimeras 1 d after CAWS challenge. A representative histogram of six mice from two experiments is shown. WT, filled blue; βc−/−, red line; and isotype control, gray line.
Figure 7.
Figure 7.
GM-CSF activates cardiac macrophages to express proinflammatory genes during cardiac vasculitis. (a) 50:50 mixed B6.Ly5.1 (CD45.1+) + βc−/− (CD45.2+) BM chimeras were challenged with CAWS, and 12 h later, macrophages (CD11b+Ly6GMHC II+) were sorted from the heart into WT (CD45.1+) and βc−/− (CD45.2+) fractions and analyzed by qPCR. (b) The bar graph shows gene expression by WT relative to βc−/− macrophages (data represent mean ± SEM from five experiments). FLAP, 5-lipoxygenase activating protein; VEGF, vascular endothelial growth factor. (c) Graphs show the expression of target genes by WT and βc−/− cardiac macrophages sorted from naive or CAWS-challenged mixed B6.Ly5.1 (CD45.1+) + βc−/− (CD45.2+) BM chimeras (values indicate gene expression relative [rel.] to Gapdh and show paired samples pooled from five experiments). Statistical analysis was performed with unpaired, two-tailed Student’s t tests. *, P < 0.05; **, P < 0.01; ***, P < 0.001; ****, P < 0.0001.
Figure 8.
Figure 8.
Kinetic analysis of GM-CSF antagonism in CAWS-induced vasculitis. (a) CAWS-challenged B6 mice received one of anakinra, anti–GM-CSF, anti–GM-CSF receptor (CAM-3003), or isotype control mAbs (mIgG IC; 0.25 mg, three time weekly) beginning at the time of challenge until day 26 (0–26), the time of challenge until day 5 (0–5), or starting at day 7 until day 26 (7–26). At day 28 after CAWS challenge, mice were sacrificed and assessed for cardiac inflammation by HE staining. (b and c) Bar graphs show cardiac disease severity (infiltrate score) and incidence. Data are pooled from two experiments with 10 mice per group. Statistical analysis was performed with unpaired, two-tailed Student’s t tests. *, P < 0.05; **, P < 0.01.

Similar articles

Cited by

References

    1. Beiser A.S., Takahashi M., Baker A.L., Sundel R.P., and Newburger J.W.. US Multicenter Kawasaki Disease Study Group . 1998. A predictive instrument for coronary artery aneurysms in Kawasaki disease. Am. J. Cardiol. 81:1116–1120. 10.1016/S0002-9149(98)00116-7 - DOI - PubMed
    1. Biezeveld M.H., van Mierlo G., Lutter R., Kuipers I.M., Dekker T., Hack C.E., Newburger J.W., and Kuijpers T.W.. 2005. Sustained activation of neutrophils in the course of Kawasaki disease: an association with matrix metalloproteinases. Clin. Exp. Immunol. 141:183–188. 10.1111/j.1365-2249.2005.02829.x - DOI - PMC - PubMed
    1. Brown T.J., Crawford S.E., Cornwall M.L., Garcia F., Shulman S.T., and Rowley A.H.. 2001. CD8 T lymphocytes and macrophages infiltrate coronary artery aneurysms in acute Kawasaki disease. J. Infect. Dis. 184:940–943. 10.1086/323155 - DOI - PubMed
    1. Burns J.C., Capparelli E.V., Brown J.A., Newburger J.W., and Glode M.P.. US/Canadian Kawasaki Syndrome Study Group . 1998. Intravenous gamma-globulin treatment and retreatment in Kawasaki disease. Pediatr. Infect. Dis. J. 17:1144–1148. 10.1097/00006454-199812000-00009 - DOI - PubMed
    1. Campbell I.K., van Nieuwenhuijze A., Segura E., O’Donnell K., Coghill E., Hommel M., Gerondakis S., Villadangos J.A., and Wicks I.P.. 2011. Differentiation of inflammatory dendritic cells is mediated by NF-κB1–dependent GM-CSF production in CD4 T cells. J. Immunol. 186:5468–5477. 10.4049/jimmunol.1002923 - DOI - PubMed

MeSH terms

Substances