

Identification of a novel mechanism of blood-brain communication during peripheral inflammation via choroid plexus-derived extracellular vesicles
- PMID: 27596437
- PMCID: PMC5048366
- DOI: 10.15252/emmm.201606271
Identification of a novel mechanism of blood-brain communication during peripheral inflammation via choroid plexus-derived extracellular vesicles
Abstract
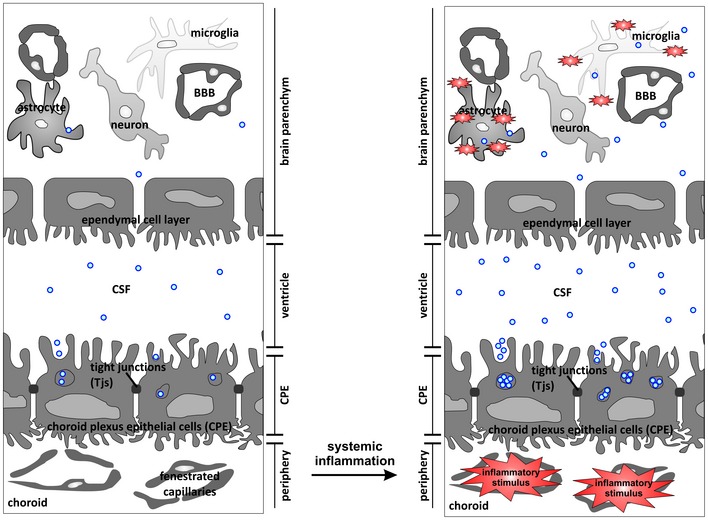
Here, we identified release of extracellular vesicles (EVs) by the choroid plexus epithelium (CPE) as a new mechanism of blood-brain communication. Systemic inflammation induced an increase in EVs and associated pro-inflammatory miRNAs, including miR-146a and miR-155, in the CSF Interestingly, this was associated with an increase in amount of multivesicular bodies (MVBs) and exosomes per MVB in the CPE cells. Additionally, we could mimic this using LPS-stimulated primary CPE cells and choroid plexus explants. These choroid plexus-derived EVs can enter the brain parenchyma and are taken up by astrocytes and microglia, inducing miRNA target repression and inflammatory gene up-regulation. Interestingly, this could be blocked in vivo by intracerebroventricular (icv) injection of an inhibitor of exosome production. Our data show that CPE cells sense and transmit information about the peripheral inflammatory status to the central nervous system (CNS) via the release of EVs into the CSF, which transfer this pro-inflammatory message to recipient brain cells. Additionally, we revealed that blockage of EV secretion decreases brain inflammation, which opens up new avenues to treat systemic inflammatory diseases such as sepsis.
Keywords: blood–brain barrier; choroid plexus; exosomes; extracellular vesicles; sepsis.
© 2016 The Authors. Published under the terms of the CC BY 4.0 license.
Figures
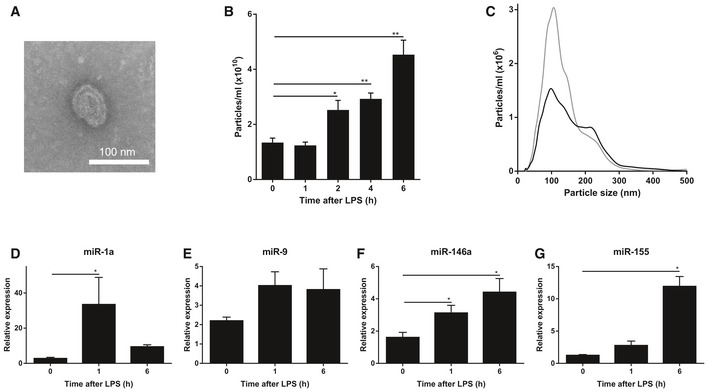
- A
Representative transmission electron microscope (TEM) image showing the presence of EVs in the CSF in two independent experiments.
- B
NanoSight quantification of the amount of particles in the CSF 0, 1, 2, 4, and 6 h after i.p. LPS injection (n = 3–5).
- C
Size distribution of the EVs in vivo in the CSF before (black; n = 5) and 6 h after (gray; n = 3) LPS treatment determined by NanoSight analysis.
- D–G
Quantitative real‐time polymerase chain reaction analysis of miR‐1a (D), miR‐9 (E), miR‐146a (F), and miR‐155 (G) (n = 4). RNA was isolated from pooled CSF (50 μl) from different mice (n = 3).
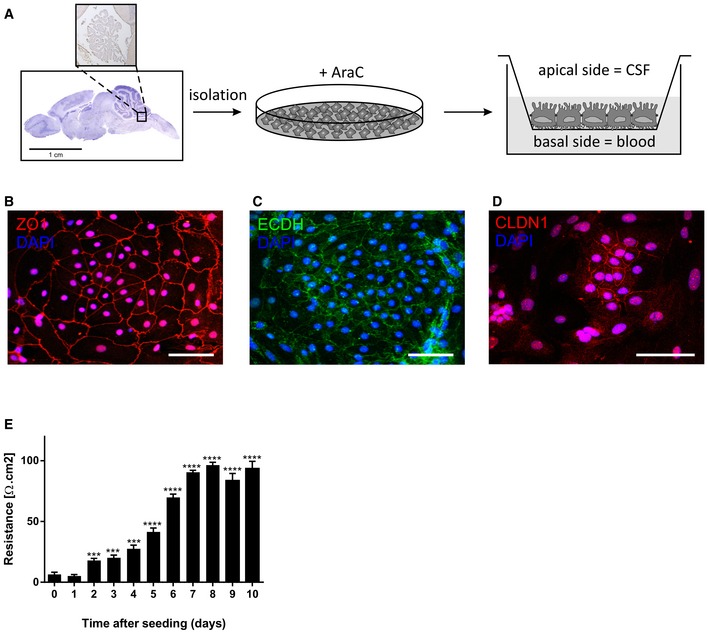
- A
Schematic representation of the procedures of primary CPE cell isolation and culture in the transwell system.
- B, D
Representative confocal images showing the expression of zona occludens (ZO1, red, B), E‐cadherin (ECDH, green, C), and claudin‐1 (CLDN1, red, D) in the primary CPE culture. Scale bars, 30 μm.
- E
TEER values of the primary CPE cells grown in the transwell system. Significance was calculated compared with day 0 (n = 6). Data are presented as means ± SEM. Data were analyzed by Student's t‐test. Significance levels are indicated on the graphs: ***0.0001 ≤ P < 0.001; ****P < 0.0001.
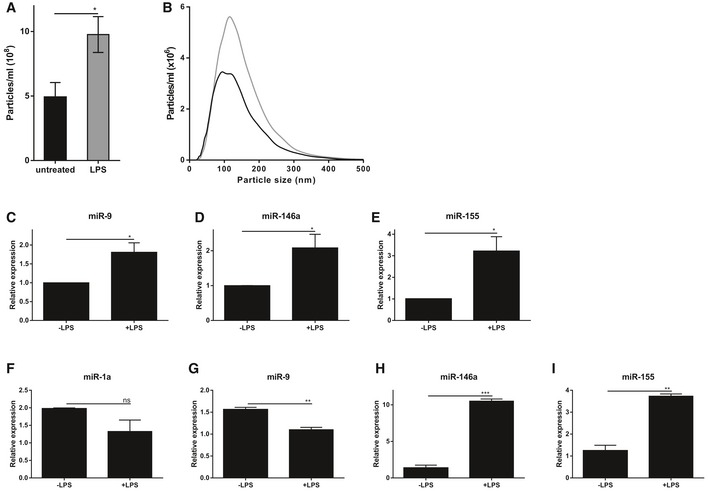
- A, B
In vitro quantification (A) and size distribution (B) of EVs isolated from conditioned medium of primary CPE cells grown in a transwell system after 12 h in the absence (black) or presence (gray) of LPS (n = 5) determined by NanoSight analysis.
- C–E
TaqMan qPCR assay for the quantification of miR‐9 (C), miR‐146a (D), and miR‐155 (E) in the exosomal pellet isolated from conditioned medium of primary CPE cells grown in a transwell system and stimulated for 12 h with LPS (n = 3).
- F–I
Quantification of the miRNAs miR‐1a (F), miR‐9 (G), miR‐146a (H), and miR‐155 (I) by TaqMan qPCR assay from primary CPE cells grown in a transwell system without or with LPS stimulation (n = 3).
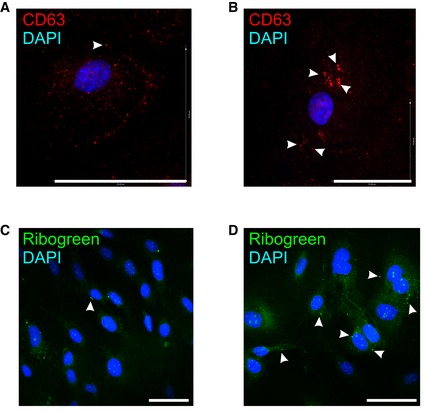
- A–D
Representative CD63 (red, A, B) and RiboGreen (green, C, D) staining of primary CPE cells after 12 h in the absence (A, C) or presence (B, D) of LPS in vitro from two independent experiments with n = 3. The white arrows indicate CD63 (A, B) or RiboGreen (C, D) positive vesicles. Scale bars, 70 μm.
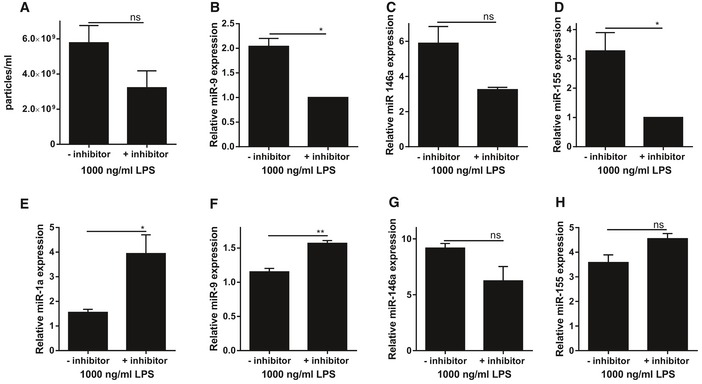
- A
In vitro quantification of EVs isolated from conditioned medium of LPS‐stimulated primary CPE cells grown in a transwell system in the absence or presence of the exosome inhibitor GW4869 (n = 3).
- B–D
TaqMan assay quantification of the miRNAs miR‐9 (B), miR‐146a (C), and miR‐155 (D) in supernatant of LPS‐stimulated primary CPE cells grown in a transwell system and either left untreated or pretreated with GW4869 to inhibit exosome secretion (n = 3). miR‐1a levels were below detection limit.
- E–H
TaqMan assay quantification of the miRNAs miR‐1a (E), miR‐9 (F), miR‐146a (G), and miR‐155 (H) in cell lysates of LPS‐stimulated primary CPE cells grown in a transwell system left untreated or treated with GW4869 to inhibit exosome secretion (n = 3).
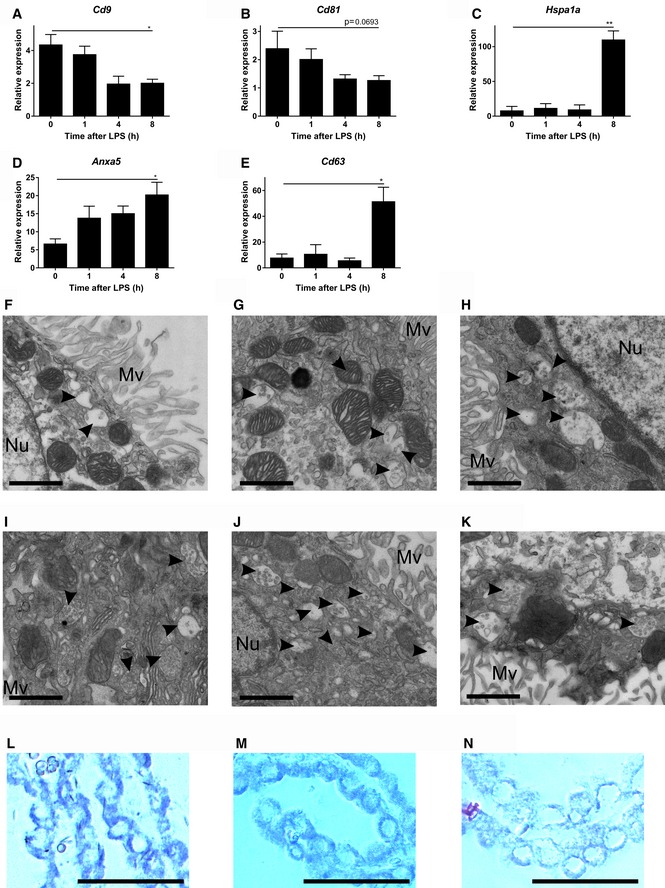
- A–E
QPCR gene expression analysis of exosomal markers Cd9 (A), Cd81 (B), Hspa1a (C), Cd63 (D), and Anxa5 (E) in the choroid plexus before and after LPS treatment (n = 4). Data are displayed as mean ± SEM and analyzed by Student's t‐test. Significance levels are indicated on the graphs: *0.01 ≤ P < 0.05; **0.001 ≤ P < 0.01.
- F–K
Representative TEM images from choroid plexus tissue isolated 0 (F), 1 (G), 2 (H), 3 (I), 4 (J), or 6 (K) h after LPS injection. Black arrow heads point to exosomes present in MVBs. Scale bars, 9 μm. Mv, microvilli; Nu, nucleus.
- L–N
In situ hybridization (ISH) analysis of miR expression in CPE cells in vivo. LNA™‐ISH of miR‐146a (L), miR‐9 (M), and miR‐155 (N) on brain sections. Scale bars, 30 μm.
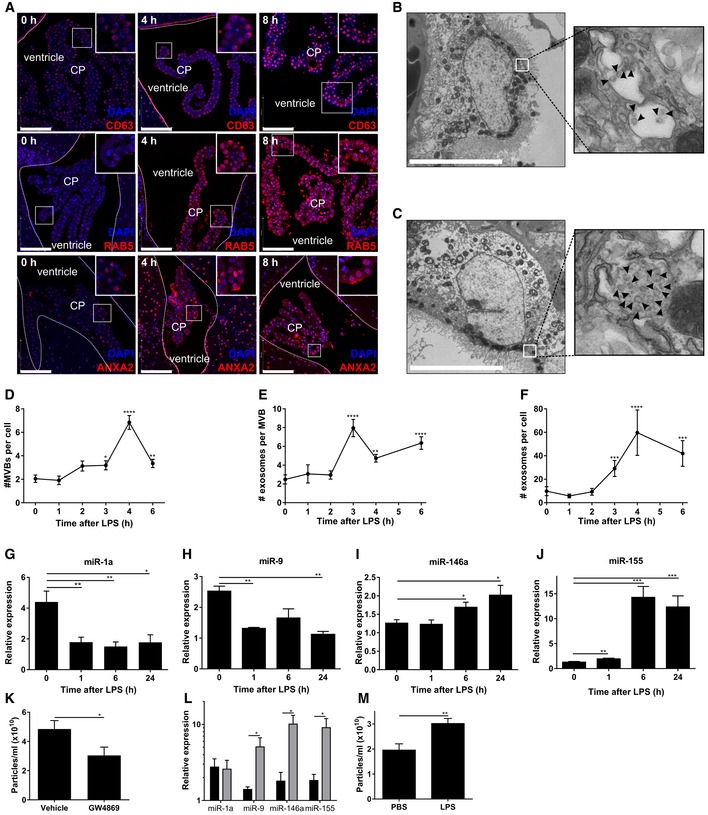
- A
Representative confocal images of CD63, RAB5, and ANXA2 (red) in the choroid plexus (CP) at 0, 4, and 8 h after LPS treatment. Hoechst (blue) was used to stain the nucleus. The dotted line indicates the ependymal cells that line the ventricle and the square boxes indicate the zoomed insert images displayed at the right corner of each image. Scale bars, 100 μm.
- B, C
Representative TEM images showing the presence of MVBs in the CPE cells before (B) and 6 h after (C) LPS administration in vivo. Black arrow heads point to exosomes present in MVBs. Scale bars, 9 μm.
- D–F
Quantification of number of MVBs per cell section (D), number of exosomes per MVB (E), and number of exosomes per cell section (F), based on TEM analysis of several adjacent cells (0 h, n = 20; 3 h, n = 21; 4 h, n = 13; 6 h, n = 23).
- G–J
Quantitative real‐time polymerase chain reaction (qPCR) analysis of miR‐1a (G), miR‐9 (H), miR‐146a (I), and miR‐155 (J). Data are presented as relative expression normalized with housekeeping miRs by TaqMan qPCR assay (0 h, n = 4; 1 h, n = 5; 6 h, n = 5; 24 h, n = 3).
- K
NanoSight analysis of CSF isolated from LPS‐injected mice followed by icv injection of vehicle or GW4869, a neutral sphingomyelinase inhibitor that inhibits exosome secretion (n = 8).
- L
qPCR analysis of the expression of miR‐1a, miR‐9, miR‐146a, and miR‐155 in the choroid plexus of mice injected with LPS and then icv injected with vehicle (black) or GW4869 (gray) (n = 4).
- M
NanoSight analysis of the supernatant of choroid plexus explants from PBS‐ or LPS‐injected mice (n = 6).
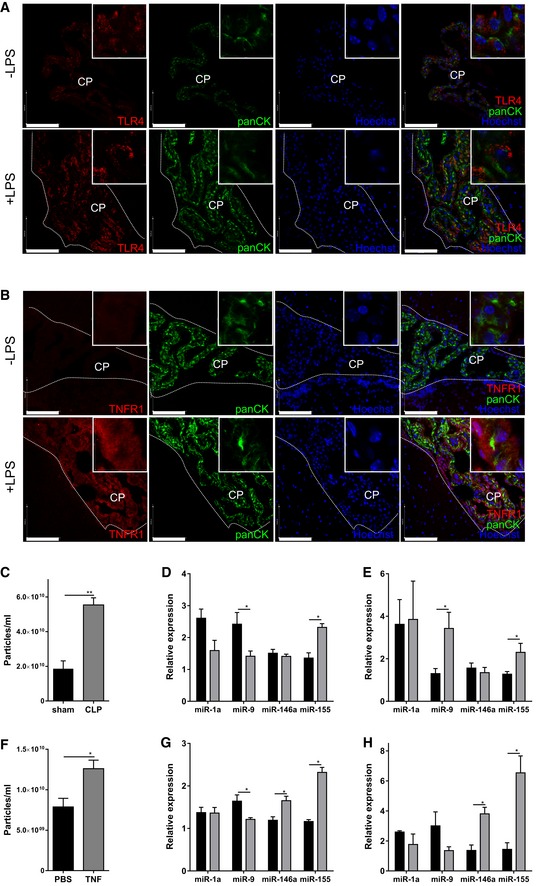
- A, B
Representative confocal images of choroid plexus (CP) on brain sections from naive mice and 4 h after LPS injection (n = 3). Brain sections were stained for TLR4 (A) and TNFR1 (B) (red), pan‐cytokeratin (panCK, green), and the nuclei were stained with Hoechst (blue). The ependymal cells lining the ventricles are marked with a dotted line. Scale bars, 100 μm.
- C
NanoSight analysis of EVs in the CSF in sham‐operated (black; n = 3) relative to CLP‐treated (gray; n = 4) mice 10 h after surgery (n = 4).
- D
qPCR analysis of the expression of miR‐1a, miR‐9, miR‐146a, and miR‐155 in the choroid plexus of sham‐operated mice (black) and mice subjected to CLP (gray) 10 h after surgery (n = 5–7).
- E
qPCR analysis of the expression of miR‐1a, miR‐9, miR‐146a, and miR‐155 in the CSF of sham‐operated mice (black) and mice subjected to CLP (gray) 10 h after surgery (n = 4–5).
- F
NanoSight analysis of EVs in CSF of control (black; n = 5) and TNF‐injected (25 μg/20 g; gray; n = 4) mice 6 h after TNF challenge.
- G
qPCR analysis of the expression of miR‐1a, miR‐9, miR‐146a, and miR‐155 in the choroid plexus of control mice (black) and in mice injected with TNF (gray) 6 h after injection (n = 5–7).
- H
qPCR analysis of the expression of miR‐1a, miR‐9, miR‐146a and miR‐155 in the CSF of control mice (black) and on mice 6 h after TNF injection (gray) (n = 3).
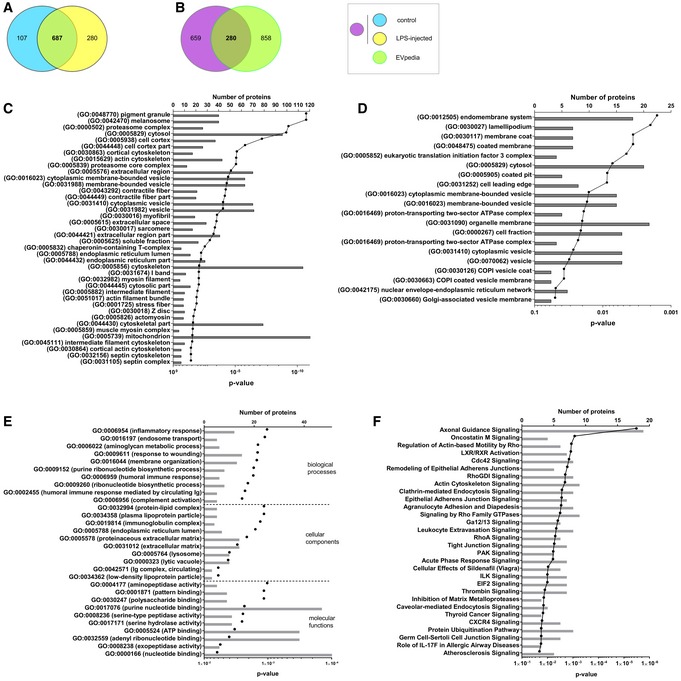
- A
Venn diagrams showing overlap of proteins identified in EVs isolated from CSF of control (blue) and LPS‐injected (yellow) mice that were present in the two independent replicates.
- B
Venn diagrams showing overlap of the CSF EV proteome (control and LPS; purple) with the Mus musculus proteome list available on the EVpedia website (green).
- C
GO enrichment analysis using DAVID of the EV proteome compared with total choroid plexus proteome.
- D
GO enrichment analysis using DAVID of the EV proteome following LPS treatment compared with total choroid plexus proteome. The gray bars represent the number of proteins and the black dots the P‐values.
- E, F
DAVID (E) and Ingenuity pathway analysis (IPA) (F) on the CSF‐derived EV proteome, taking into account all proteins that are exclusively detected after LPS stimulation in both replicates.
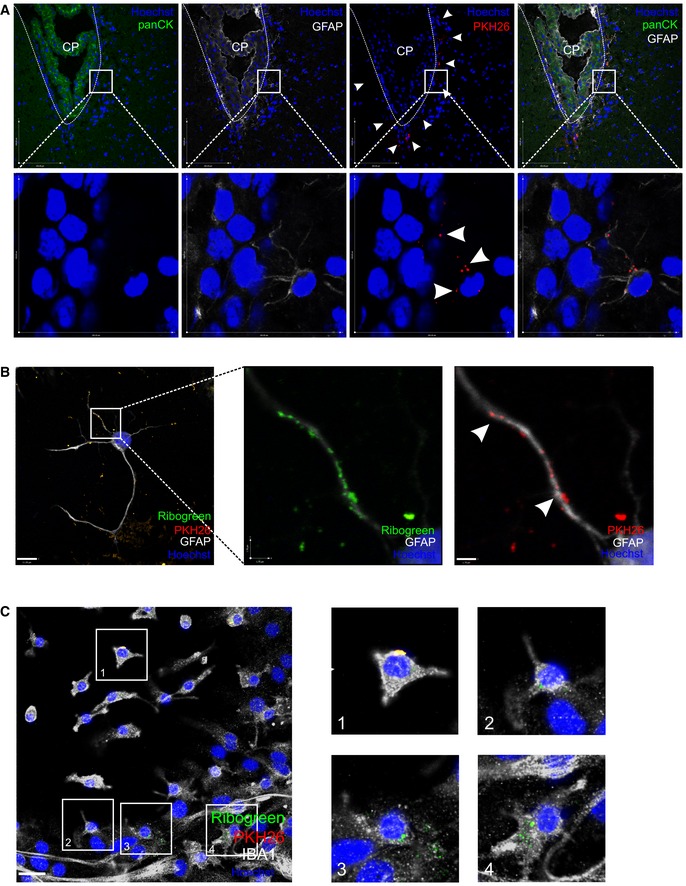
- A
Representative confocal image of brain parenchyma 4 h after intracerebroventricular injection of PKH26‐labeled EVs (red). Astrocytes are stained with GFAP (white), nuclei with Hoechst (blue), and pan‐cytokeratin (panCK, green) was used to label the choroid plexus. The dotted line shows the ventricular border and the white arrow heads point to EVs that crossed the ependymal cell layer.
- B, C
Representative confocal images showing the uptake of double‐labeled EVs (RiboGreen; green, PKH26, red) by astrocytes stained with GFAP (white, B) and microglia cells stained with IBA1 (white, C) incubated on mixed cortical cultures. Boxed areas are shown as zoomed images on the right and the white arrow heads point to EVs. Cell nuclei are stained with Hoechst (blue). Scale bar (B, left) = 11 μm; (B, right) = 1.7 μm and (C) = 24 μm.
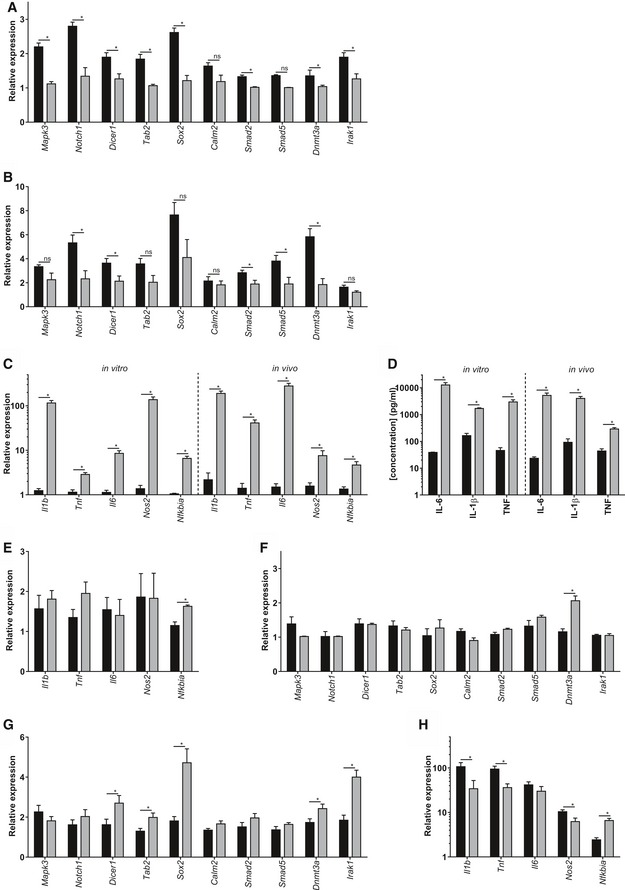
- A, B
qPCR gene expression analysis of miRNA target genes Mapk3, Notch1, Dicer1, Tab2, Sox2, Calm2, Smad2, Smad5, Dnmt3a, and Irak1 in mixed cortical cultures incubated with EVs isolated from CSF from untreated (black) or LPS‐treated (gray) mice (A) and in brain tissue (B) before (black) and 8 h after LPS injection (gray) (n = 3).
- C
qPCR gene expression analysis of inflammatory genes Il1b, Tnf, Il6, Nos2, and Nfkbia by qPCR in mixed cortical cultures (left, in vitro) incubated with EVs isolated from CSF from untreated (black) or LPS‐treated (gray) mice and in brain tissue (right, in vivo) before (black) and 8 h after LPS injection (gray) (n = 3).
- D
Cytokine analysis (IL‐6, IL‐1β, and TNF) of supernatant of mixed cortical cultures (left, in vitro) incubated with EVs isolated from untreated (black, n = 3) or LPS‐treated (gray; n = 3) mice and of CSF (right, in vivo) from untreated (black; n = 3) and LPS‐treated mice (gray; n = 6).
- E, F
qPCR gene expression analysis of inflammatory genes Il1b, Tnf, Il6, Nos2, and Nfkbia (E) and miRNA target genes Mapk3, Notch1, Dicer1, Tab2, Sox2, Calm2, Smad2, Smad5, Dnmt3a, and Irak1 (F) in mixed cortical cultures incubated with CD63‐depleted EVs isolated from untreated mice (black) and mice treated with LPS for 6 h (gray) (n = 3).
- G, H
qPCR gene expression analysis of miRNA target genes Mapk3, Notch1, Dicer1, Tab2, Sox2, Calm2, Smad2, Smad5, Dnmt3a, and Irak1 (G) and inflammatory genes Il1b, Tnf, Il6, Nos2, and Nfkbia (H) in brain tissue from LPS‐injected mice icv injected with vehicle (black) or GW4869 (gray) (n = 7).
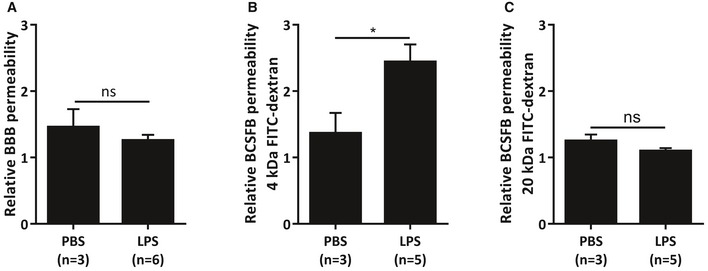
- A–C
Relative BBB (A) and BCSFB (B, C) leakage upon LPS injection. Mice were injected with PBS or LPS, followed 3 h later by i.v. injection of 4 kDa (A, B) or 20 kDa (C) FITC‐dextran. One hour later, CSF was isolated and fluorescence was measured using a fluorometer to determine the relative BCSFB leakage (λex/λem = 488 nm/520 nm). Additionally, brains were isolated and incubated in formamide overnight at 37°C. The next day, the supernatant was isolated and fluorescence was measured using a fluorometer (λex/λem = 488 nm/520 nm) to determine the relative BBB leakage. Data are displayed as mean ± SEM and analyzed by Student's t‐test. Significance levels are indicated on the graphs: *0.01 ≤ P < 0.05.
References
-
- Abbott NJ, Patabendige AA, Dolman DE, Yusof SR, Begley DJ (2010) Structure and function of the blood‐brain barrier. Neurobiol Dis 37: 13–25 - PubMed
-
- Abusamra AJ, Zhong Z, Zheng X, Li M, Ichim TE, Chin JL, Min WP (2005) Tumor exosomes expressing Fas ligand mediate CD8+ T‐cell apoptosis. Blood Cells Mol Dis 35: 169–173 - PubMed
-
- Aldred AR, Brack CM, Schreiber G (1995) The cerebral expression of plasma protein genes in different species. Comp Biochem Physiol B: Biochem Mol Biol 111: 1–15 - PubMed
Publication types
MeSH terms
Substances
LinkOut - more resources
Full Text Sources
Other Literature Sources
Medical
Molecular Biology Databases
Research Materials
Miscellaneous
