. 2016 Sep 6:7:12724.
doi: 10.1038/ncomms12724.

Multiple novel gene-by-environment interactions modify the effect of FTO variants on body mass index

Affiliations

Multiple novel gene-by-environment interactions modify the effect of FTO variants on body mass index

Alexander I Young et al. Nat Commun. .

Abstract

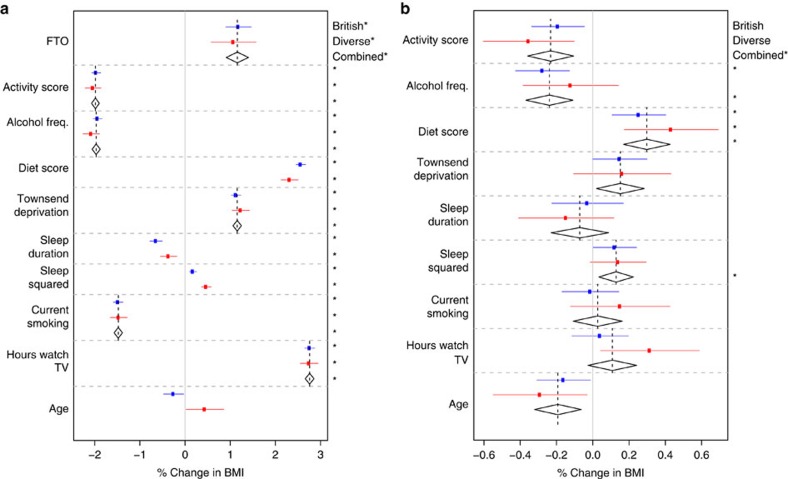
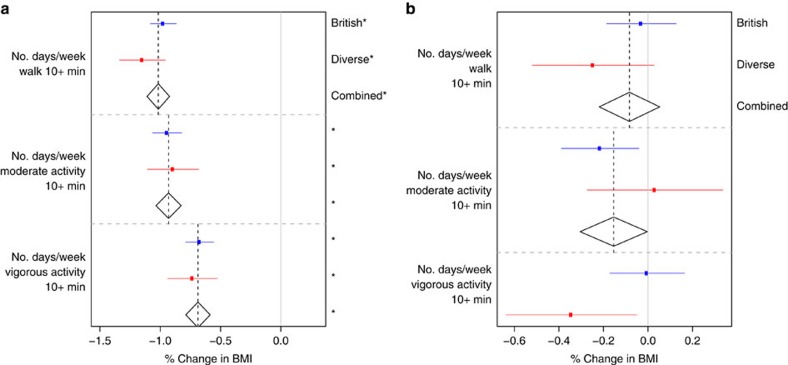
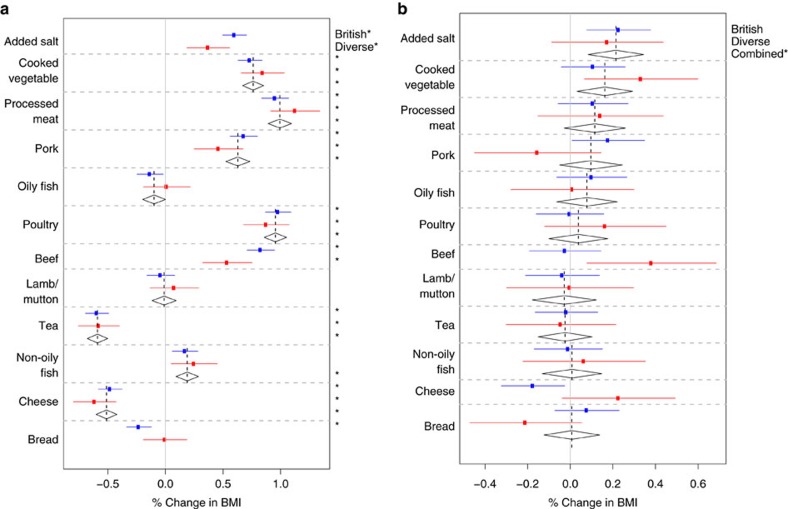
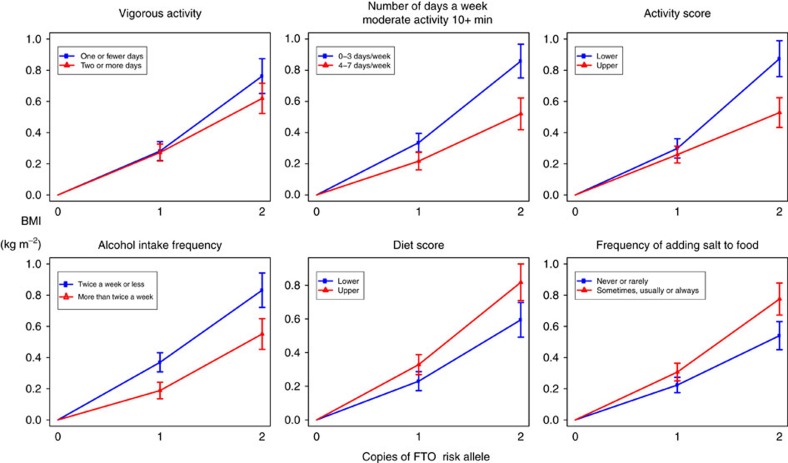
Genetic studies have shown that obesity risk is heritable and that, of the many common variants now associated with body mass index, those in an intron of the fat mass and obesity-associated (FTO) gene have the largest effect. The size of the UK Biobank, and its joint measurement of genetic, anthropometric and lifestyle variables, offers an unprecedented opportunity to assess gene-by-environment interactions in a way that accounts for the dependence between different factors. We jointly examine the evidence for interactions between FTO (rs1421085) and various lifestyle and environmental factors. We report interactions between the FTO variant and each of: frequency of alcohol consumption (P=3.0 × 10(-4)); deviations from mean sleep duration (P=8.0 × 10(-4)); overall diet (P=5.0 × 10(-6)), including added salt (P=1.2 × 10(-3)); and physical activity (P=3.1 × 10(-4)).


Conflict of interest statement

P.D. is a founder and director of Genomics PLC, and a partner of Peptide Groove LLP. The remaining authors declare no competing financial interests.

Figures

Figure 1
Figure 1. Main effects and interactions with FTO.
The estimated (a) main effects on BMI (% change in BMI per risk allele for FTO, per decade for age and per s.d. for other variables) and (b) interaction effects with FTO on BMI (% change in BMI per FTO risk allele per decade for age and % change in BMI per FTO risk allele per s.d. for other variables). All main and interaction effects were fitted jointly in the ‘Scores' Model (Table 2) in both the British (n∼90,000) and Diverse (n∼30,000) Samples. The estimated effects are shown along with their 95% confidence intervals in both the British (blue) and Diverse (red) Samples along with the combined estimate from a fixed effects meta-analysis when no significant heterogeneity between samples was observed (diamonds). ‘Sleep Squared' refers to squared deviations from mean sleep duration. A star on the right indicates a P value below the Bonferroni-corrected significance threshold of 0.05/25=0.002.
Figure 2
Figure 2. Main effects and interactions with FTO of activity variables.
For the components of the activity score, the estimated (a) main effects on BMI (% change in BMI per s.d.) and (b) interaction effects with FTO on BMI (% change in BMI per FTO risk allele per s.d.). All main and interaction effects were fitted jointly in the ‘Activity' Model (Table 2) in both the British (n∼90,000) and Diverse (n∼30,000) Samples. The estimated effects are shown along with their 95% confidence intervals in both the British (blue) and Diverse (red) Samples along with the combined estimate from a fixed effects meta-analysis when no significant heterogeneity between samples was observed (diamonds). A star on the right indicates a P value below the Bonferroni-corrected significance threshold of 0.05/25=0.002.
Figure 3
Figure 3. Main effects and interactions with FTO of dietary variables.
For the components of the diet score, the estimated (a) main effects on BMI (% change in BMI per s.d.) and (b) interaction effects with FTO on BMI (% change in BMI per FTO risk allele per s.d.). All main and interaction effects were fitted jointly in the ‘Diet' Model (Table 2) in both the British (n∼90,000) and Diverse (n∼30,000) Samples. The estimated effects are shown along with their 95% confidence intervals in both the British (blue) and Diverse (red) Samples along with the combined estimate from a fixed effects meta-analysis when no significant heterogeneity between samples was observed (diamonds). A star on the right indicates a P value below the Bonferroni-corrected significance threshold of 0.05/25=0.002.
Figure 4
Figure 4. Modification of FTO effect by lifestyle.
The effect of the FTO risk allele for different levels of different lifestyle variables in the British subsample. We split each lifestyle variable into two roughly equally sized categories. For each category, we plot the mean BMI and its 95% confidence interval for one and two copies of the FTO risk allele relative to zero copies. If there is no interaction between FTO and the environmental variable, the effect of adding another copy of FTO should be the same whatever the value of the environmental variables, and the lines for different categories should have the same gradient. If there is an interaction, they should diverge.

References

    1. Malik V. S., Willett W. C. & Hu F. B. Global obesity: trends, risk factors and policy implications. Nat. Rev. Endocrinol. 9, 13–27 (2013). - PubMed
    1. Ntuk U. E., Gill J. M. R., Mackay D. F., Sattar N. & Pell J. P. Ethnic-specific obesity cutoffs for diabetes risk: cross-sectional study of 490,288 UK Biobank participants. Diabetes Care 37, 1–8 (2014). - PubMed
    1. Ogden C. L., Yanovski S. Z., Carroll M. D. & Flegal K. M. The Epidemiology of Obesity. Gastroenterology 132, 2087–2102 (2007). - PubMed
    1. Elks C. E. et al. Variability in the heritability of body mass index: A systematic review and meta-regression. Front. Endocrinol. (Lausanne) 3, 1–16 (2012). - PMC - PubMed
    1. Loos R. J. F. & Yeo G. S. H. The bigger picture of FTO--the first GWAS-identified obesity gene. Nat. Rev. Endocrinol. 10, 51–61 (2014). - PMC - PubMed

Publication types

Substances