. 2017 Jul;37(7):2383-2395.
doi: 10.1177/0271678X16666551. Epub 2016 Jan 1.

Colony stimulating factor 1 receptor inhibition eliminates microglia and attenuates brain injury after intracerebral hemorrhage

Affiliations

Colony stimulating factor 1 receptor inhibition eliminates microglia and attenuates brain injury after intracerebral hemorrhage

Minshu Li et al. J Cereb Blood Flow Metab. 2017 Jul.

Abstract

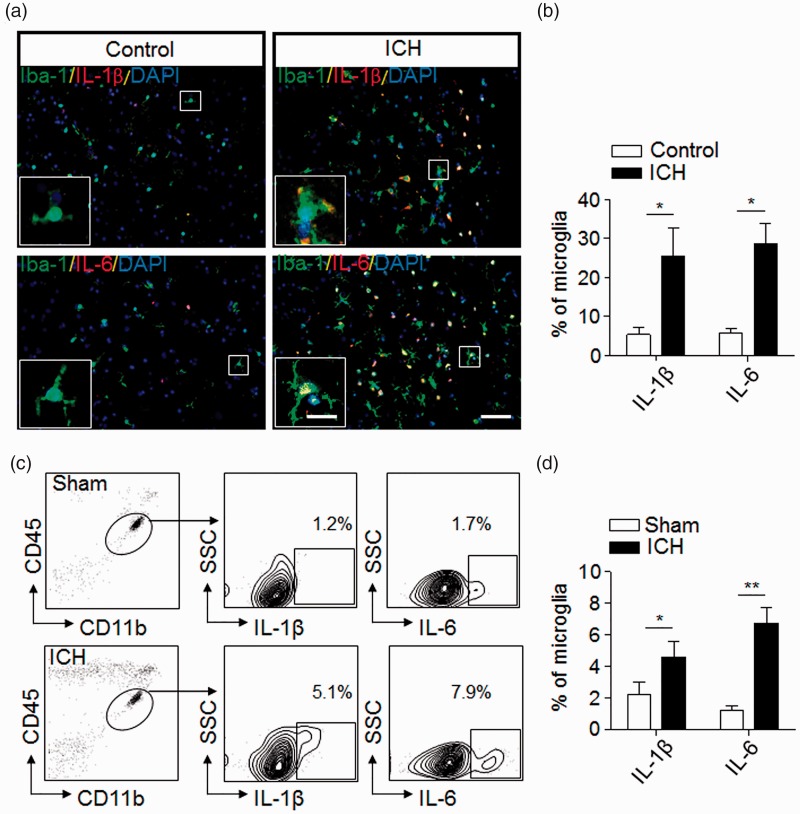
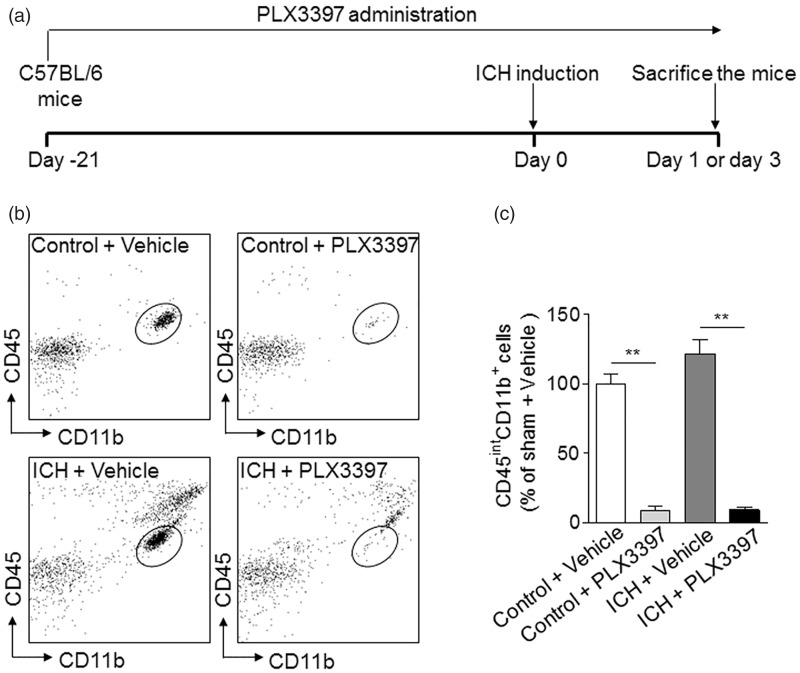
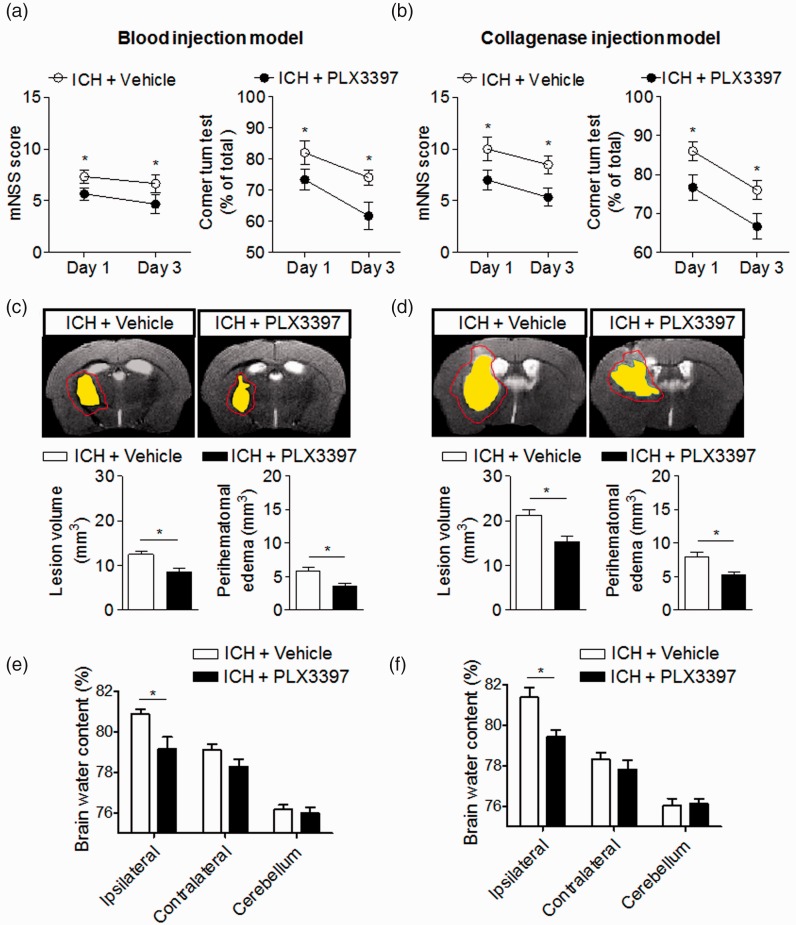
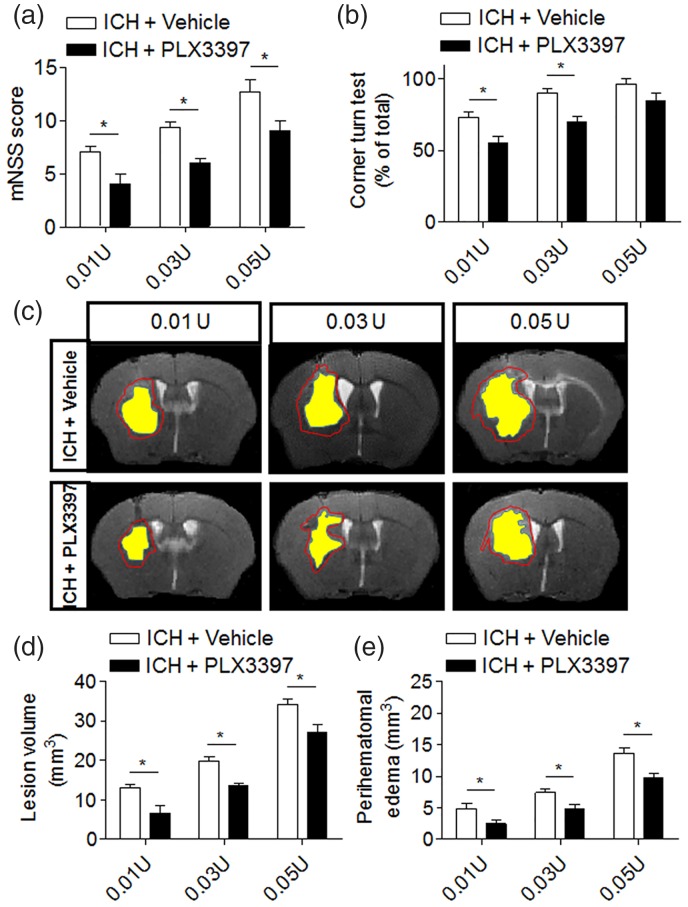
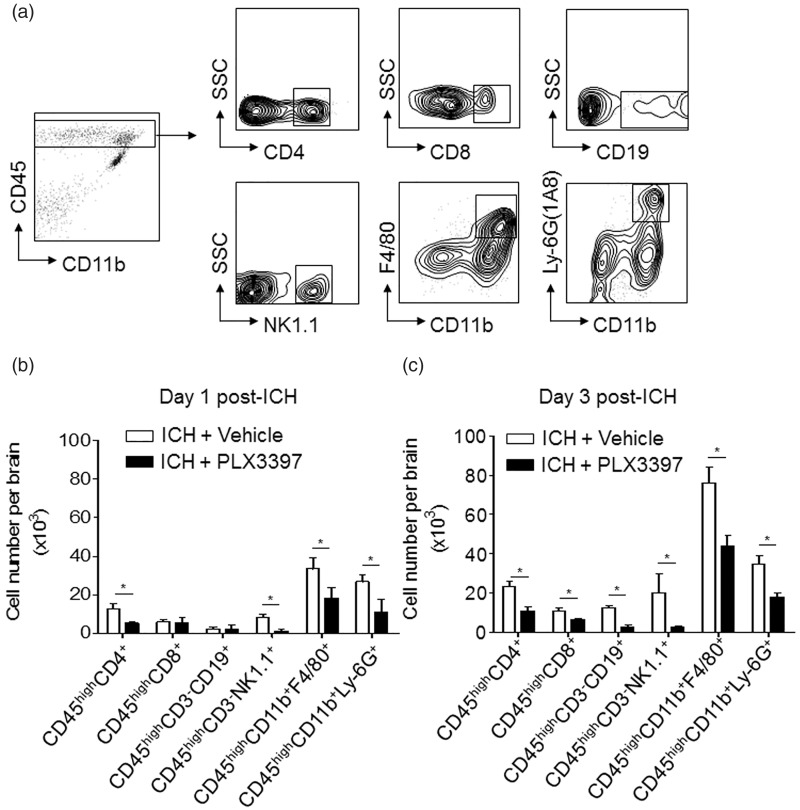
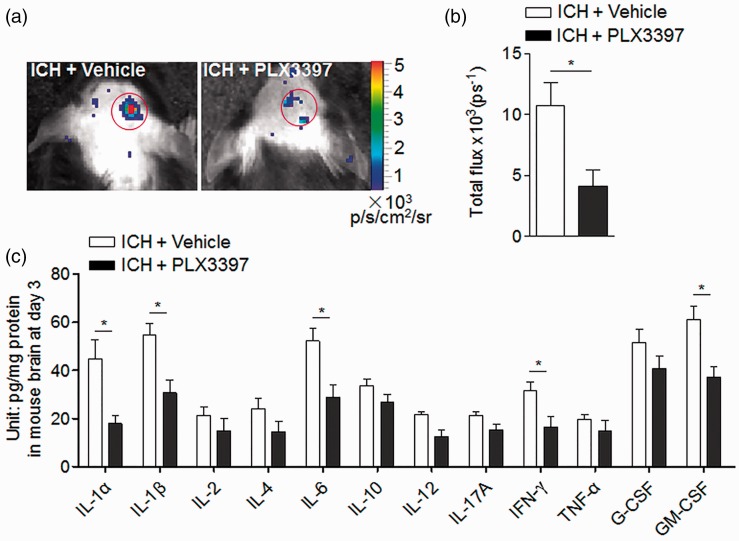
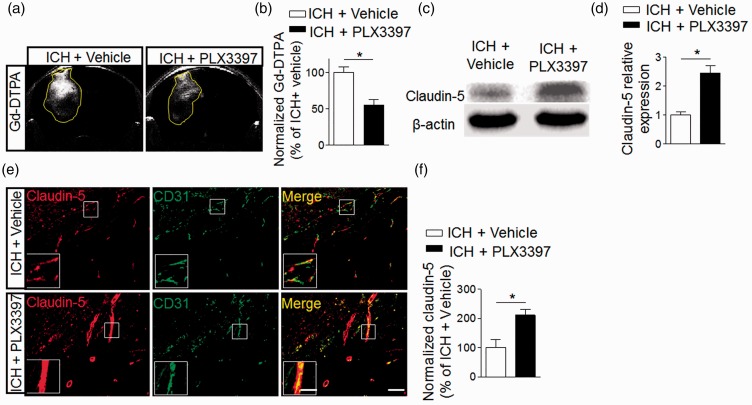
Microglia are the first responders to intracerebral hemorrhage, but their precise role in intracerebral hemorrhage remains to be defined. Microglia are the only type of brain cells expressing the colony-stimulating factor 1 receptor, a key regulator for myeloid lineage cells. Here, we determined the effects of a colony-stimulating factor 1 receptor inhibitor (PLX3397) on microglia and the outcome in the context of experimental mouse intracerebral hemorrhage. We show that PLX3397 effectively depleted microglia, and the depletion of microglia was sustained after intracerebral hemorrhage. Importantly, colony-stimulating factor 1 receptor inhibition attenuated neurodeficits and brain edema in two experimental models of intracerebral hemorrhage induced by injection of collagenase or autologous blood. The benefit of colony-stimulating factor 1 receptor inhibition was associated with reduced leukocyte infiltration in the brain and improved blood-brain barrier integrity after intracerebral hemorrhage, and each observation was independent of lesion size or hematoma volume. These results demonstrate that suppression of colony-stimulating factor 1 receptor signaling ablates microglia and confers protection after intracerebral hemorrhage.

Keywords: Colony stimulating factor 1 receptor inhibitor; brain edema; inflammation; intracerebral hemorrhage; microglia.


Figures

Figure 1.
Figure 1.
Microglial activation and production of inflammation mediators after ICH. (a) Immunostaining of brain sections from ICH patients or non-neurological disease controls shows Iba-1+ cells (green) expressing interleukin-1 beta (IL-1β) (red) and IL-6 (red). Scale bar: 50 µm; insert: 20 µm. (b) Quantification of microglia expressing IL-1β and IL-6 in the brain section from non-neurological disease controls and patients with ICH. n = 20 sections from five ICH patients, n = 15 sections from three non-neurological controls in three independent experiments. Mean ± s.e.m. *p < 0.05. (c,d) Expression of IL-1β and IL-6 in microglia (CD11b+CD45int) from sham control and ICH mice induced by injection of collagenase (0.0375U). Single cell suspensions were prepared from mouse brain tissues at 24 h after ICH or sham procedures. ICH was induced by collagenase injection. Quantification of microglia expressing IL-1β or IL-6 were determined by flow cytometry (c). Summarized results from three independent experiments are shown in (d). Mean ± s.e.m. n = 6 mice per group, *p < 0.05; **p < 0.01.
Figure 2.
Figure 2.
CSF1R inhibition eliminates microglia in brain. (a) Schematics of microglia depletion and experimental design. Mice were treated with 40 mg/kg body weight PLX3397 for 21 days before ICH induction and continued until the end of experiments. (b,c) After PLX3397 treatment for 21 days, ICH was induced by injection of 0.0375U collagenase. After ICH, treatment was continued until mice were sacrificed. At day 3 after ICH, the number of brain microglia (CD45intCD11b+) was analyzed by flow cytometry in the following groups of mice: ICH and non-ICH control mice receiving PLX3397 or vehicle. Gating strategy (b) and summarized results from two independent experiments (c) are shown. Mean ± s.e.m. n = 6 mice per group, **p < 0.01.
Figure 3.
Figure 3.
CSF1R inhibition attenuates neurodeficits and brain edema in two mouse models of ICH. (a–f) PLX3397 reduced neurodeficits, lesion volume, and perihematomal edema volume after ICH. Representative 7T MRI images and quantification of lesion volume and perihematomal edema volume in ICH mice receiving PLX3397 treatment versus untreated controls. ICH was induced by injection of autologous blood (a) or collagenase (b), mice treated with PLX3397 had reduced neurodeficits than untreated controls at indicated time points after ICH induced by injection of autologous blood (a) and collagenase (b). Multi-modal 7T MRI were performed to visualize lesion (T2) and hematoma (SWI). Perihematomal edema volume was calculated by subtracting the hematoma volume from lesion volume. Red lines delineate lesion area, yellow shaded regions represent hematoma area. The method used to determine perihematomal edema volume is depicted in Supplemental Fig. 1A. At day 3 after ICH, lesion volume and brain edema were assessed by this method in autologous blood model (c) and collagenase model (d). At day 3 after ICH, PLX3397 treatment decreased brain water content in ipsilateral hemisphere in autologous blood model (e) and collagenase model (f). Mean ± s.e.m. n = 10 mice per group from two independent experiments, *p < 0.05.
Figure 4.
Figure 4.
The benefit of CSF1R inhibition is independent of hemorrhagic injury volume. ICH was induced by injection of 0.01U, 0.03U, and 0.05U collagenase. Neurological deficits and lesion volume, as well as perihematomal volume were measured at day 3 post-surgery. (a,b) ICH mice treated with PLX3397 had lower mNSS score and better performance in the corner turn test. Mean ± s.e.m. n = 6 mice per group, *p < 0.05. (c–e) PLX3397 treatment reduced lesion volume and perihematomal volume in ICH mice. Red lines delineate lesion volume, yellow shaded areas depict hematoma area. Mean ± s.e.m. n = 6 mice per group from two independent experiments, *p < 0.05.
Figure 5.
Figure 5.
CSF1R inhibition reduces brain-infiltrating leukocytes after ICH. ICH was induced by 0.0375U collagenase injection. At day 1 or 3 after ICH, inflammatory cells were isolated from brain tissues of ICH mice treated with PLX3397 or vehicle (control). (a) Gating strategy of brain-infiltrating immune cells including CD4+T cell (CD45highCD3+CD4+), CD8+ T cell (CD45highCD3+CD8+), B cell (CD45highCD3CD19+), NK cell (CD45highCD3NK1.1+), macrophage (CD45highCD11b+ F4/80+), and neutrophils (CD45high CD11b+ Ly-6G(1A8)+). (b,c) Summarized results show declined infiltration of lymphocytes, monocytes, and neutrophils in the brain of ICH mice receiving PLX3397 treatment at day 1 and 3. Mean ± s.e.m. n = 6 mice per group from three independent experiments, *p < 0.05.
Figure 6.
Figure 6.
CSF1R inhibition reduced brain inflammation after ICH. ICH was induced by injecting 0.0375U collagenase. (a,b) Visualization of ROS generation in vivo bioluminescence imaging and quantification of signal strength in ICH mice receiving PLX3397 and vehicle at day 3 after collagenase model induction. (c) At day 3 after ICH, expression of inflammatory mediators in ICH mice treated with PLX3397 versus untreated controls. Cytokine expression was detected using a Multi-Analyte ELISArray kit. Mean ± s.e.m. n = 3 mice per group from two independent experiments, *p < 0.05.
Figure 7.
Figure 7.
CSF1R inhibition preserves the integrity of blood–brain barrier after ICH. ICH was induced by injecting 0.0375U collagenase. (a) MRI was performed to determine the permeability of the blood–brain barrier in ICH mice treated with PLX3397 or vehicle. Images were scanned under T1 sequence before and after injection of Gd-TDPA at day 3 after ICH. Gd-enhancement was calculated as follows: rT1% = (mean signal intensity of a region of the ipsilateral − mean signal intensity of the contralateral homologous normal brain area)/mean signal intensity of the contralateral homologous normal brain area. (b) Bar graph shows PLX3397 reduced Gd-enhancement at day 3 after ICH. Mean ± s.e.m. n = 3 mice per group from two independent experiments, *p < 0.05. (c) Western blot was performed to assess the expression of claudin-5 in the ipsilateral hemisphere of ICH mice treated with PLX3397 versus vehicle controls. (d) Bar graph shows higher expression level of claudin-5 in the ipsilateral hemisphere of ICH mice treated with PLX3397. n = 6 mice per group. (e) Brain sections from ICH mice treated with PLX3397 or vehicle were stained with CD31 (green) and claudin-5 (red) at day 3 after ICH. Scale bar: 50 µm; insert: 20 µm. (f) Summarized results show that ICH mice treated with PLX3397 had reduced claudin-5 loss in immunofluorescence intensity within the lesion area. Mean ± s.e.m. n = 12 sections from three mice per group from three independent experiments, *p < 0.05.

References

    1. Urday S, Kimberly WT, Beslow LA, et al. Targeting secondary injury in intracerebral haemorrhage–perihaematomal oedema. Nat Rev Neurol 2015; 11: 111–122. - PubMed
    1. Iadecola C, Anrather J. The immunology of stroke: from mechanisms to translation. Nat Med 2011; 17: 796–808. - PMC - PubMed
    1. Macrez R, Ali C, Toutirais O, et al. Stroke and the immune system: from pathophysiology to new therapeutic strategies. Lancet Neurol 2011; 10: 471–480. - PubMed
    1. Wang J. Preclinical and clinical research on inflammation after intracerebral hemorrhage. Prog Neurobiol 2010; 92: 463–477. - PMC - PubMed
    1. Chamorro A, Meisel A, Planas AM, et al. The immunology of acute stroke. Nat Rev Neurol 2012; 8: 401–410. - PubMed

MeSH terms