Review
. 2016 Oct 13;374(2078):20150426.
doi: 10.1098/rsta.2015.0426.

Understanding hydraulic fracturing: a multi-scale problem

Affiliations
Review

Understanding hydraulic fracturing: a multi-scale problem

J D Hyman et al. Philos Trans A Math Phys Eng Sci. .

Abstract

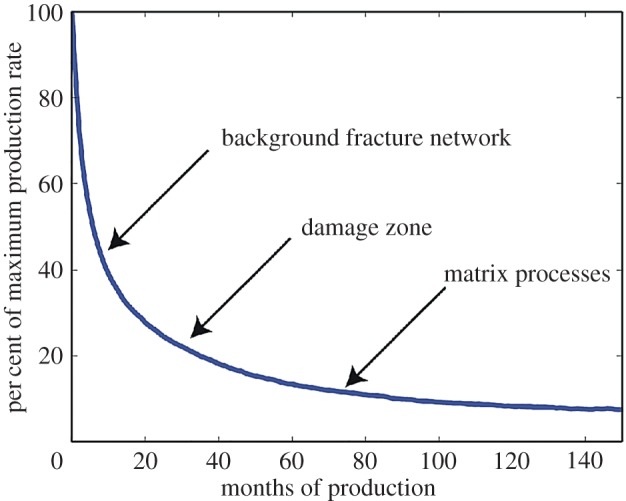
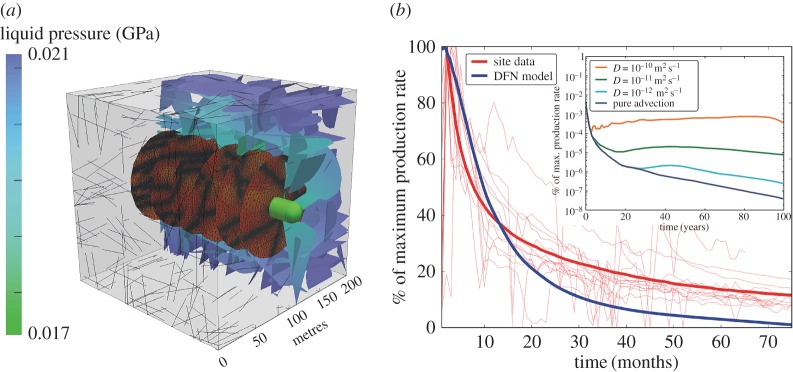
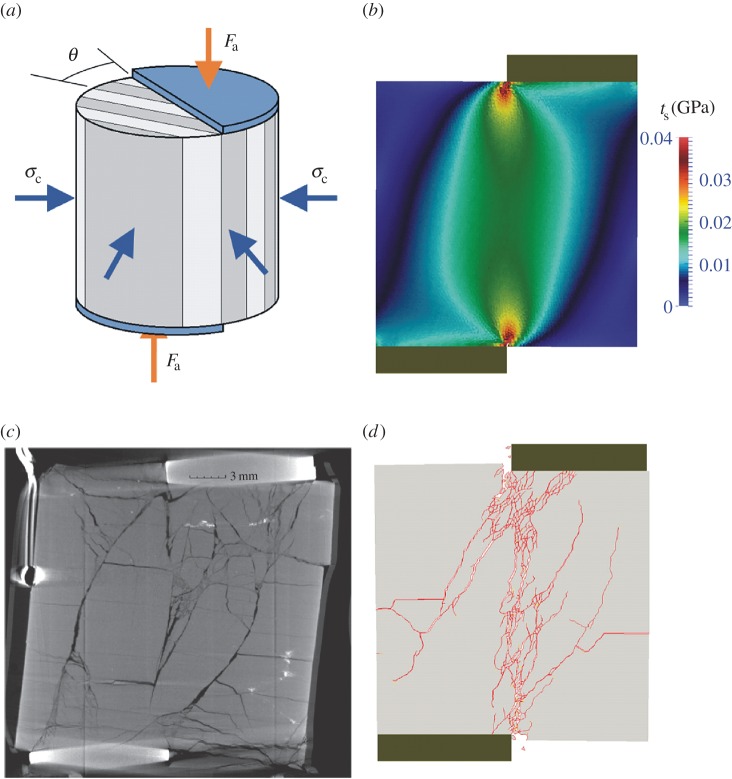
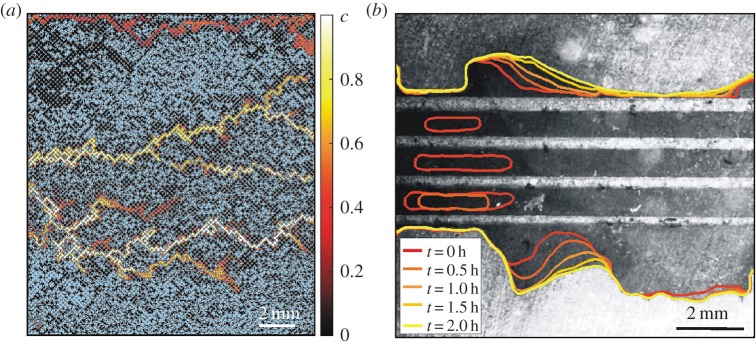
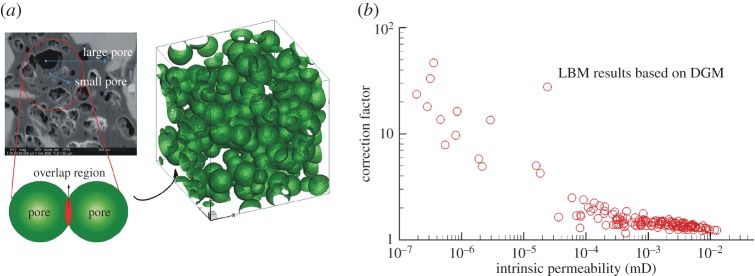
Despite the impact that hydraulic fracturing has had on the energy sector, the physical mechanisms that control its efficiency and environmental impacts remain poorly understood in part because the length scales involved range from nanometres to kilometres. We characterize flow and transport in shale formations across and between these scales using integrated computational, theoretical and experimental efforts/methods. At the field scale, we use discrete fracture network modelling to simulate production of a hydraulically fractured well from a fracture network that is based on the site characterization of a shale gas reservoir. At the core scale, we use triaxial fracture experiments and a finite-discrete element model to study dynamic fracture/crack propagation in low permeability shale. We use lattice Boltzmann pore-scale simulations and microfluidic experiments in both synthetic and shale rock micromodels to study pore-scale flow and transport phenomena, including multi-phase flow and fluids mixing. A mechanistic description and integration of these multiple scales is required for accurate predictions of production and the eventual optimization of hydrocarbon extraction from unconventional reservoirs. Finally, we discuss the potential of CO2 as an alternative working fluid, both in fracturing and re-stimulating activities, beyond its environmental advantages.This article is part of the themed issue 'Energy and the subsurface'.

Keywords: discrete fracture network; hydraulic fracturing; lattice Boltzmann; microfluidics; shale gas; subsurface flow and transport.


Figures

Figure 1.
Figure 1.
Hypothesized breakdown of physical mechanisms governing shale gas production. The key features of the curve are a high initial peak followed by a rapid decline that develops into a sustained low level of production. Plotted along with the curve are regimes corresponding to our hypothesis that different pieces of the production curve are governed by different length scales. At early times, large background fractures in the connected network full of gas are flushed, which leads to the rapid initial decline in production. Next, smaller damage zones around these natural fractures induced by hydraulic fracturing increase surface area with the matrix and sustain production for intermediate times. Matrix processes, such as diffusion and desorption, contribute to and control late production. (Online version in colour.)
Figure 2.
Figure 2.
(a) A discrete fracture network based on a geological characterization of a shale formation generated using dfnWorks [27]. A horizontal well (green cylinder) is included in the domain and hydraulic fractures (brown discs) increase connectivity of the well with the natural fracture network. The background fractures are coloured according to the steady-state pressure solution which is used to simulate transport. (b) Comparison of production curves. The blue line is the mean production curve of multiple DFN model runs and the thick red curve is the mean of the multiple well sites in the Barnett formation in TX, USA, shown in semi-transparent red. The advective model matches the initial decline in production but underestimates the tail because small-scale effects, such as damage zone and matrix diffusion, are not included in the model. Inset: production curves including matrix diffusion for different values of diffusivity [7].
Figure 3.
Figure 3.
(a) In situ X-ray video during a triaxial direct-shear experiment showing radiograms acquired before and after two major fracturing events at 22.2 MPa confining pressure [43]. The two fracture events occurred at 115 and 140 MPa axial shear stress. Diameter of samples 25 mm; resolution of the images about 25 μm. (b) Pre-fracture permeability (κ) was initially very low at 0.03 mD and did not increase significantly following fracturing at high stress (22.2 MPa) as measured under isotropic conditions. The permeability subsequently increased slightly as the isotropic stress was reduced to 7 and then 4 MPa. The sample was then reduced to 0 MPa (gage), removed from the device, re-inserted into the device and then re-stressed at 2, 4, 6 and 8 MPa isostatic stress. This resulted in a substantial jump in permeability, but was still much smaller than in specimens fractured at low confining pressure [41]. (c) In situ image of Utica shale specimen being subjected to triaxial hydraulic fracturing with piezoelectric crystals attached for acoustic (microseismic) monitoring. A diagram of the final fracture geometry (red) is included as traced from post-fracture ex situ X-ray micro-tomography. A notch (blue) was cut into the top to simulate a perforation and to permit storage of a tungsten carbide proppant–water mixture [42].
Figure 4.
Figure 4.
(a) Specimen configuration used in the triaxial direct-shear experiments. Semicircular, porous platens generate a direct-shear plane through the sample that can be oriented with respect to bedding or other features. The image illustrates a specimen orientation with bedding plane parallel to the axial load with an angle θ between the bedding and direct-shear planes. (b) FDEM calculation of shear stress (ts) inside the specimen that is non-uniform due to the direct-shear geometry. (c) An ex situ X-ray micro-tomography section (25 μm resolution) of a 25 mm tall, fractured specimen of Utica shale (OH/PA) using 3.5 MPa confining stress (σc) which resulted in a peak shear stress (tmax) of 30.6 MPa for fracturing. Bedding was oriented perpendicular to the axial load. The permeability (κ) of this specimen ranged from 3 to 30 mD with the highest permeability occurring just after fracturing. (d) Two-dimensional FDEM simulation of the experiment illustrated in (c). The calculated fracture pattern reproduces the two dominant fracture arcs observed in the experiment.
Figure 5.
Figure 5.
(a) Supercritical (sc) CO2 normalized concentration field c(x,t) obtained during scCO2 injection into an initially oil–brine saturated silicon micromodel. scCO2 (white) displacing oil (n-decane, black) and brine (blue) at reservoir conditions (8.3 MPa and 45°C). The oil-wet micromodel dimensions are L×W=15.93 mm×18 mm, with thickness h=140 μm. The mean grain diameter d=130 μm, the average pore throat r= 65 μm and the average pore size λ=130 μm. There are ∼ 16 800 grains in total. The porosity and absolute permeability are ϕ=0.59 and κ=2.59×10⁻⁴ mm2 (26 243 Darcy). scCO2 is injected at constant flow rate Q=0.166 mm3 s−1. The heterogeneity or disorder introduced by the aqueous phase (brine) along with viscous fingering enhance mixing between scCO2 and oil [58]. (b) Water imbibition into the shale matrix from four parallel fractures with different apertures. Contour lines show the spatio-temporal evolution of imbibition [60].
Figure 6.
Figure 6.
Nanoscale studies of shale gas transport and permeability predictions using lattice Boltzmann model simulations. (a) Reconstruction of organic matter using the pore sphere tolerance overlapping method based on the information obtained from a scanning electron microscopy image of shale samples (Sichuan Basin, China). (b) The correction factor between apparent permeability and intrinsic permeability predicted using the LBM plotted along with existing empirical predictions.

Similar articles

Cited by

References

    1. Moniz EJ. et al. 2011. The future of natural gas. Cambridge, MA: Massachusetts Institute of Technology.
    1. Middleton RS, Carey JW, Currier RP, Hyman JD, Kang Q, Karra S, Jiménez-Martínez J, Porter ML, Viswanathan HS. 2015. Shale gas and non-aqueous fracturing fluids: opportunities and challenges for supercritical CO2. Appl. Energy 147, 500–509. (10.1016/j.apenergy.2015.03.023) - DOI
    1. Birdsell DT, Rajaram H, Dempsey D, Viswanathan HS. 2015. Hydraulic fracturing fluid migration in the subsurface: a review and expanded modeling results. Water Resour. Res. 51, 7159–7188. (10.1002/2015WR017810) - DOI
    1. McGlade C, Speirs J, Sorrell S. 2013. Methods of estimating shale gas resources—comparison, evaluation and implications. Energy 59, 116–125. (10.1016/j.energy.2013.05.031) - DOI
    1. Viswanathan HS. et al. 2015. Integrated experimental and computational study of hydraulic fracturing and the use of alternative fracking fluids. In 49th US Rock Mechanics/Geomechanics Symp. Alexandria, VA: American Rock Mechanics Association.

Publication types

LinkOut - more resources