Sex Differences in Tuberculosis Burden and Notifications in Low- and Middle-Income Countries: A Systematic Review and Meta-analysis
- PMID: 27598345
- PMCID: PMC5012571
- DOI: 10.1371/journal.pmed.1002119
Sex Differences in Tuberculosis Burden and Notifications in Low- and Middle-Income Countries: A Systematic Review and Meta-analysis
Abstract
Background: Tuberculosis (TB) case notification rates are usually higher in men than in women, but notification data are insufficient to measure sex differences in disease burden. This review set out to systematically investigate whether sex ratios in case notifications reflect differences in disease prevalence and to identify gaps in access to and/or utilisation of diagnostic services.
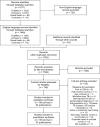
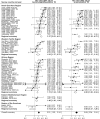
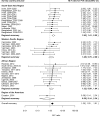
Methods and findings: In accordance with the published protocol (CRD42015022163), TB prevalence surveys in nationally representative and sub-national adult populations (age ≥ 15 y) in low- and middle-income countries published between 1 January 1993 and 15 March 2016 were identified through searches of PubMed, Embase, Global Health, and the Cochrane Database of Systematic Reviews; review of abstracts; and correspondence with the World Health Organization. Random-effects meta-analyses examined male-to-female (M:F) ratios in TB prevalence and prevalence-to-notification (P:N) ratios for smear-positive TB. Meta-regression was done to identify factors associated with higher M:F ratios in prevalence and higher P:N ratios. Eighty-three publications describing 88 surveys with over 3.1 million participants in 28 countries were identified (36 surveys in Africa, three in the Americas, four in the Eastern Mediterranean, 28 in South-East Asia and 17 in the Western Pacific). Fifty-six surveys reported in 53 publications were included in quantitative analyses. Overall random-effects weighted M:F prevalence ratios were 2.21 (95% CI 1.92-2.54; 56 surveys) for bacteriologically positive TB and 2.51 (95% CI 2.07-3.04; 40 surveys) for smear-positive TB. M:F prevalence ratios were highest in South-East Asia and in surveys that did not require self-report of signs/symptoms in initial screening procedures. The summary random-effects weighted M:F ratio for P:N ratios was 1.55 (95% CI 1.25-1.91; 34 surveys). We intended to stratify the analyses by age, HIV status, and rural or urban setting; however, few studies reported such data.
Conclusions: TB prevalence is significantly higher among men than women in low- and middle-income countries, with strong evidence that men are disadvantaged in seeking and/or accessing TB care in many settings. Global strategies and national TB programmes should recognise men as an underserved high-risk group and improve men's access to diagnostic and screening services to reduce the overall burden of TB more effectively and ensure gender equity in TB care.
Conflict of interest statement
The authors have declared that no competing interests exist.
Figures


Comment in
-
Ironing out sex differences in tuberculosis prevalence.Int J Tuberc Lung Dis. 2017 May 1;21(5):483-484. doi: 10.5588/ijtld.17.0194. Int J Tuberc Lung Dis. 2017. PMID: 28399960 Free PMC article. No abstract available.
References
-
- World Health Organization. Global tuberculosis control: WHO report 2011. WHO/HTM/TB/2011.16. 2011 [cited 2 Aug 2016]. Available: http://apps.who.int/iris/bitstream/10665/44728/1/9789241564380_eng.pdf.
-
- World Health Organization. Global tuberculosis report 2015. WHO/HTM/TB/2015.22. 2015 [cited 2 Aug 2016]. Available: http://apps.who.int/iris/bitstream/10665/191102/1/9789241565059_eng.pdf.
-
- Long NH, Johansson E, Lonnroth K, Eriksson B, Winkvist A, Diwan V. Longer delays in tuberculosis diagnosis among women in Vietnam. Int J Tuberc Lung Dis. 1999;3:388–393. - PubMed
-
- Weiss MG, Auer C, Somma D, Abouihia A, Jawahar M, Karim F, et al. Gender and tuberculosis: cross-site analysis and implications of a multi-country study in Bandladesh, India, Malawi, and Colombia. 2006 [cited 2 Aug 2016]. Available: http://www.who.int/entity/tdr/publications/documents/sebrep3.pdf?ua=1.
-
- Borgdorff M, Nagelkerke N, Dye C, Nunn P. Gender and tuberculosis: a comparison of prevalence surveys with notification data to explore sex differences in case detection. Int J Tuberc Lung Dis. 2000;4:123–132. - PubMed
Publication types
MeSH terms
Grants and funding
LinkOut - more resources
Full Text Sources
Other Literature Sources
Medical

