. 2016 Sep 6;11(9):e0162000.
doi: 10.1371/journal.pone.0162000. eCollection 2016.

Blocking the Interactions between Calcium-Bound S100A12 Protein and the V Domain of RAGE Using Tranilast

Affiliations

Blocking the Interactions between Calcium-Bound S100A12 Protein and the V Domain of RAGE Using Tranilast

Jian Wei Chiou et al. PLoS One. .

Abstract

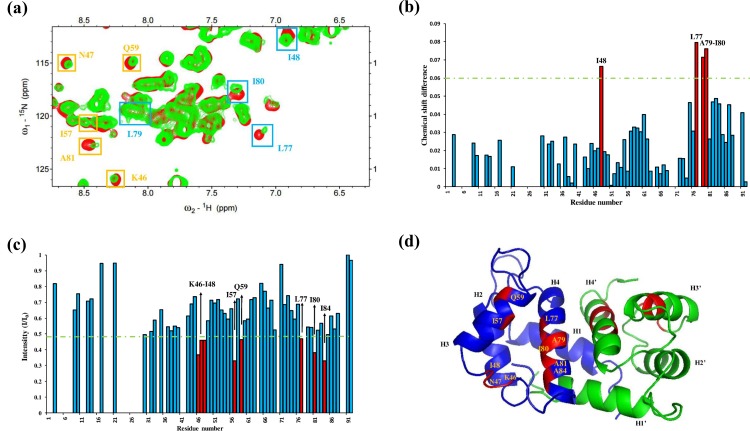
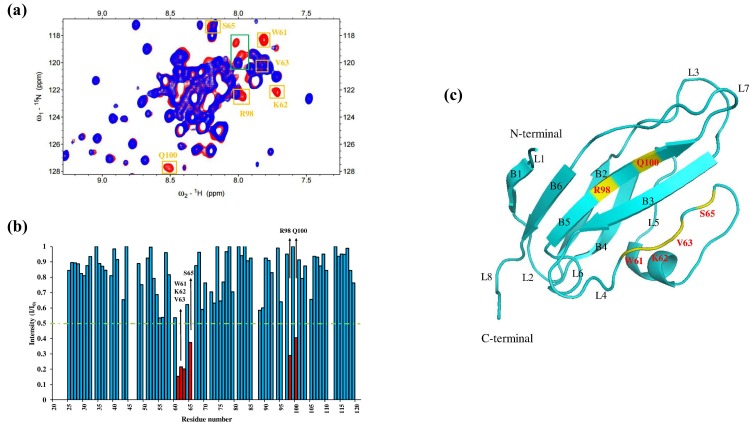
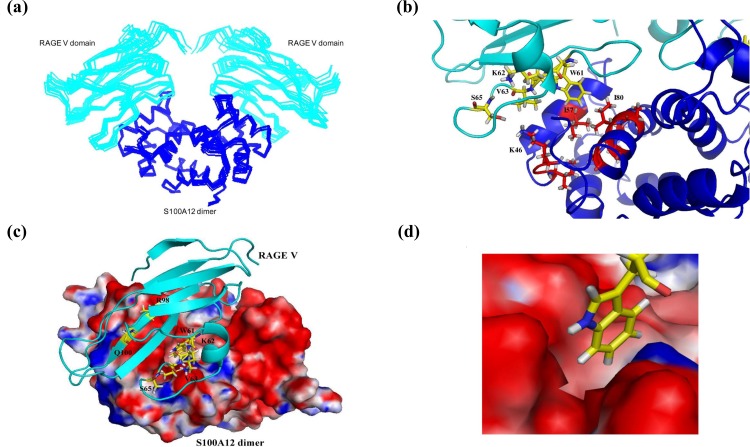
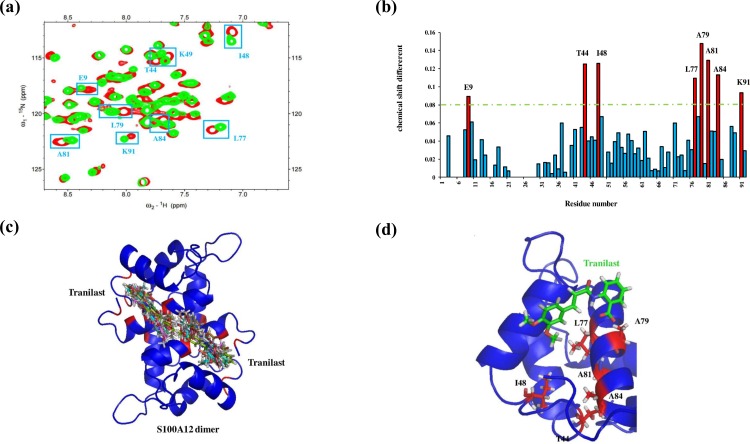
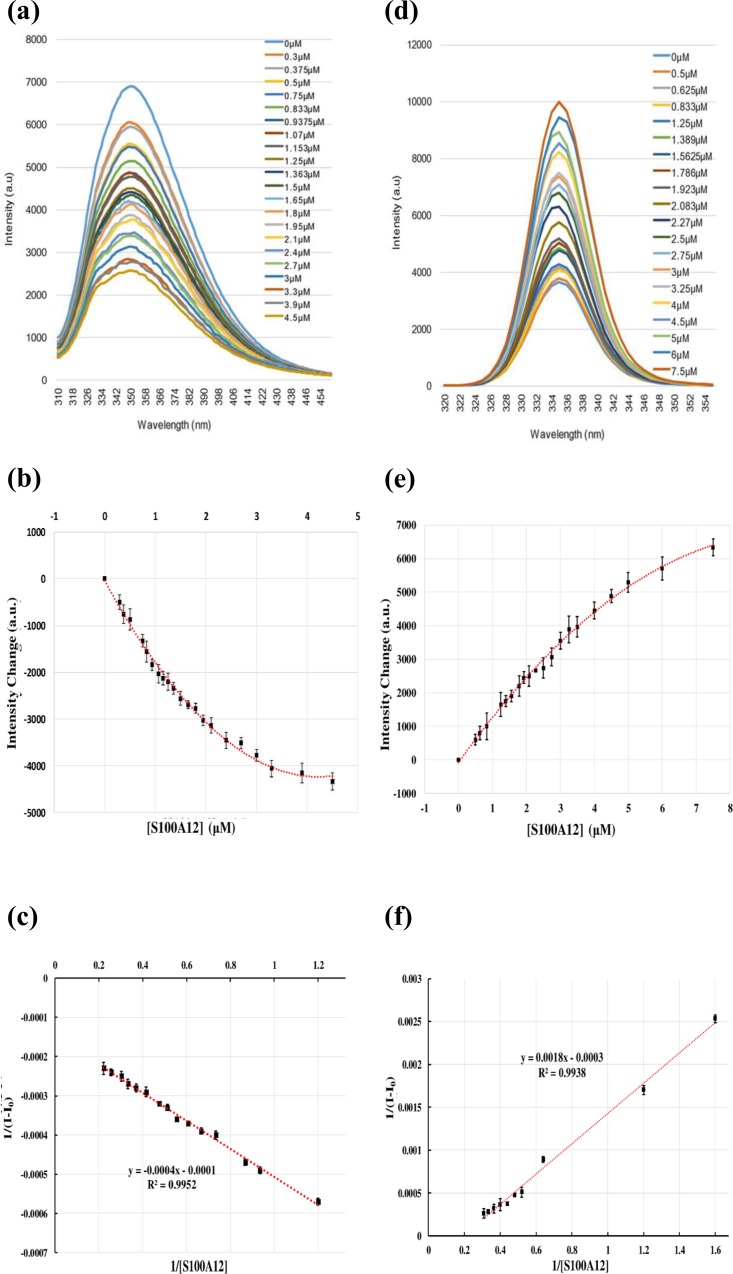
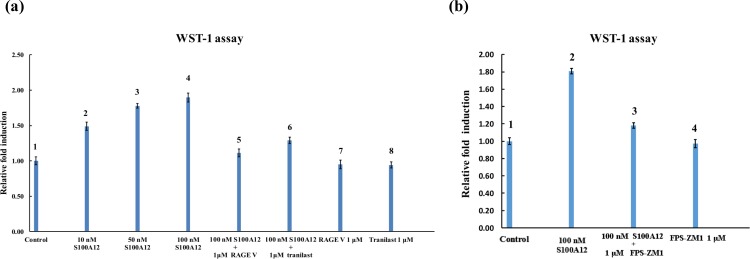
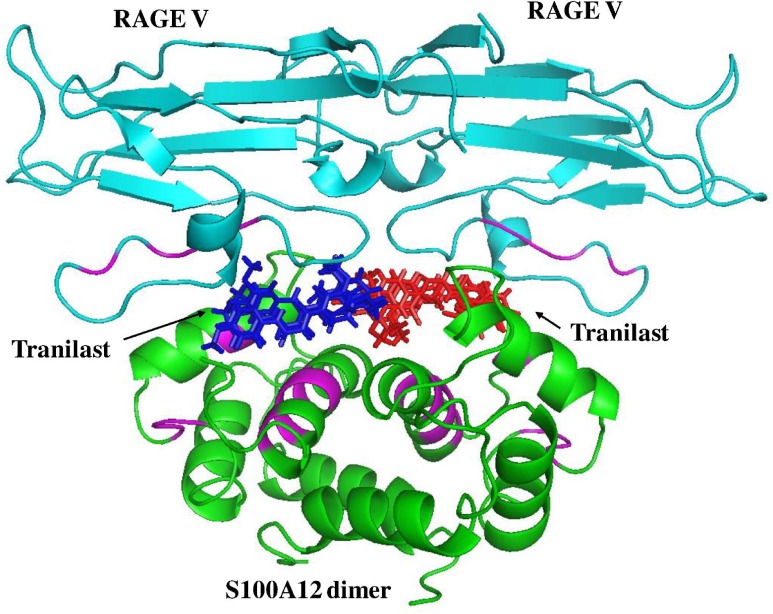
The receptor for advanced glycation end products (RAGE), a transmembrane receptor in the immunoglobulin superfamily, is involved in several inflammatory processes. RAGE induces cellular signaling pathways upon binding with various ligands, such as advanced glycation end products (AGEs), β-amyloids, and S100 proteins. The solution structure of S100A12 and the V ligand-binding region of RAGE have been reported previously. Using heteronuclear NMR spectroscopy to conduct 1H-15N heteronuclear single quantum coherence (HSQC) titration experiments, we identified and mapped the binding interface between S100A12 and the V domain of RAGE. The NMR chemical shift data were used as the constraints for the High Ambiguity Driven biomolecular DOCKing (HADDOCK) calculation to generate a structural model of the S100A12-V domain complex. In addition, tranilast (an anti-allergic drug) showed strong interaction with S100A12 in the 1H-15N HSQC titration, fluorescence experiments, and WST-1 assay. The results also indicated that tranilast was located at the binding site between S100A12 and the V domain, blocking interaction between these two proteins. Our results provide the mechanistic details for a structural model and reveal a potential precursor for an inhibitor for pro-inflammatory diseases, which could be useful for the development of new drugs.


Conflict of interest statement

The authors have declared that no competing interests exist.

Figures

Fig 1
Fig 1. Analysis of the 1H–15N HSQC spectra of S100A12 in complex with the unlabeled RAGE V domain.
(a) Overlay of the 1H–15N HSQC spectra of 0.76 mM 15N-labeled S100A12 (red) and S100A12 in complex with 0.76 mM unlabeled RAGE V domain (green). The residues that changed are indicated by yellow (decreased intensity) and cyan (perturbation) boxes, and were identified using bar diagrams. (b) Bar graph of cross-peak chemical shift perturbation where the green line represents the threshold of selected residues exhibiting significant changes. (c) Bar graph of cross-peak intensity (I/I0), where I represents the cross-peak intensity of the spectra of the complex solution (S100A12–RAGE V domain) and I0 is the cross-peak intensity of the spectra of S100A12 alone. (d) Ribbon representation of S100A12, the residues exhibiting significant changes are marked in red. H1 to H4 indicate helix 1 to helix 4 in the S100A12 monomer.
Fig 2
Fig 2. Analysis of the 1H–15N HSQC spectrum of the labeled RAGE V domain with unlabeled S100A12.
(a) Overlay of the 1H–15N HSQC spectra of 0.5 mM 15N-labeled RAGE V domain (red) and the spectra of the complex with 0.5 mM unlabeled S100A12 (blue). The only changes were decreases in the cross-peak intensity, which are marked as yellow boxes. Two residues (green boxes) exhibited obvious changes but lacked assignment. (b) Diagram of the cross-peak intensity ratio (I/I0), where I represents cross-peak intensity in the spectra of the complex and I0 represents the cross-peak intensity in the spectra of the RAGE V domain alone. The green line represents the threshold for selecting residues that showed obvious decreases in intensity, and the selected residues are shown in red. (c) Ribbon representation of the RAGE V domain, in which the selected residues are mapped (yellow). B1–B6 correspond to the beta sheet and L1–L8 refer to the loop in the RAGE V domain.
Fig 3
Fig 3
The binding model of RAGE V domain and S100A12 (a) The ensemble solution structures of the S100A12–RAGE V domain binary complex overlaid after the HADDOCK calculation. (b) The binding sites of the S100A12–RAGE V domain complex. Ribbon representation of the binding region of S100A12 (blue ribbon) in complex with the RAGE V domain (cyan ribbon). The residues involved in the interaction are represented as red (S100A12) and yellow (RAGE V domain) sticks. (c) Electrostatic surface representation of the binding interface of S100A12 with the RAGE V domain (cyan ribbon). The positive region is colored blue and the negative region is red. (d) Expanded picture showing the binding region of W61 of RAGE V with the S100A12 surface. The atoms in S100A12 and the RAGE V domain are colored gray (protons), red or yellow (carbon atoms), and blue (nitrogen atoms).
Fig 4
Fig 4. Analysis of the 1H–15N HSQC spectra of the labeled S100A12 in complex with the ligand (tranilast).
(a) Overlay of the 1H–15N HSQC spectra of 0.5 mM 15N-labeled S100A12 (red) and S100A12 in complex with 0.5 mM tranilast (green). The results only indicate chemical shift changes and the cross-peaks are marked as cyan boxes. (b) Bar diagram of the cross-peak chemical shift perturbation plotted using HSQC titration data. The green line represents the threshold of selected residues that showed obvious changes in chemical shift, and the selected residues are shown in red. (c) Overlay of the lowest energy conformations of the clusters obtained from the HADDOCK calculation showing the binding region of tranilast. (d) Ribbon representation of S100A12, with the selected residues marked in red. Tranilast is shown in green, and the atoms in S100A12 and tranilast are colored gray (protons), red or green (carbon atoms), pink (oxygen atoms), and blue (nitrogen atoms).
Fig 5
Fig 5. Fluorescence measurements of S100A12 with the RAGE V domain and tranilast.
(a) Fluorescence curve of the titration between S100A12 and the RAGE V domain. The initial concentration of the RAGE V domain was 1.5 μM; this was titrated with S100A12 at a concentration of 0–4.5 μM. (b) Curve showing the titration of the RAGE V domain with S100A12 with changes in fluorescence intensity. (c) Linear curve showing the dissociation constant to be 3.1 ± 1.4 μM. The original curve was further processed and calculated using Eq (1). To fit to a linear curve, some outlying points were removed. (d) Fluorescence curve of the titration between S100A12 and tranilast. The initial concentration of tranilast was 2.5 μM; S100A12 was added at a concentration of 0–7.5 μM to measure the emission changes. (e) Curve showing the titration of tranilast with S100A12. (f) Linear curve showing the dissociation constant to be approximately 6.1 ± 1.4 μM. Some points were removed to fit to a linear curve. For all fluorescence experiments, each titration was replicated three times and the error bars are shown on the curves.
Fig 6
Fig 6. Functional assay of S100A12 with the RAGE V domain and tranilast.
(a) SW480 cells were treated with 0 nM (control), 10 nM, 50 nM, or 100 nM S100A12. Cell proliferation was determined after the SW480 cells had been starved of serum for 24 h (lanes 1–4) by adding the WST-1 agent and measuring the optical density. The effects of the other treatments (S100A12 plus 1 μM RAGE V domain and S100A12 plus 1 μM tranilast) on cell proliferation activity were measured for a further 48 h (lanes 5–6). Neither tranilast nor RAGE V domain alone had an effect on cell proliferation activity (lanes 7–8). (b) The serum-starved SW480 cells were treated with 100 nM S100A12, 100 nM S100A12 plus 1 μM FPS-ZM1, or 1 μM FPS-ZM1 for 48 h. The relative cell numbers were determined by WST-1 cell proliferation assay. This experiment was replicated four times and the mean ± standard deviations (SDs) are shown in the plot.
Fig 7
Fig 7
Overlay of the following two complex structures: (1) the S100A12 (green) and RAGE V domain (cyan) complex; and (2) the S100A12–tranilast complex (S100A12 is shown in green and tranilast is shown in red and blue). It is clear that tranilast blocks the binding sites (magenta) between S100A12 and the RAGE V domain.

References

    1. Zimmer DB, Cornwall EH, Landar A, Song W. The S100 protein family: History, function, and expression. Brain Research Bulletin. 1995;37(4):417–29. 10.1016/0361-9230(95)00040-2. - DOI - PubMed
    1. Jensen JL, Indurthi VSK, Neau DB, Vetter SW, Colbert CL. Structural insights into the binding of the human receptor for advanced glycation end products (RAGE) by S100B, as revealed by an S100B-RAGE-derived peptide complex. Acta Crystallographica Section D. 2015;71(5):1176–83. 10.1107/S1399004715004216 - DOI - PMC - PubMed
    1. Wicki R, Marenholz I, Mischke D, Schäfer BW, Heizmann CW. Characterization of the human S100A12 (calgranulin C, p6, CAAF1, CGRP) gene, a new member of the 5100 gene cluster on chromosome 1q21. Cell Calcium. 1996;20(6):459–64. 10.1016/S0143-4160(96)90087-1. - DOI - PubMed
    1. Guignard F, Mauel J, Markert M. Identification and characterization of a novel human neutrophil protein related to the S100 family. The Biochemical journal. 1995;309 (Pt 2):395–401. Epub 1995/07/15. ; PubMed Central PMCID: PMCPmc1135745. - PMC - PubMed
    1. Heizmann CW, Fritz G, Schafer BW. S100 proteins: structure, functions and pathology. Frontiers in bioscience: a journal and virtual library. 2002;7:d1356–68. Epub 2002/05/07. . - PubMed

MeSH terms