. 2016 Oct 3;126(10):3827-3836.
doi: 10.1172/JCI82908. Epub 2016 Sep 6.

Functionally identifiable apoptosis-insensitive subpopulations determine chemoresistance in acute myeloid leukemia

Functionally identifiable apoptosis-insensitive subpopulations determine chemoresistance in acute myeloid leukemia

Patrick D Bhola et al. J Clin Invest. .

Abstract

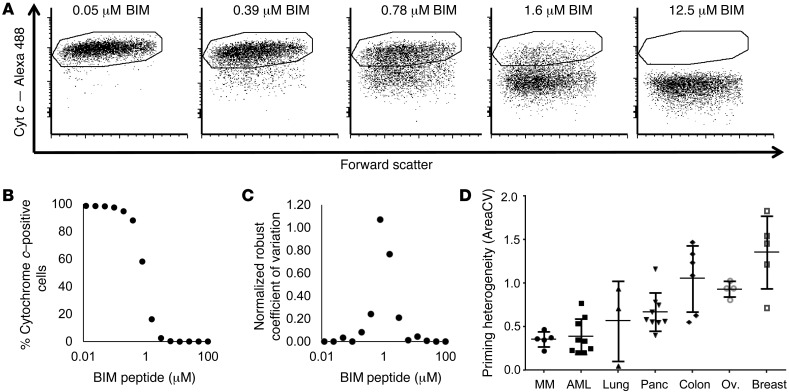
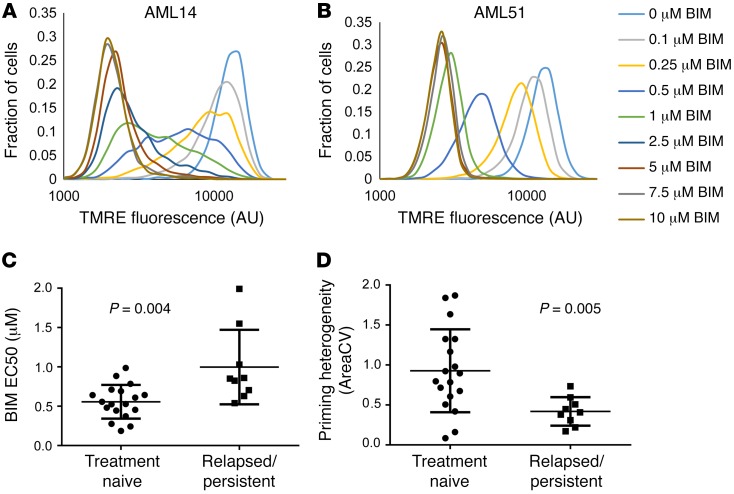
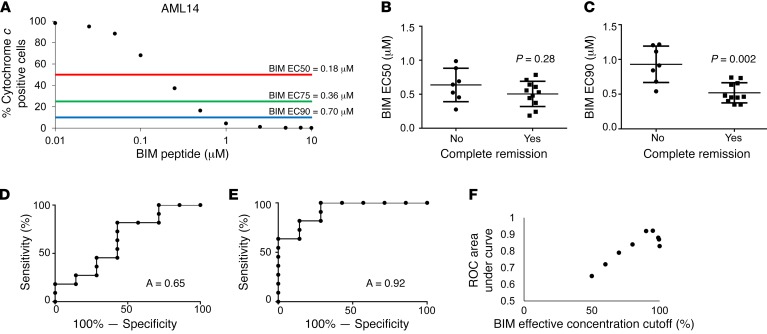
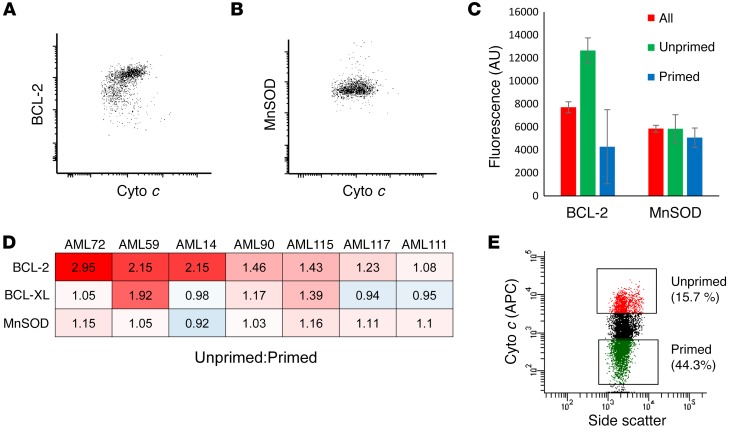
Upfront resistance to chemotherapy and relapse following remission are critical problems in leukemia that are generally attributed to subpopulations of chemoresistant tumor cells. There are, however, limited means for prospectively identifying these subpopulations, which hinders an understanding of therapeutic resistance. BH3 profiling is a functional single-cell analysis using synthetic BCL-2 BH3 domain-like peptides that measures mitochondrial apoptotic sensitivity or "priming." Here, we observed that the extent of apoptotic priming is heterogeneous within multiple cancer cell lines and is not the result of experimental noise. Apoptotic priming was also heterogeneous in treatment-naive primary human acute myeloid leukemia (AML) myeloblasts, and this heterogeneity decreased in chemotherapy-treated AML patients. The priming of the most apoptosis-resistant tumor cells, rather than the median priming of the population, best predicted patient response to induction chemotherapy. For several patients, these poorly primed subpopulations of AML tumor cells were enriched for antiapoptotic proteins. Developing techniques to identify and understand these apoptosis-insensitive subpopulations of tumor cells may yield insights into clinical chemoresistance and potentially improve therapeutic outcomes in AML.


Figures

Figure 1
Figure 1. Cell-cell variability in mitochondrial priming is present in many cancer cell lines.
(A) BH3 profile using increasing concentrations of the BIM peptide in the OCI-AML2 cell line. Scatter plots with cytochrome c immunofluorescence on the y axis and forward scatter on the x axis. Scatter plots are representative of 3 experiments. Cyt c, cytochrome c. (B) Quantification of average cytochrome c loss in the whole population. (C) Quantification of variability using the robust coefficient of variation — a measure of statistical dispersion. We calculate priming heterogeneity to be the area under this coefficient of variation curve. (D) Priming heterogeneity in cell lines from different malignancies. Panc, pancreas; Ov, ovary; MM, multiple myeloma. Error bars represent SD.
Figure 2
Figure 2. Subcellular heterogeneity in apoptotic priming in a cancer cell line.
(A) Image of cytochrome c immunofluorescence in a Patu8902 cell after BH3 profiling with an intermediate level of cytochrome c retention. (B) Images of the MitoTracker mitochondrial dye, which stains all mitochondria, from the same cell as in A. (C) Overlay of cytochrome c (green) and MitoTracker (red) from the cell in A and B. (D) Histogram of cytochrome c/MitoTracker intensity showing a bimodal distribution of cytochrome c loss. Histogram represents an aggregate of 10 different cells. (E) Line scan through a cell in C. (F) Quantification of a line scan through the cell, demonstrating that mitochondria within the same cell are differentially primed for apoptosis. This line scan is representative of 7 different line scans. All images obtained with confocal microscopy. Original magnification, ×60.
Figure 3
Figure 3. Mitochondrial priming heterogeneity reflects intrinsic and biological cell-to-cell differences.
(A) Experimental overview. Cell lineages were tracked, and cells underwent BH3 profiling using time-lapse microscopy. (B) Images of a sister cell pair. (C) Images of BH3 profiling. Loss of TMRE indicates onset of MOMP. Images are representative of 3 different time lapses. All images obtained using wide-field microscopy. Original magnification, ×10. Arrows in B and C indicate a mother cell dividing into two sister cells (D) Quantification of TMRE loss in single cells. Sister cells are similarly colored. (E) Correlation of half-times of TMRE loss in sister cells. The red line represents an exact correlation between half-times (R2 = 0.7). (F) Correlation of half-times of TMRE loss in randomly paired cells. The red line represents an exact correlation between half-times (R2 = 0.04). (G) Correlation of apoptosis of AML cell lines in response to etoposide and baseline apoptotic priming in response to the synthetic BIM peptide (P = 0.01, Spearman r = 0.82). (H) Correlation between heterogeneity of apoptosis in response to etoposide (x axis) and apoptotic priming heterogeneity (y axis) (P = 0.01, Spearman r = 0.85).
Figure 4
Figure 4. Treatment with cytotoxic chemotherapy decreases mitochondrial priming and decreases apoptotic heterogeneity in AML human samples.
(A) Histogram of TMRE loss at different BIM peptide concentrations for relapsed patient AML14. (B) Histogram of TMRE loss at different BIM peptide concentrations for treatment of naive patient AML51. (C) Column correlation of BIM EC50 indicating that relapsed cells are less primed for apoptosis (P = 0.004, Mann-Whitney U test). (D) Column correlation of priming heterogeneity indicating that priming heterogeneity is decreased in relapsed tumors (P = 0.005, Mann-Whitney U test). Error bars represent SD.
Figure 5
Figure 5. Poorly primed subpopulations predict complete remission in AML.
(A) Dose-response curve of cytochrome c loss in BIM cells is used to identify the different effective concentrations of the BIM peptide. (B) Correlation of BIM EC50 and remission status of patients (P = 0.28, Mann-Whitney U test). (C) Correlation of BIM EC90 and remission status of patients (P = 0.002, Mann-Whitney U test). Error bars represent SD. (D and E) ROC for the BIM EC50 and BIM EC90 in predicting complete remission. (F) Area under curve from ROC analysis for different effective concentration cutoffs of the BIM peptide. The curve peaks at an effective concentration of 95%.
Figure 6
Figure 6. Differential immunofluorescence of BCL-2 proteins in unprimed cells.
(A) Imunofluorescent staining of BCL-2 in cells after BH3 profiling of AML72 indicates that BCL-2 expression is low in primed cells and relatively higher in unprimed cells. (B) No difference in MnSOD staining in primed or unprimed cells. (C) Quantification of protein expression in the 10% most primed cells (primed), in the 10% least primed cells (unprimed), and in all cells (all). Error bars represent 95% CI of individual cells. (D) Quantification of the ratio of protein expression in unprimed/primed cells in different primary AML tumors for several apoptotic proteins. Red indicates that the protein is preferentially expressed in unprimed fractions. (E) Different populations of AML567 that were sorted and separately sequenced.

References

    1. Burnett A, Wetzler M, Löwenberg B. Therapeutic advances in acute myeloid leukemia. J Clin Oncol. 2011;29(5):487–494. doi: 10.1200/JCO.2010.30.1820. - DOI - PubMed
    1. Keating MJ, et al. Response to salvage therapy and survival after relapse in acute myelogenous leukemia. J Clin Oncol. 1989;7(8):1071–1080. - PubMed
    1. Kantarjian HM, Keating MJ, Walters RS, McCredie KB, Freireich EJ. The characteristics and outcome of patients with late relapse acute myelogenous leukemia. J Clin Oncol. 1988;6(2):232–238. - PubMed
    1. Nowell PC. The clonal evolution of tumor cell populations. Science. 1976;194(4260):23–28. doi: 10.1126/science.959840. - DOI - PubMed
    1. Greaves M, Maley CC. Clonal evolution in cancer. Nature. 2012;481(7381):306–313. doi: 10.1038/nature10762. - DOI - PMC - PubMed

Publication types

MeSH terms

Substances