. 2016 Sep;72(Pt 9):1062-72.
doi: 10.1107/S2059798316012225. Epub 2016 Aug 31.

Improved ligand geometries in crystallographic refinement using AFITT in PHENIX

Affiliations

Improved ligand geometries in crystallographic refinement using AFITT in PHENIX

Pawel A Janowski et al. Acta Crystallogr D Struct Biol. 2016 Sep.

Abstract

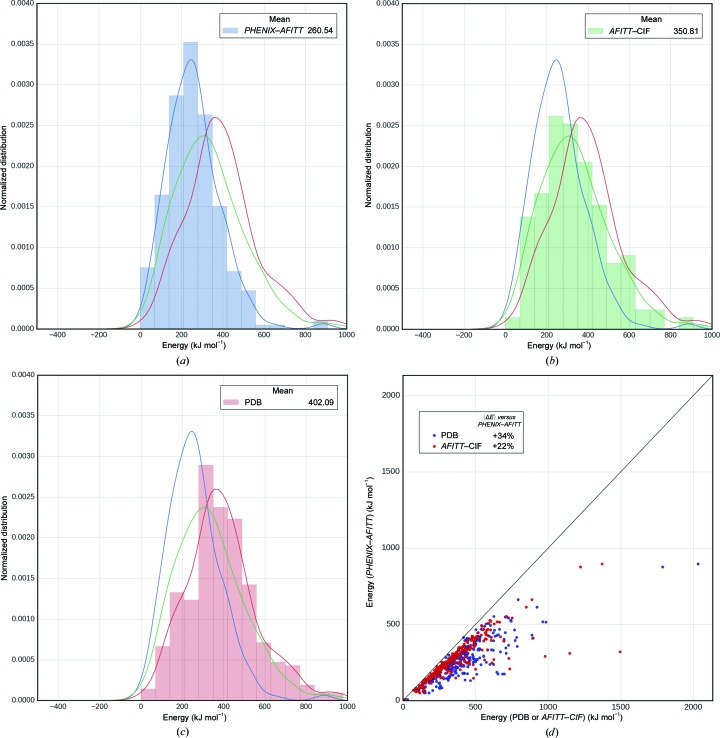
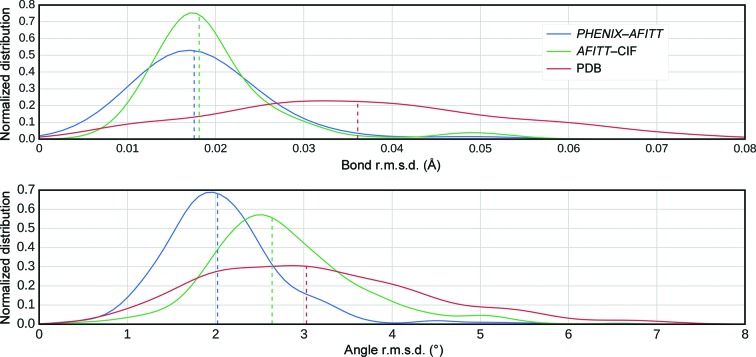
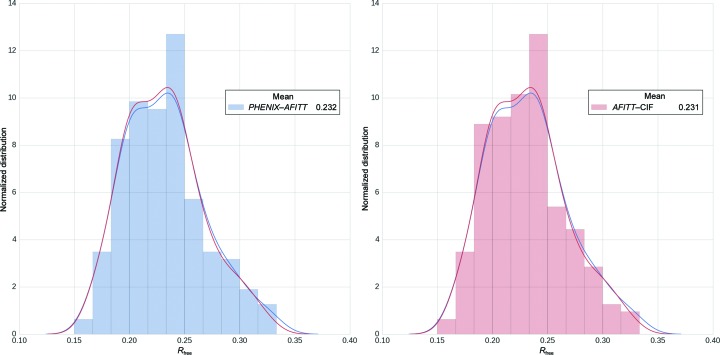
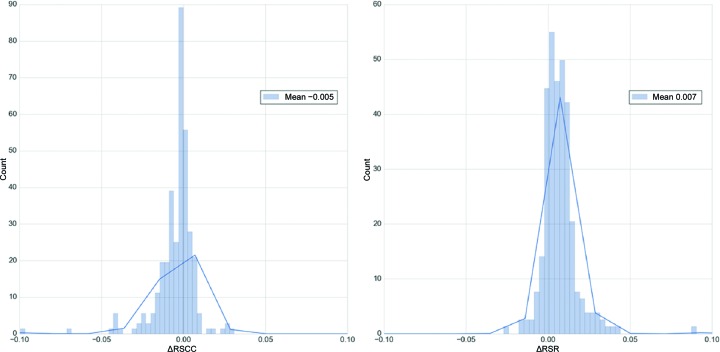
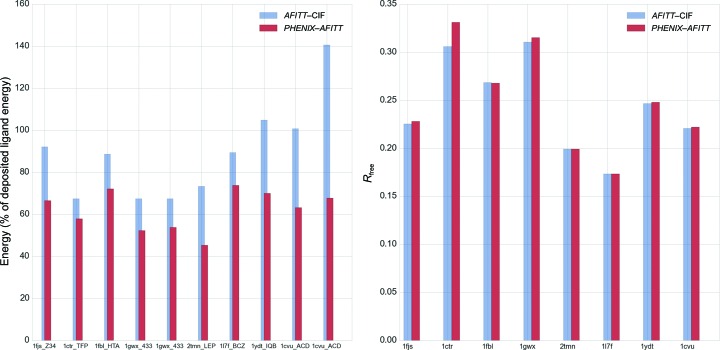
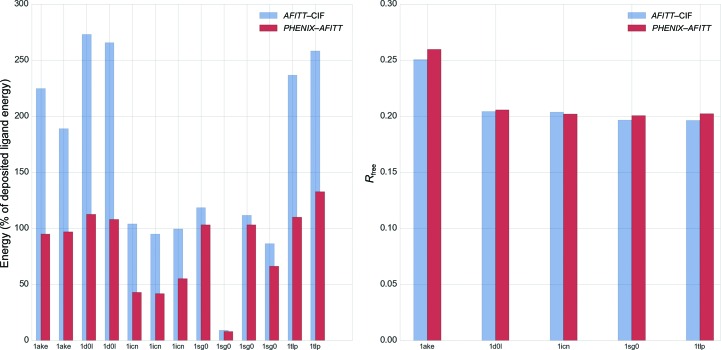
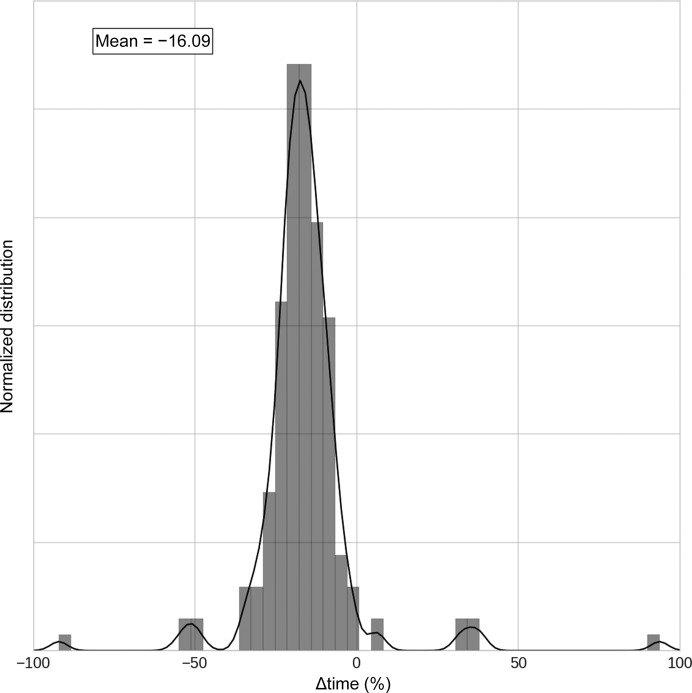
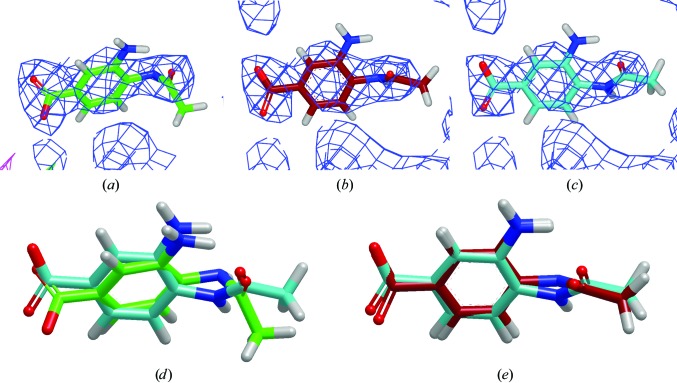
Modern crystal structure refinement programs rely on geometry restraints to overcome the challenge of a low data-to-parameter ratio. While the classical Engh and Huber restraints work well for standard amino-acid residues, the chemical complexity of small-molecule ligands presents a particular challenge. Most current approaches either limit ligand restraints to those that can be readily described in the Crystallographic Information File (CIF) format, thus sacrificing chemical flexibility and energetic accuracy, or they employ protocols that substantially lengthen the refinement time, potentially hindering rapid automated refinement workflows. PHENIX-AFITT refinement uses a full molecular-mechanics force field for user-selected small-molecule ligands during refinement, eliminating the potentially difficult problem of finding or generating high-quality geometry restraints. It is fully integrated with a standard refinement protocol and requires practically no additional steps from the user, making it ideal for high-throughput workflows. PHENIX-AFITT refinements also handle multiple ligands in a single model, alternate conformations and covalently bound ligands. Here, the results of combining AFITT and the PHENIX software suite on a data set of 189 protein-ligand PDB structures are presented. Refinements using PHENIX-AFITT significantly reduce ligand conformational energy and lead to improved geometries without detriment to the fit to the experimental data. For the data presented, PHENIX-AFITT refinements result in more chemically accurate models for small-molecule ligands.

Keywords: AFITT; PHENIX; geometry restraints; ligands; macromolecular refinement.


Figures

Figure 1
Figure 1
Ligand conformational energies from PDB-deposited models, AFITT–CIF refinement and PHENIXAFITT refinement. (a, b, c) Histograms for PHENIXAFITT (a), AFITT–CIF (b) and PDB-deposited (c) energies with kernel density estimates (KDE) of the distributions for the full set of test ligand energies. Means of each set of ligand conformation energies are shown in the legend. (d) A scatter plot comparing the conformation energy of each ligand obtained from a PHENIXAFITT refinement against either the deposited PDB model (blue dots) or the models after refinement with an MMFF-derived CIF dictionary file (red dots). The mean percentage reduction in energy from using the PHENIXAFITT protocol is 34% versus the PDB conformations and 22% versus AFITT–CIF.
Figure 2
Figure 2
Mogul validation of the PDB-deposited, AFITT–CIF refined and PHENIXAFITT refined ligand conformations. The top panel shows the bond r.m.s.d. distribution in Å and the bottom panel shows the angle r.m.s.d. distribution in degrees. R.m.s.d. is relative to the Mogul library of ‘ideal’ bonds and angles.
Figure 3
Figure 3
R free distributions and histograms after refining the test set using either AFITT–CIF (right) or the PHENIXAFITT (left) protocol. Means of each distribution are shown in the legend.
Figure 4
Figure 4
The difference distribution of the ligand RSCC (left) and RSR (right) for the AFITT–CIFF versus PHENIXAFITT models. The mean difference for each distribution is shown in the legend.
Figure 5
Figure 5
Comparison of eight randomly selected PDB structures. The left panel shows energies obtained with AFITT–CIF refined and PHENIXAFITT refined ligand restraints as a percentage of the deposited ligand energy. Labels provide the PDB code followed by the three-letter code for the ligand. Some PDB structures have more than one instance of a ligand. The right panel shows the R free obtained after refinement with Engh and Huber or AFITT geometry restraints on the ligands.
Figure 6
Figure 6
Comparison of five PDB structures containing ligand instances with alternate conformations. It is important to note that only for PDB entries 1ake and 1icn were the deposited ligand conformations modeled as alternate conformations. All labels and statistics are as in Fig. 4 ▸.
Figure 7
Figure 7
Difference in run time between traditional Engh and Huber and PHENIXAFITT refinement as a percentage of the Engh and Huber refinement run time. Positive numbers indicate that the PHENIXAFITT refinement is faster and negative numbers that the PHENIX Engh and Huber refinement is faster. Five outliers (PDB entries 1q41, 1sq5, 1q1g, 1hq2 and 1dd7) have been omitted from the plot.
Figure 8
Figure 8
A depiction of the conformations of the second copy of the ligand from PDB entry 1ive. (a), (b) and (c) show the deposited (C atoms colored green), AFITT–CIF (C atoms coloured red) and PHENIXAFITT (C atoms colored turquoise) conformations, respectively. The density shown is σA-weighted 2F oF c density contoured at 1σ and the difference map was contoured at 3σ. (d) shows the deposited and PHENIXAFITT conformations using the previously described color scheme, where the r.ms.d. is 0.81 Å and the energy difference is 134 kJ mol−1. (e) shows an overlay of the AFITT–CIF and PHENIXAFITT conformations. The r.m.s.d. is 0.31 Å and the energy difference is 41.6 kJ mol−1. There are no examples in this data set where the r.m.s.d. between the AFITT–CIF and PHENIXAFITT conformations exceeds 0.4 Å, yet the energy difference between the two conformations was almost always large (>10 kJ mol−1).
Figure 9
Figure 9
A depiction of the conformations of the first copy of the ligand from PDB entry 4cox. (a), (b) and (c) show the deposited (C atoms colored green), AFITT–CIF (C atoms colored red) and PHENIXAFITT (C atoms colored turquoise) conformations, respectively. The density shown is σA-weighted 2F oF c density contoured at 1σ. No difference density was observed when the density was contoured at 3σ. There are a total of four copies of the ligand in this deposition. (d) and (e) show the overlay for the first copy between the deposited and AFITT–CIF and between the AFITT–CIF and PHENIXAFITT conformations, respectively, using the previously described coloring scheme. The r.m.s.d. between the deposited and the AFITT–CIF conformation was 0.24 Å, whereas the difference between the AFITT–CIF and PHENIXAFITT conformations was 0.38 Å. In this case the AFITT–CIF refinement was unable to find the low-energy conformation generated by the PHENIXAFITT refinement, as shown by the r.m.s.d. and the difference energies of 1.57 kJ mol−1 for the deposited versus AFITT–CIF and 119 kJ mol−1 for the deposited versus PHENIXAFITT conformation. (f, g) Copy 4 presents a different result. The AFITT–CIF and PHENIXAFITT methods both find a lower energy conformation where the r.m.s.d. for the deposited versus AFITT–CIF and deposited versus PHENIXAFITT was 0.7 Å, but the r.m.s.d. for the AFITT–CIF and PHENIXAFITT conformations was only 0.20 Å. The energy differences were 31.2 kJ mol−1 for deposited versus AFITT–CIF and 117 kJ mol−1 for deposited versus PHENIXAFITT. An interesting observation from this example is that the PHENIXAFITT method appears to be more consistent at finding low-energy conformations (the standard deviation across the four samples was 4.08 kJ mol−1), whereas the AFITT–CIF method was not as consistent (standard deviation of 19.6 kJ mol−1).

References

    1. Adams, P. D. et al. (2010). Acta Cryst. D66, 213–221.
    1. Afonine, P. V., Grosse-Kunstleve, R. W., Echols, N., Headd, J. J., Moriarty, N. W., Mustyakimov, M., Terwilliger, T. C., Urzhumtsev, A., Zwart, P. H. & Adams, P. D. (2012). Acta Cryst. D68, 352–367. - PMC - PubMed
    1. Allen, F. H. (2002). Acta Cryst. B58, 380–388. - PubMed
    1. Berman, H., Henrick, K. & Nakamura, H. (2003). Nature Struct. Biol. 10, 980. - PubMed
    1. Berman, H. M., Westbrook, J., Feng, Z., Gilliland, G., Bhat, T. N., Weissig, H., Shindyalov, I. N. & Bourne, P. E. (2000). Nucleic Acids Res. 28, 235–242. - PMC - PubMed

Publication types