. 2016 Dec:78:87-95.
doi: 10.1016/j.jchemneu.2016.09.001. Epub 2016 Sep 4.

Localization of rem2 in the central nervous system of the adult rainbow trout (Oncorhynchus mykiss)

Affiliations

Localization of rem2 in the central nervous system of the adult rainbow trout (Oncorhynchus mykiss)

Anna G Downs et al. J Chem Neuroanat. 2016 Dec.

Abstract

Rem2 is member of the RGK (Rem, Rad, and Gem/Kir) subfamily of the Ras superfamily of GTP binding proteins known to influence Ca2+ entry into the cell. In addition, Rem2, which is found at high levels in the vertebrate brain, is also implicated in cell proliferation and synapse formation. Though the specific, regional localization of Rem2 in the adult mammalian central nervous system has been well-described, such information is lacking in other vertebrates. Rem2 is involved in neuronal processes where the capacities between adults of different vertebrate classes vary. Thus, we sought to localize the rem2 gene in the central nervous system of an adult anamniotic vertebrate, the rainbow trout (Oncorhynchus mykiss). In situ hybridization using a digoxigenin (DIG)-labeled RNA probe was used to identify the regional distribution of rem2 expression throughout the trout central nervous system, while real-time polymerase chain reaction (rtPCR) further supported these findings. Based on in situ hybridization, the regional distribution of rem2 occurred within each major subdivision of the brain and included large populations of rem2 expressing cells in the dorsal telencephalon of the cerebrum, the internal cellular layer of the olfactory bulb, and the optic tectum of the midbrain. In contrast, no rem2 expressing cells were resolved within the cerebellum. These results were corroborated by rtPCR, where differential rem2 expression occurred between the major subdivisions assayed with the highest levels being found in the cerebrum, while it was nearly absent in the cerebellum. These data indicate that rem2 gene expression is broadly distributed and likely influences diverse functions in the adult fish central nervous system.

Keywords: Central nervous system; In situ hybridization; Rainbow trout.


Figures

Figure 1
Figure 1
Regionalization of relative rem2 expression in the trout CNS using rtPCR. The schematic of the trout brain in dorsal view below the figure indicates each region assayed. The trout rem2 gene showed differential expression in the central nervous system (One-way ANOVA; P < 0.0001). The relative expression of rem2 in the cerebrum was significantly greater than its expression in all other areas assayed (* = Tukey's multiple comparison; P < 0.001). Abbreviations: OB = olfactory bulb, CR = cerebrum, DI= diencephalon, MB= midbrain, CB= cerebellum, HB = hindbrain, SC= spinal cord.
Figure 2
Figure 2
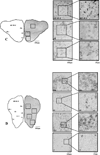
Representative photomicrographs depicting the distribution of rem2 in situ hybridization labeling in the brain of the adult trout (n = 4). Brain schematic at top indicates corresponding level of each photomicrograph. Top Panel, Sense (+): Photomicrographs showing no labeling of cells in the cerebrum (Level E; see brain schematic) from a brain tissue section incubated with the rem2 sense (+) DIG-labeled riboprobe. A–J Anti-Sense (−): Photomicrographs of labeled cells in brain tissue sections incubated with the rem2 anti-sense (−) DIG-labeled riboprobe. On the left, low magnification (25×) photomicrographs of entire right-side frontal sections (ventral at bottom) of brain level mirrored by line drawings indicating major neuroanatomical areas. Boxes in low magnification photomicrographs indicate region with intermediate magnification (100×) in the box to the immediate right. Boxes in intermediate magnification photomicrographs indicate region with high magnification (400×) in the box to the far right. Scale bars for each panel are located below each photomicrograph. The region of the photomicrograph is indicated by abbreviations in each box. Abbreviations accompanied by arrows indicate location of labeling relative to that region with arrows pointing left indicating the region as being medial to the labeling and arrows pointing right indicating the region as being lateral to the labeling.
Figure 2
Figure 2
Representative photomicrographs depicting the distribution of rem2 in situ hybridization labeling in the brain of the adult trout (n = 4). Brain schematic at top indicates corresponding level of each photomicrograph. Top Panel, Sense (+): Photomicrographs showing no labeling of cells in the cerebrum (Level E; see brain schematic) from a brain tissue section incubated with the rem2 sense (+) DIG-labeled riboprobe. A–J Anti-Sense (−): Photomicrographs of labeled cells in brain tissue sections incubated with the rem2 anti-sense (−) DIG-labeled riboprobe. On the left, low magnification (25×) photomicrographs of entire right-side frontal sections (ventral at bottom) of brain level mirrored by line drawings indicating major neuroanatomical areas. Boxes in low magnification photomicrographs indicate region with intermediate magnification (100×) in the box to the immediate right. Boxes in intermediate magnification photomicrographs indicate region with high magnification (400×) in the box to the far right. Scale bars for each panel are located below each photomicrograph. The region of the photomicrograph is indicated by abbreviations in each box. Abbreviations accompanied by arrows indicate location of labeling relative to that region with arrows pointing left indicating the region as being medial to the labeling and arrows pointing right indicating the region as being lateral to the labeling.

Similar articles

References

    1. Alonso JR, Lara J, Vecino E, Coveῆas R, Aijón J. Cell proliferation in the olfactory bulb of adult freshwater teleosts. J Anat. 1989;163:155–163. - PMC - PubMed
    1. Alvarado AS, Tsonis PA. Bridging the regeneration gap: genetic insights from diverse animal models. Nat Rev Genet. 2006;7:873–884. - PubMed
    1. Anglade I, Mazurais D, Douard V, Le Jossic-Corcos C, Mañanos EL, Michel D, Kah O. Distribution of glutamic acid decarboxylase mRNA in the forebrain of the rainbow trout as studied by in situ hybridization. J Comp Neurol. 1999;410(2):277–289. - PubMed
    1. Becker JAJ, Befort K, Blad C, Filliol D, Ghate A, Dembele D, Thibault C, Koch M, Muller J, Lardenois A, Poch O, Kieffer BL. Transcriptome analysis identifies genes with enriched expression in the mouse central extended amygdala. Neuroscience. 2008;156(4):950–965. - PMC - PubMed
    1. Béguin P, Mahalakshmi RN, Nagashima K, Cher DH, Takahashi A, Yamada Y, Seino Y, Hunziker W. 14-3-3 and calmodulin control subcellular distribution of Kir/Gem and its regulation of cell shape and calcium channel activity. J Cell Sci. 2005;118:1923–1934. - PubMed

Publication types