. 2016 Sep 7:6:32417.
doi: 10.1038/srep32417.

Authentication and characterisation of a new oesophageal adenocarcinoma cell line: MFD-1

Collaborators, Affiliations

Authentication and characterisation of a new oesophageal adenocarcinoma cell line: MFD-1

Edwin Garcia et al. Sci Rep. .

Erratum in

Abstract

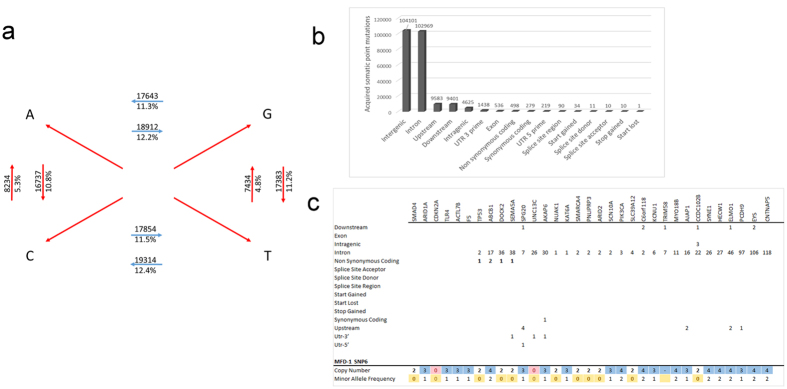
New biological tools are required to understand the functional significance of genetic events revealed by whole genome sequencing (WGS) studies in oesophageal adenocarcinoma (OAC). The MFD-1 cell line was isolated from a 55-year-old male with OAC without recombinant-DNA transformation. Somatic genetic variations from MFD-1, tumour, normal oesophagus, and leucocytes were analysed with SNP6. WGS was performed in tumour and leucocytes. RNAseq was performed in MFD-1, and two classic OAC cell lines FLO1 and OE33. Transposase-accessible chromatin sequencing (ATAC-seq) was performed in MFD-1, OE33, and non-neoplastic HET1A cells. Functional studies were performed. MFD-1 had a high SNP genotype concordance with matched germline/tumour. Parental tumour and MFD-1 carried four somatically acquired mutations in three recurrent mutated genes in OAC: TP53, ABCB1 and SEMA5A, not present in FLO-1 or OE33. MFD-1 displayed high expression of epithelial and glandular markers and a unique fingerprint of open chromatin. MFD-1 was tumorigenic in SCID mouse and proliferative and invasive in 3D cultures. The clinical utility of whole genome sequencing projects will be delivered using accurate model systems to develop molecular-phenotype therapeutics. We have described the first such system to arise from the oesophageal International Cancer Genome Consortium project.


Figures

Figure 1
Figure 1. Whole genome SNP genotyping and landscape of copy number variations in normal, tumour and MFD-1 genome.
(a) Genetic material extracted from germ line, tumour, adjacent normal tissue, and two passages of the MFD-1 cell lines were analysed with the SNP6 array platform. The maximum number of SNPs with identical genotype calls was observed between genomic material isolated from normal tissue and that extracted from peripheral blood cells reaching 771,946 for a 99% concordance rate (Genomic DNA from PBMCs), (b,c) Circos plots with Genomic CNVs on the inner 4 rings (Black: genomic material from PBMCs, Green: Genomic material from normal oesophagus, Blue: genomic material from tumour, Orange: genomic material from MFD-1) and WGS data from the parent tumour on the outer ring. (b) Whole genome (c) chromosomes 2, 8, 11, 12, 15, 17, X and Y. CNV comparison between germ-line, tumour and cell line DNA confirms derivation of MFD-1 from the parent tumour. For example, the CNV plot of MFD-1 shows a loss of the Y chromosome and a duplication of the X chromosome that was also revealed by WGS in tumour DNA. The MFD-1 cell line retains CNV from germline DNA and tumour DNA. CNVs found in the normal genome, such as the gain with a scale of 4 on chromosome 2 at 95 cM is readily observed in all of the genomes under analysis, acting as a fingerprint of identity. A homozygous deletion is observed in genome isolated from PMBC on chromosome 8 at 45 cM, this mark is preserved across the genomes under analysis. On chromosome 16 at 20 cM there is a gain CNV in the tumour tissue that is not found in the normal genome (PMBC or adjacent normal tissue DNA) but is readily observed in the MFD-1 cell line.
Figure 2
Figure 2. Somatic acquired mutations in tumour and copy number in MFD-1
. (a) Transition and transversion frequency of somatic acquired mutations in tumour tissue. (b) Histogram of somatic acquired mutations in tumour. A left skew histogram shows the most common mutations are in non-coding region and the less common but functionally relevant mutations are in regions around or within genes. (c) Recurrent and frequent genes mutated in oesophageal adenocarcinoma were assessed in the dataset of acquired mutations catalogued in the tumour. Genomic regions and frequency of somatic acquired mutations is shown for each gene. In this panel four genes have non-synonymous acquired mutations. The ABCB1 carries two whilst TP53, DOCK2 and SEMA5A carry one. The lower frame shows MFD-1 copy number status revealed by SNP-6 array platform and the minor allele frequency. The colour code represents the aneuploidy status with yellow indicating loss of heterozygosity, red homozygous deletion and blue copy number gain. The ABCB1 has a copy number state of 4 compatible with amplification whilst the TP53, SEMA5A and DOCK2 shows loss of heterozygosity with a minor allele frequency of zero and duplication of a mutant allele which translate as a copy number of 2. This is suggestive of loss of heterozygosity in a copy neutral state.
Figure 3
Figure 3. Selected validation of the mutation and expression profile of MFD-1 using multiple platforms.
(a) Sequencing of genomic DNA from the MFD-1 cell line. PCR primers designed ~250 bp around the mutation were created at the following positions: ABCB1 (Chr7: 87179790 and 87150168); DOCK2: Chr5: 169135201; TP53: Chr17: 7577120; SEMA5A: Chr5: 9190519. The mutant allele is highlighted in red. The sequence depth in the germline and tumour tissue, the frequency observed for the mutant allele in NGS reads, the sequence adjacent to the observed mutation and the Ensemble identification reference is presented. The MFD1 cell line is heterozygote at two somatic acquired mutations on the ABCB1 gene, homozygote wild-type in the DOCK2 gene, and homozygote mutant in the TP53 and SEMA5A gene. (b) Expression profiles shown as logCPM in epithelial markers and common recurrent genes in OAC. Dark blue counts not found in RNAseq dataset. (c) Pan cytokeratin western blot in lysates from OE33, FLO-1, MFD-1 and two Cancer associated fibroblast. (d) EPCAM (CD326) stained using flow cytometry in MFD-1.
Figure 4
Figure 4. Open chromatin regions in MFD-1 cells.
(a) RNA-seq analysis (top) of genes differentially expressed to higher levels in MFD-1 compared to OE33 cells (>3 fold change; P-value < 0.01). Each column represents one biological replicate. Data are row Z-normalised. The corresponding ATAC-seq signal in a 700 bp window around the TSS (−500 to +200 bp) of this cohort of genes in each cell line is shown as a boxplot of cut count densities (bottom). ***P-value < 0.05 (2 × 10−13). (b) ATAC-seq analysis showing the cut counts in regions showing differential accessibility (>3 fold; P-value < 0.05) between MFD-1 and HET1A cells. Data are shown for MFD-1, OE33 and HET1A cells and grouped according to being more open in MFD-1 or HET1A cells. (c) UCSC genome browser tracks showing ATAC-seq cleavage data associated with the KAT6A (top) and KRT8 (bottom) loci in HET1A, OE33 and MFD-1 cells. Regions of open chromatin associated with the TSS (arrows) are boxed. (d) De novo motif discovery of transcription factor binding sites over-represented in the regions that are either open in MFD-1 cells (top) of MET1A cells (bottom). (e) GO term analysis of genes associated with a TSS showing changes (>3 fold) in open chromatin in MFD-1 compared to HET1A cells. The most highly significant terms associated with disease Ontology are shown.
Figure 5
Figure 5. MFD-1 is tumour forming in SCID mouse.
(a) MFD-1 cell line tumour in SCID mouse 4X (b) Tumour in SCID mouse from MFD-1 cells implanted with Normal oesophageal fibroblast 2X. (c) Tumour in SCID mouse from MFD-1 cells implanted with Cancer Associated Fibroblast (CAFs) 2X (d) Tumour H&E from case 4X (e) Tumour H&E from case 10X (f) Tumour in SCID mouse from MFD-1 cells implanted with Cancer Associated Fibroblast 10X (g) KI-67 of tumour in SCID mouse from MFD-1 cells implanted with CAFs 4X (h) MFD-1 cell line morphology under live microscopy 4X (i) MFD-1 in 3D cultures.

References

    1. Noble F. et al. Refining pathological evaluation of neoadjuvant therapy for adenocarcinoma of the esophagus. World J. Gastroenterol. 19, 9282–9293 (2013). - PMC - PubMed
    1. Vaughan T. L. & Fitzgerald R. C. Precision prevention of oesophageal adenocarcinoma. Nature reviews. Gastroenterology & hepatology 12, 243–248, doi: 10.1038/nrgastro.2015.24 (2015). - DOI - PMC - PubMed
    1. Dulak A. M. et al. Exome and whole-genome sequencing of esophageal adenocarcinoma identifies recurrent driver events and mutational complexity. Nat. Genet. 45, 478–486 (2013). - PMC - PubMed
    1. Weaver J. M. et al. Ordering of mutations in preinvasive disease stages of esophageal carcinogenesis. Nat. Genet. 46, 837–843 (2014). - PMC - PubMed
    1. Nones K. et al. Genomic catastrophes frequently arise in esophageal adenocarcinoma and drive tumorigenesis. Nat Commun 5, 5224, doi: 10.1038/ncomms6224 (2014). - DOI - PMC - PubMed

Publication types

Supplementary concepts