

Increased risk of type I errors in cluster randomised trials with small or medium numbers of clusters: a review, reanalysis, and simulation study
- PMID: 27600609
- PMCID: PMC5013635
- DOI: 10.1186/s13063-016-1571-2
Increased risk of type I errors in cluster randomised trials with small or medium numbers of clusters: a review, reanalysis, and simulation study
Abstract
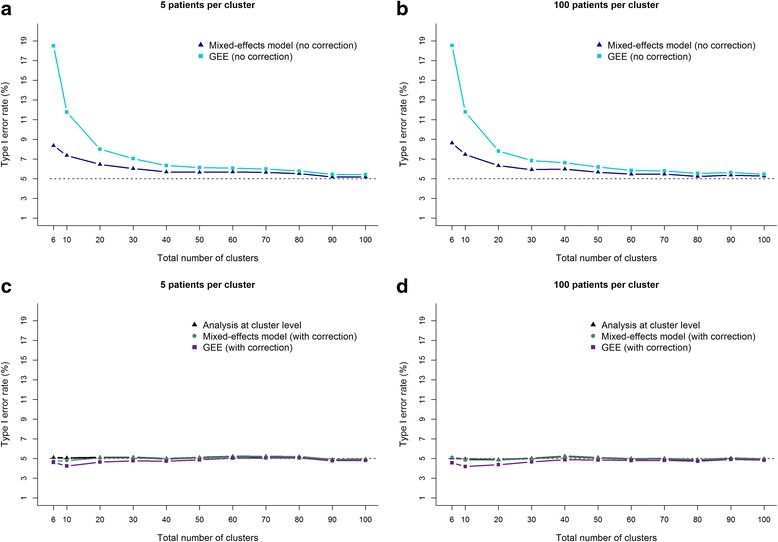
Background: Cluster randomised trials (CRTs) are commonly analysed using mixed-effects models or generalised estimating equations (GEEs). However, these analyses do not always perform well with the small number of clusters typical of most CRTs. They can lead to increased risk of a type I error (finding a statistically significant treatment effect when it does not exist) if appropriate corrections are not used.
Methods: We conducted a small simulation study to evaluate the impact of using small-sample corrections for mixed-effects models or GEEs in CRTs with a small number of clusters. We then reanalysed data from TRIGGER, a CRT with six clusters, to determine the effect of using an inappropriate analysis method in practice. Finally, we reviewed 100 CRTs previously identified by a search on PubMed in order to assess whether trials were using appropriate methods of analysis. Trials were classified as at risk of an increased type I error rate if they did not report using an analysis method which accounted for clustering, or if they had fewer than 40 clusters and performed an individual-level analysis without reporting the use of an appropriate small-sample correction.
Results: Our simulation study found that using mixed-effects models or GEEs without an appropriate correction led to inflated type I error rates, even for as many as 70 clusters. Conversely, using small-sample corrections provided correct type I error rates across all scenarios. Reanalysis of the TRIGGER trial found that inappropriate methods of analysis gave much smaller P values (P ≤ 0.01) than appropriate methods (P = 0.04-0.15). In our review, of the 99 trials that reported the number of clusters, 64 (65 %) were at risk of an increased type I error rate; 14 trials did not report using an analysis method which accounted for clustering, and 50 trials with fewer than 40 clusters performed an individual-level analysis without reporting the use of an appropriate correction.
Conclusions: CRTs with a small or medium number of clusters are at risk of an inflated type I error rate unless appropriate analysis methods are used. Investigators should consider using small-sample corrections with mixed-effects models or GEEs to ensure valid results.
Keywords: Cluster randomised trials; Degree-of-freedom corrections; Generalised estimating equations; Mixed-effects models; Small-sample corrections.
Figures
References
-
- Donner A, Klar N. Design and analysis of cluster randomization trials in health research. London: Arnold; 2000.
-
- Eldridge S, Kerry S. A practical guide to cluster randomised trials in health services research. Chichester: Wiley; 2012.
-
- Hayes RJ, Moulton LH. Cluster randomised trials. Boca Raton: Chapman & Hall/CRC; 2009.
-
- Murray DM. Design and analysis of group-randomised trials. London: Oxford University Press; 1998.
-
- Campbell MJ, Walters SJ. How to design, analyse and report cluster randomised trials in medicine and health related research. Chichester: Wiley; 2014.
Publication types
MeSH terms
Grants and funding
LinkOut - more resources
Full Text Sources
Other Literature Sources
Research Materials
