. 2017 Apr 3;8(3):261-274.
doi: 10.1080/21505594.2016.1222334. Epub 2016 Aug 11.

Role of GATA transcription factor ELT-2 and p38 MAPK PMK-1 in recovery from acute P. aeruginosa infection in C. elegans

Affiliations

Role of GATA transcription factor ELT-2 and p38 MAPK PMK-1 in recovery from acute P. aeruginosa infection in C. elegans

Brian P Head et al. Virulence. .

Abstract

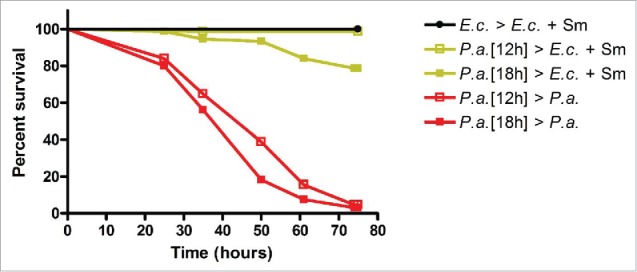
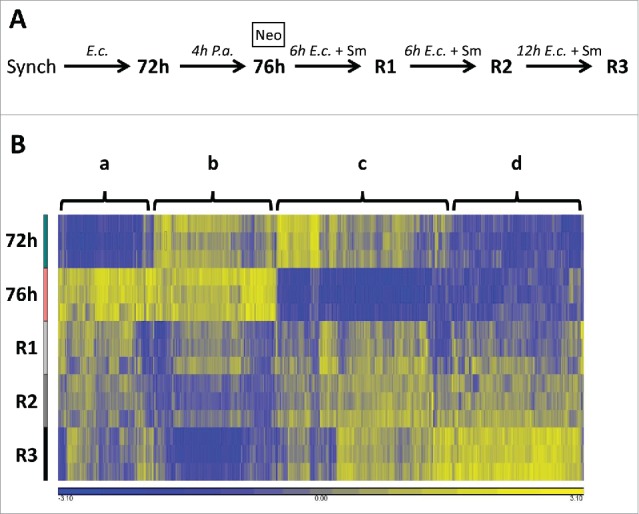
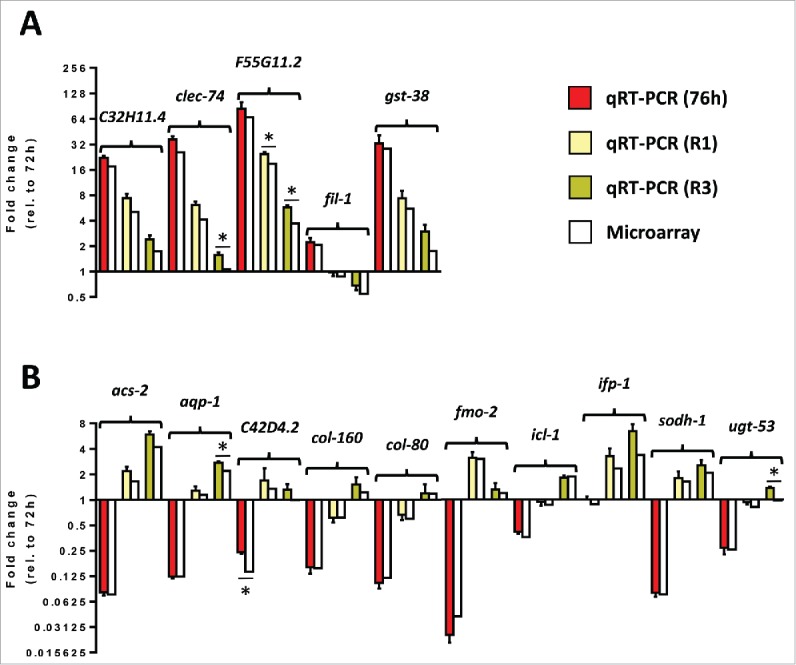
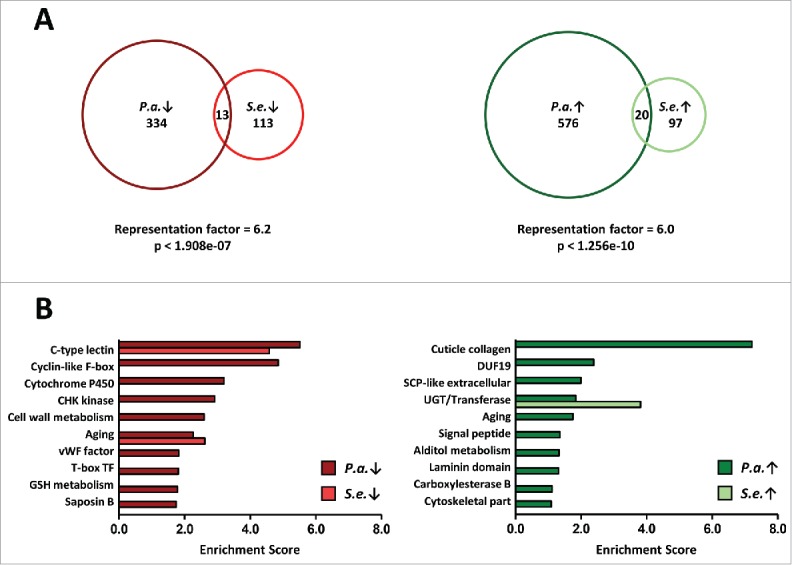
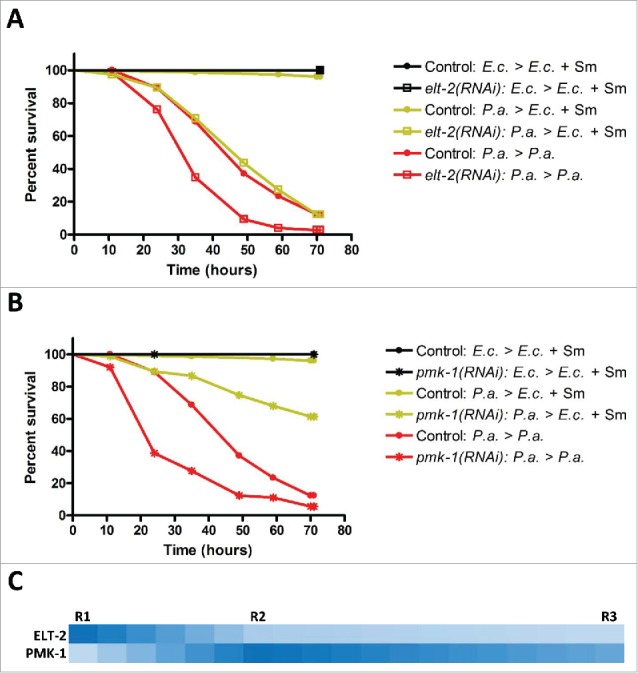
Infectious diseases caused by bacterial pathogens reduce the fitness of their associated host but are generally limited in duration. In order for the diseased host to regain any lost fitness upon recovery, a variety of molecular, cellular, and physiological processes must be employed. To better understand mechanisms underlying the recovery process, we have modeled an acute Pseudomonas aeruginosa infection in C. elegans using brief exposures to this pathogen and subsequent antibiotic treatment. To identify host genes altered during recovery from P. aeruginosa infection, we performed whole genome expression profiling. The analysis of this dataset indicated that the activity of the host immune system is down-regulated upon recovery and revealed shared and pathogen-specific host responses during recovery. We determined that the GATA transcription factor ELT-2 and the p38 MAP kinase PMK-1 are necessary for animals to successfully recover from an acute P. aeruginosa infection. In addition, we found that ELT-2 plays a more prominent and earlier role than PMK-1 during recovery. Our data sheds further light on the molecular mechanisms and transcriptional programs involved in recovery from an acute bacterial infection, which provides a better understanding of the entire infectious disease process.

Keywords: C. elegans; ELT-2; GATA; P. aeruginosa; PMK-1; acute; disease; host; immunity; infection; infectious; innate; p38 MAPK; pathogen; recovery; resolution.


Figures

Figure 1.
Figure 1.
Modeling recovery from acute P. aeruginosa infection in C. elegans. fer-1(b232ts) adult animals were exposed to E. coli or P. aeruginosa for 12 or 18 hours, treated with Neomycin, and then transferred to E. coli plus Streptomycin or P. aeruginosa plates and scored for survival. Scoring began 12 or 18 hours post initial exposure to E. coli or P. aeruginosa. n = 1.
Figure 2.
Figure 2.
Gene expression profiling reveals dynamic transcriptional responses over the entire course of acute infection and recovery. (A) Flowchart of animal cohorts collected for the microarray analysis. (B) Heat map depicting all 1,323 genes whose expression is downregulated or upregulated in one or more comparisons over the entire course of acute infection and recovery. Columns correspond to the 1,323 genes and are clustered. Rows correspond to the 5 time points collected and are arranged chronologically. Four broad clusters of genes, a-d, are indicated. Each column is normalized by shifting to a mean of zero and scaling to an SD of 1. Yellow hues indicate higher relative expression and blue hues indicate lower relative expression.
Figure 3.
Figure 3.
qRT-PCR confirms microarray gene expression data for a select subset of regulated genes. (A) Transcript levels of 5 selected down-regulated genes from adult animals exposed to P. aeruginosa for 4 hours, adult animals exposed to P. aeruginosa for 4 hours and then treated with Neomycin/Streptomycin for 6 hours, or adult animals exposed to P. aeruginosa for 4 hours and then treated with Neomycin/Streptomycin for 24 hours relative to L1 animals grown on E. coli for 72 hours. (B) Transcript levels of 10 selected up-regulated genes from adult animals exposed to P. aeruginosa for 4 hours, adult animals exposed to P. aeruginosa for 4 hours and then treated with Neomycin/Streptomycin for 6 hours, or adult animals exposed to P. aeruginosa for 4 hours and then treated with Neomycin/Streptomycin for 24 hours relative to L1 animals grown on E. coli for 72 hours. Red, yellow, and mustard correspond to fold changes determined using qRT-PCR at 76 h, R1, and R3, respectively. n = 3. SEM is shown. White bars correspond to fold changes determined using microarrays. Statistical significance is indicated (p < 0.05: *).
Figure 4.
Figure 4.
Shared and pathogen-specific responses during recovery from acute bacterial infection. (A) Proportional Venn diagrams showing the overlap of P. aeruginosa R3 and S. enterica downregulated recovery genes, left, and overlap of P. aeruginosa R3 and S. enterica upregulated recovery genes, right. (B) Gene ontology analysis of P. aeruginosa R3 and S. enterica recovery genes using the DAVID Bioinformatics Database. Enrichment scores of the down-regulated clusters are shown in the left panel. Enrichment scores of the up-regulated clusters are shown in the right panel. The top 10 P. aeruginosa recovery clusters are shown. Only the top 10 S. enterica recovery clusters that overlap with one of the top 10 P. aeruginosa recovery clusters are shown.
Figure 5.
Figure 5.
Sequential requirement for ELT-2 and PMK-1 activity during recovery from acute P. aeruginosa infection. (A) Control fer-1(b232ts) or fer-1(b232ts) elt-2(RNAi) adult animals were exposed to E. coli or P. aeruginosa for 12 hours and then transferred to E. coli plus Streptomycin or P. aeruginosa plates and scored for survival. (B) Control fer-1(b232ts) or fer-1(b232ts) pmk-1(RNAi) adult animals were exposed to E. coli or P. aeruginosa for 12 hours and then transferred to E. coli plus Streptomycin or P. aeruginosa plates and scored for survival. Scoring began 12 hours post initial exposure to E. coli or P. aeruginosa. Representative graph of n = 3 independent experiments. See also Figure S4. (C) Image depicting the relative intensity of the overlap between ELT-2-regulated and PMK-1-regulated gene sets and gene sets regulated during recovery from acute P. aeruginosa infection. A darker shade of blue is representative of a higher representation factor while a lighter shade of blue is representative of a lower representation factor.

Comment in

References

    1. Buckley CD, Gilroy DW, Serhan CN, Stockinger B, Tak PP. The resolution of inflammation. Nat Rev Immunol 2013; 13:59-66; PMID:23197111; http://dx.doi.org/10.1038/nri3362 - DOI - PubMed
    1. Buckley CD, Gilroy DW, Serhan CN. Proresolving lipid mediators and mechanisms in the resolution of acute inflammation. Immunity 2014; 40:315-27; PMID:24656045; http://dx.doi.org/10.1016/j.immuni.2014.02.009 - DOI - PMC - PubMed
    1. Serhan CN. Pro-resolving lipid mediators are leads for resolution physiology. Nature 2014; 510:92-101. Available from: http://www.ncbi.nlm.nih.gov/pubmed/24899309; PMID:24899309; http://dx.doi.org/10.1038/nature13479 - DOI - PMC - PubMed
    1. Head B, Aballay A. Recovery from an acute infection in C. elegans requires the GATA transcription factor ELT-2. PLoS Genet 2014; 10:e1004609; PMID:25340560; http://dx.doi.org/10.1371/journal.pgen.1004609 - DOI - PMC - PubMed
    1. Torres BY, Oliveira JHM, Thomas Tate A, Rath P, Cumnock K, Schneider DS. Tracking Resilience to Infections by Mapping Disease Space. PLoS Biol 2016; 14:e1002436; PMID:27088359; http://dx.doi.org/10.1371/journal.pbio.1002436 - DOI - PMC - PubMed

MeSH terms

Substances

LinkOut - more resources