

Spatiotemporal dynamics of the Ebola epidemic in Guinea and implications for vaccination and disease elimination: a computational modeling analysis
- PMID: 27600737
- PMCID: PMC5013652
- DOI: 10.1186/s12916-016-0678-3
Spatiotemporal dynamics of the Ebola epidemic in Guinea and implications for vaccination and disease elimination: a computational modeling analysis
Abstract
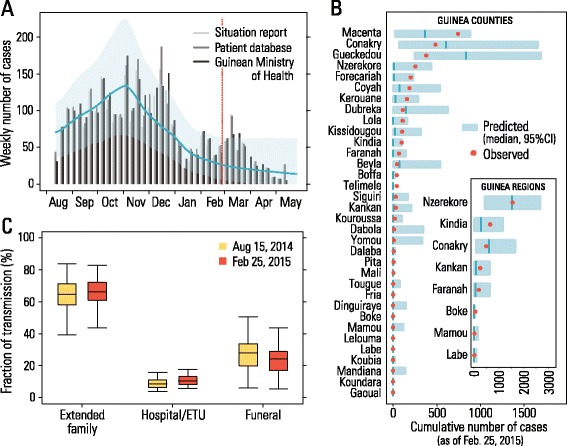
Background: Among the three countries most affected by the Ebola virus disease outbreak in 2014-2015, Guinea presents an unusual spatiotemporal epidemic pattern, with several waves and a long tail in the decay of the epidemic incidence.
Methods: Here, we develop a stochastic agent-based model at the level of a single household that integrates detailed data on Guinean demography, hospitals, Ebola treatment units, contact tracing, and safe burial interventions. The microsimulation-based model is used to assess the effect of each control strategy and the probability of elimination of the epidemic according to different intervention scenarios, including ring vaccination with the recombinant vesicular stomatitis virus-vectored vaccine.
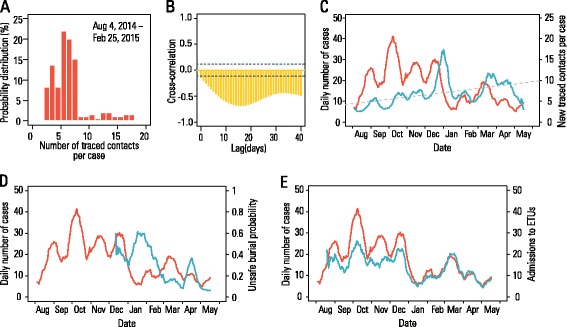
Results: The numerical results indicate that the dynamics of the Ebola epidemic in Guinea can be quantitatively explained by the timeline of the implemented interventions. In particular, the early availability of Ebola treatment units and the associated isolation of cases and safe burials helped to limit the number of Ebola cases experienced by Guinea. We provide quantitative evidence of a strong negative correlation between the time series of cases and the number of traced contacts. This result is confirmed by the computational model that suggests that contact tracing effort is a key determinant in the control and elimination of the disease. In data-driven microsimulations, we find that tracing at least 5-10 contacts per case is crucial in preventing epidemic resurgence during the epidemic elimination phase. The computational model is used to provide an analysis of the ring vaccination trial highlighting its potential effect on disease elimination.
Conclusions: We identify contact tracing as one of the key determinants of the epidemic's behavior in Guinea, and we show that the early availability of Ebola treatment unit beds helped to limit the number of Ebola cases in Guinea.
Keywords: Computational modeling; Ebola epidemiology; Intervention strategies.
Figures


Similar articles
-
The 2014 Ebola virus disease outbreak in Pujehun, Sierra Leone: epidemiology and impact of interventions.BMC Med. 2015 Nov 26;13:281. doi: 10.1186/s12916-015-0524-z. BMC Med. 2015. PMID: 26607790 Free PMC article.
-
Efficacy and effectiveness of an rVSV-vectored vaccine expressing Ebola surface glycoprotein: interim results from the Guinea ring vaccination cluster-randomised trial.Lancet. 2015 Aug 29;386(9996):857-66. doi: 10.1016/S0140-6736(15)61117-5. Epub 2015 Aug 3. Lancet. 2015. PMID: 26248676 Clinical Trial.
-
Efficacy and effectiveness of an rVSV-vectored vaccine in preventing Ebola virus disease: final results from the Guinea ring vaccination, open-label, cluster-randomised trial (Ebola Ça Suffit!).Lancet. 2017 Feb 4;389(10068):505-518. doi: 10.1016/S0140-6736(16)32621-6. Epub 2016 Dec 23. Lancet. 2017. PMID: 28017403 Free PMC article. Clinical Trial.
-
Role of contact tracing in containing the 2014 Ebola outbreak: a review.Afr Health Sci. 2017 Mar;17(1):225-236. doi: 10.4314/ahs.v17i1.28. Afr Health Sci. 2017. PMID: 29026397 Free PMC article. Review.
-
[Ebola hemorrhagic fever: its extension reflects the African sanitary disaster].Rev Prat. 2014 Sep;64(7):905-10. Rev Prat. 2014. PMID: 25362763 Review. French.
Cited by
-
The RAPIDD Ebola forecasting challenge: Model description and synthetic data generation.Epidemics. 2018 Mar;22:3-12. doi: 10.1016/j.epidem.2017.09.001. Epub 2017 Sep 20. Epidemics. 2018. PMID: 28951016 Free PMC article.
-
A conformable mathematical model of Ebola Virus Disease and its stability analysis.Heliyon. 2024 Aug 9;10(16):e35818. doi: 10.1016/j.heliyon.2024.e35818. eCollection 2024 Aug 30. Heliyon. 2024. PMID: 39247366 Free PMC article.
-
Generating synthetic population for simulating the spatiotemporal dynamics of epidemics.PLoS Comput Biol. 2024 Feb 12;20(2):e1011810. doi: 10.1371/journal.pcbi.1011810. eCollection 2024 Feb. PLoS Comput Biol. 2024. PMID: 38346079 Free PMC article.
-
Measurability of the epidemic reproduction number in data-driven contact networks.Proc Natl Acad Sci U S A. 2018 Dec 11;115(50):12680-12685. doi: 10.1073/pnas.1811115115. Epub 2018 Nov 21. Proc Natl Acad Sci U S A. 2018. PMID: 30463945 Free PMC article.
-
Detecting critical slowing down in high-dimensional epidemiological systems.PLoS Comput Biol. 2020 Mar 9;16(3):e1007679. doi: 10.1371/journal.pcbi.1007679. eCollection 2020 Mar. PLoS Comput Biol. 2020. PMID: 32150536 Free PMC article.
References
-
- World Health Organization. WHO Global Alert and Response. One year into the Ebola epidemic: a deadly, tenacious and unforgiving virus. 2015. http://www.who.int/csr/disease/ebola/one-year-report/introduction/en/. Accessed 29 Aug 2016.
-
- World Health Organization. WHO Global Alert and Response. Situation reports: Ebola response roadmap (2014–2015). http://apps.who.int/ebola/ebola-situation-reports. Accessed 29 Aug 2016.
-
- Guinean Ministry of Health. Rapport de la Situation Epidemiologique Maladie a Virus Ebola en Guinee. 2014–2015. In French. http://guinea-ebov.github.io/sitreps.html. Accessed 29 Aug 2016.
-
- Henao-Restrepo AM, Longini IM, Egger M, Dean NE, Edmunds WJ, Camacho A, Carroll MW, Doumbia M, Draguez B, Duraffour S, Enwere G, Grais R, Gunther S, Hossmann S, Konde MK, Kone S, Kuisma E, Levine MM, Mandal S, Norheim G, Riveros X, Soumah A, Trelle S, Vicari AS, Watson CH, Keta S, Kieny MP, Rottingen J-A. Efficacy and effectiveness of an rVSV-vectored vaccine expressing Ebola surface glycoprotein: interim results from the Guinea ring vaccination cluster-randomised trial. Lancet. 2015;386(9996):857–66. doi: 10.1016/S0140-6736(15)61117-5. - DOI - PubMed
-
- Merler S, Ajelli M, Fumanelli L, Gomes MF, Pastore y Piontti A, Rossi L, Chao DL, Longini IM, Halloran ME, Vespignani A. Spatiotemporal spread of the 2014 outbreak of Ebola virus disease in Liberia and the effectiveness of non-pharmaceutical interventions: a computational modelling analysis. Lancet Infect Dis. 2015;15(2):204–11. doi: 10.1016/S1473-3099(14)71074-6. - DOI - PMC - PubMed
MeSH terms
Grants and funding
LinkOut - more resources
Full Text Sources
Other Literature Sources
Medical
