. 2016 Nov;172(3):1418-1431.
doi: 10.1104/pp.16.01118. Epub 2016 Sep 6.

An NADPH-Oxidase/Polyamine Oxidase Feedback Loop Controls Oxidative Burst Under Salinity

Affiliations

An NADPH-Oxidase/Polyamine Oxidase Feedback Loop Controls Oxidative Burst Under Salinity

Katalin Gémes et al. Plant Physiol. 2016 Nov.

Abstract

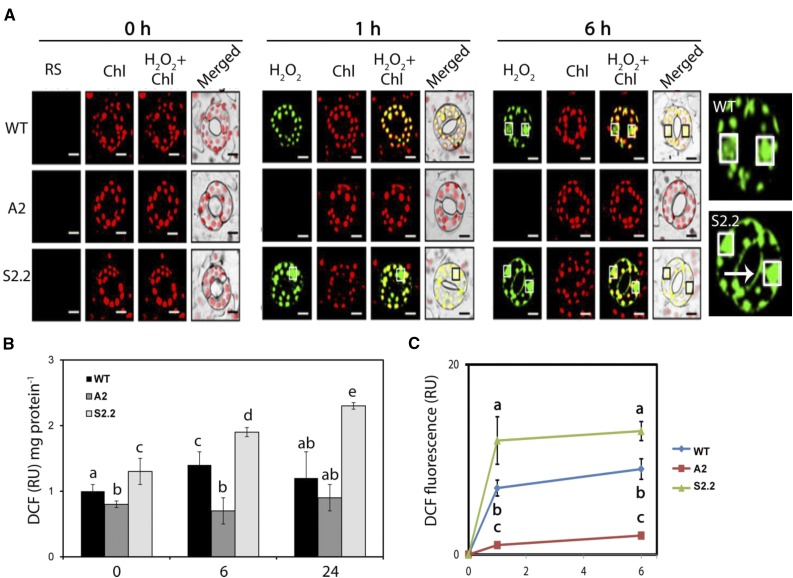
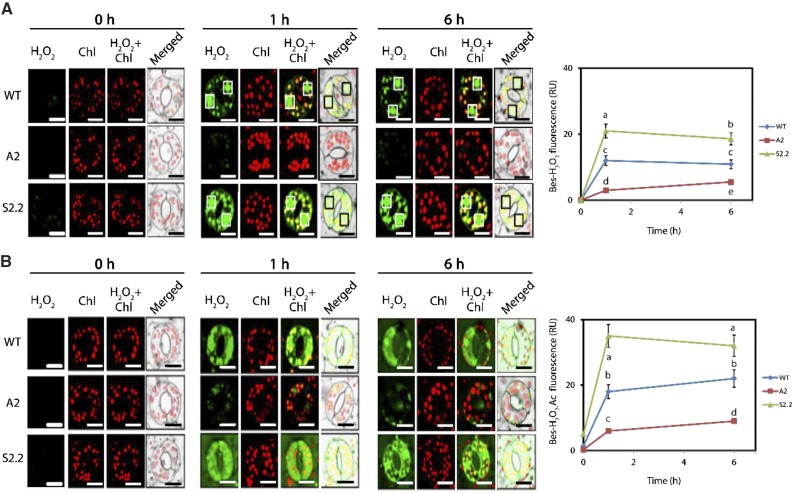
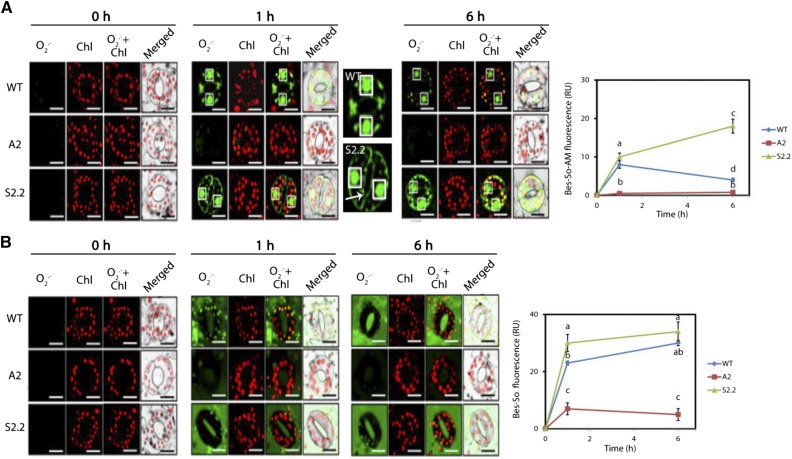
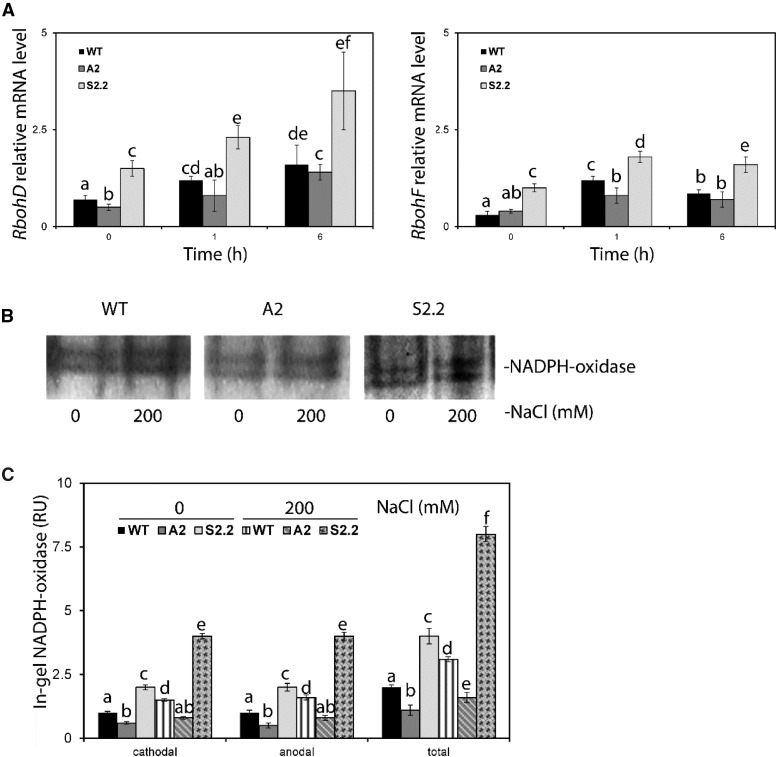
The apoplastic polyamine oxidase (PAO) catalyzes the oxidation of the higher polyamines spermidine and spermine, contributing to hydrogen peroxide (H2O2) accumulation. However, it is yet unclear whether apoplastic PAO is part of a network that coordinates the accumulation of reactive oxygen species (ROS) under salinity or if it acts independently. Here, we unravel that NADPH oxidase and apoplastic PAO cooperate to control the accumulation of H2O2 and superoxides (O2·-) in tobacco (Nicotiana tabacum). To examine to what extent apoplastic PAO constitutes part of a ROS-generating network, we examined ROS accumulation in guard cells of plants overexpressing or down-regulating apoplastic PAO (lines S2.2 and A2, respectively) or down-regulating NADPH oxidase (line AS-NtRbohD/F). The H2O2-specific probe benzene sulfonyl-H2O2 showed that, under salinity, H2O2 increased in S2.2 and decreased in A2 compared with the wild type. Surprisingly, the O2·--specific probe benzene sulfonyl-So showed that O2·- levels correlated positively with that of apoplastic PAO (i.e. showed high and low levels in S2.2 and A2, respectively). By using AS-NtRbohD/F lines and a pharmacological approach, we could show that H2O2 and O2·- accumulation at the onset of salinity stress was dependent on NADPH oxidase, indicating that NADPH oxidase is upstream of apoplastic PAO. Our results suggest that NADPH oxidase and the apoplastic PAO form a feed-forward ROS amplification loop, which impinges on oxidative state and culminates in the execution of programmed cell death. We propose that the PAO/NADPH oxidase loop is a central hub in the plethora of responses controlling salt stress tolerance, with potential functions extending beyond stress tolerance.


Figures

Figure 1.
Figure 1.
In situ ROS detection in leaves of wild-type (WT), A2, and S2.2 plants post-NaCl treatment. A, In situ detection of O2·− (blue) and H2O2 (brown) levels 1, 6, and 24 h post-NaCl treatment. Images are representative of three independent experiments with six leaf images per genotype in each time point. B, Quantification of O2·− (blue) and H2O2 (brown) signal from the in situ detection. NBT, Nitroblue tetrazolium; RU, relative units. C, H2O2 levels in leaves 3 and 24 h post-NaCl treatment. FW, Fresh weight; n.d., not detected. Data in B and C are means ± se of three independent experiments with three technical replicates each. Different letters indicate significant differences of Duncan’s multiple comparisons (P < 0.05).
Figure 2.
Figure 2.
RS detection in guard cells of wild-type (WT), A2, and S2.2 plants post-NaCl treatment. A, Confocal laser scanning microscopy (CLSM) images of DCF fluorescence (green; DCFDA staining) and chlorophyll (Chl) autofluorescence (red) at 0, 1, and 6 h post-NaCl treatment. White boxes (black in merged images) denote nuclei. Images at right show enlarged versions of wild-type and S2.2 guard cells (6 h). The arrow indicates the signal accumulation on the cell margins. Images are representative of three independent experiments with six micrographs per genotype in each time point. Bars = 20 μm. B, DCF fluorescence quantification in leaf extracts. C, Time-course quantification of DCF fluorescence in A. Data in B and C are means ± se of three independent experiments with three technical replicates each. Different letters indicate significant differences of Duncan’s multiple comparisons (P < 0.05). RU, Relative units.
Figure 3.
Figure 3.
Intracellular/extracellular H2O2 in guard cells of wild-type (WT), A2, and S2.2 plants post-NaCl treatment. A, Representative CLSM images of intracellular BES-H2O2-Ac fluorescence (green) and chlorophyll (Chl) autofluorescence (red) at 0, 1, and 6 h post-NaCl treatment. White boxes (black in merged images) denote nuclei. Images are representative of three independent experiments with six micrographs per genotype in each time point. Quantification of green signal is shown at right. Bars = 20 μm. B, CLSM images of intercellular BES-H2O2 fluorescence (green) and chlorophyll autofluorescence (red) at 0, 1, and 6 h post-NaCl treatment. White boxes (black in merged images) denote nuclei. Images are representative of three independent experiments with six micrographs per genotype in each time point. Quantification of green signal is shown at right. Bars = 20 μm. Data in charts at right are means ± se of three independent experiments with three technical replicates each. Different letters indicate significant differences of Duncan’s multiple comparisons (P < 0.05). RU, Relative units.
Figure 4.
Figure 4.
Intracellular/extracellular O2·− in guard cells of wild-type (WT), A2, and S2.2 plants post-NaCl treatment. A, CLSM images of intracellular BES-So-Am fluorescence (green) and chlorophyll (Chl) autofluorescence (red) at 0, 1, and 6 h post-NaCl treatment. White boxes (black in merged images) denote nuclei. Images next to the 1-h time point show enlarged versions of wild-type and S2.2 guard cells. The arrow indicates the signal accumulation on the cell margins. Images are representative of three independent experiments with six micrographs per genotype in each time point. Quantification of green signal is shown at right. Bars = 20 μm. B, CLSM images of intercellular BES-So fluorescence (green) and chlorophyll autofluorescence (red) at 0, 1, and 6 h post-NaCl treatment. White boxes (black in merged images) denote nuclei. Images are representative of three independent experiments with six micrographs per genotype in each time point. Quantification of green signal is shown at right. Bars = 20 μm. Data in charts at right are means ± se of three independent experiments with three technical replicates each. Different letters indicate significant differences of Duncan’s multiple comparisons (P < 0.05). RU, Relative units.
Figure 5.
Figure 5.
mRNA levels and activity of NADPH oxidase in wild-type (WT), A2, and S2.2 leaves post-NaCl treatment. A, Abundance of mRNA levels of RbohD (left) and RbohF (right) in leaves post-NaCl treatment with 200 mm NaCl. B, Gel images showing the in gel activity assay of NADPH oxidase 1 h post-NaCl treatment with 200 mm NaCl. Images are representative of three independent experiments with one technical replicate in each (one gel). C, Quantification of anodal and cathodal isoenzymes of NADPH oxidase. A similar isoenzyme pattern has been reported previously in tobacco (Sagi and Fluhr, 2001). Data in A and C are means ± se of three independent experiments with three technical replicates. Different letters indicate significant differences of Duncan’s multiple comparisons relative to the wild type (P < 0.05). RU, Relative units.
Figure 6.
Figure 6.
Intracellular/extracellular H2O2 in guard cells of wild-type (WT), AS-NtRbohD, and AS-NtRbohF plants post-NaCl treatment. A, CLSM images of intracellular BES-H2O2-Ac fluorescence (green) and chlorophyll (Chl) autofluorescence (red) at 0, 1, and 6 h post-NaCl treatment. White boxes denote nuclei. Images are representative of three independent experiments with six micrographs per genotype in each time point. Bars = 20 μm. B, CLSM images of intercellular AUR fluorescence (red) at 0, 1, and 6 h post-NaCl treatment. Images are representative of three independent experiments with six micrographs per genotype in each time point. Bars = 20 μm.
Figure 7.
Figure 7.
Intracellular/extracellular O2·− in guard cells of wild-type (WT), AS-NtRbohD, and AS-NtRbohF plants post-NaCl treatment. A, CLSM images of intracellular BES-So-Am fluorescence (green) and chlorophyll (Chl) autofluorescence (red) at 0, 1, and 6 h post-NaCl treatment. White boxes (black in merged images) denote nuclei. Images are representative of three independent experiments with six micrographs per genotype in each time point. Quantification of green signal is shown at right. Bars = 20 μm. B, CLSM images of intercellular BES-So fluorescence (green) and chlorophyll autofluorescence (red) at 0, 1, and 6 h post-NaCl treatment. White boxes denote nuclei. Images are representative of three independent experiments with six micrographs per genotype in each time point.

References

    1. Andronis EA, Moschou PN, Toumi I, Roubelakis-Angelakis KA (2014) Peroxisomal polyamine oxidase and NADPH-oxidase cross-talk for ROS homeostasis which affects respiration rate in Arabidopsis thaliana. Front Plant Sci 5: 132. - PMC - PubMed
    1. Angelini R, Cona A, Federico R, Fincato P, Tavladoraki P, Tisi A (2010) Plant amine oxidases “on the move”: an update. Plant Physiol Biochem 48: 560–564 - PubMed
    1. Ashtamker C, Kiss V, Sagi M, Davydov O, Fluhr R (2007) Diverse subcellular locations of cryptogein-induced reactive oxygen species production in tobacco Bright Yellow-2 cells. Plant Physiol 143: 1817–1826 - PMC - PubMed
    1. Baxter A, Mittler R, Suzuki N (2014) ROS as key players in plant stress signaling. J Exp Bot 65: 1229–1240 - PubMed
    1. Bosch M, Berger S, Schaller A, Stintzi A (2014) Jasmonate-dependent induction of polyphenol oxidase activity in tomato foliage is important for defense against Spodoptera exigua but not against Manduca sexta. BMC Plant Biol 14: 257. - PMC - PubMed

Publication types

MeSH terms

LinkOut - more resources